
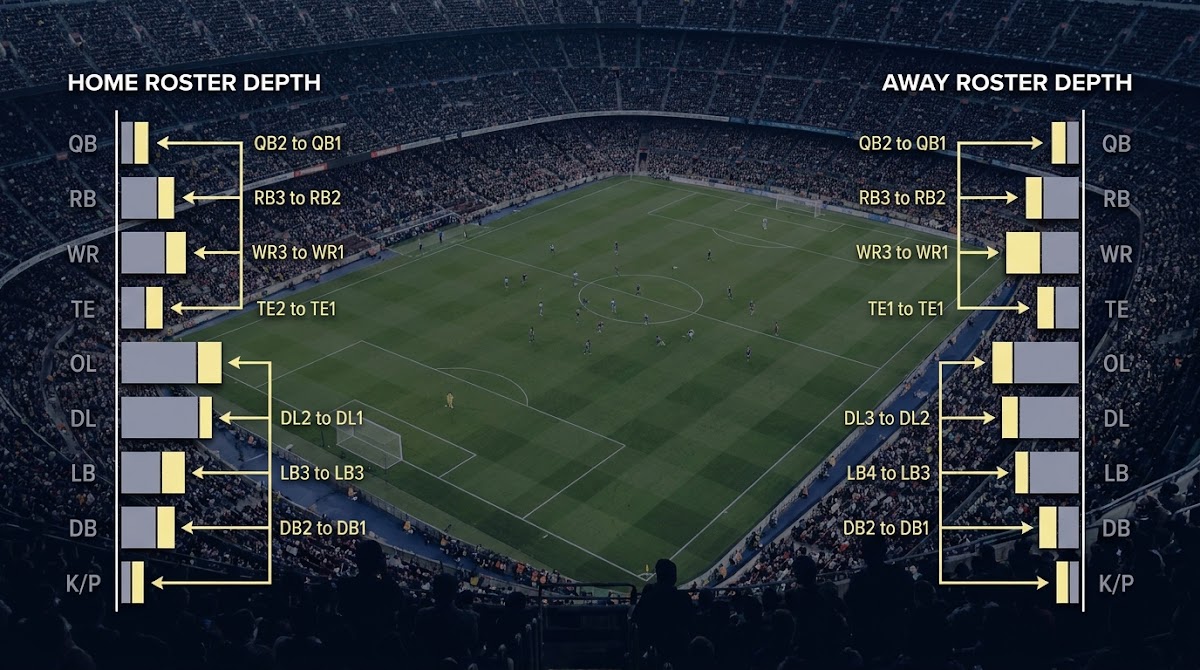
Why Talent Gaps Matter in College Football: definition and context
When we ask Why Talent Gaps Matter in College Football we mean a measurable difference in roster quality and readiness between two teams, not a vague sense of one side being "better." At its simplest, a talent gap combines a roster-talent baseline, transfer-portal net movement, and returning production or experience to give analysts a quantitative starting point for forecasts and game planning. That framing helps separate long-term season ceilings from the week-to-week readiness that actually determines most game outcomes. For a concise example of recruiting concentration and its relationship to contenders, see the Blue-Chip Ratio 2024 coverage and our blog Funded Plays blog.
The three measurable forces that shaped talent gaps from 2024 into 2026 are clear: recruiting concentration on elite rosters, roster churn from the transfer portal, and differences in returning production and experience. The Blue-Chip Ratio 2024 shows how recruiting concentration underpins season ceilings, while team-level talent composites provide the roster baseline, and the NCAA transfer-portal trends document how offseason movement reshapes depth and quality. These three forces together form the practical inputs any analyst should start with when quantifying gaps.
Defining the term matters because different users approach roster differences with different goals. Coaches may care about position-by-position depth and situational readiness, analysts may want a single composite to feed a probabilistic model, and fans often want a simple explanation for why a favored team is a longer shot than its reputation suggests. This article explains a repeatable method to move from raw recruit lists and transaction logs to matchup-level estimates, and then shows how to use those estimates in projections and game plans.

What we mean by a talent gap
A talent gap is measurable, repeatable, and defensible. It starts with a roster-talent composite that aggregates recruit-star ratings and other available player evaluations to set a baseline. From there, portal movement and returning production change the picture: an influx of experienced transfers can narrow a gap, and a large net loss or a young roster can widen it. Grounding qualitative judgments in these inputs reduces surprise and improves forecast discipline.
The three measurable forces shaping gaps in 2024-2026
Recruiting concentration, transfer-portal churn, and returning production are the most actionable, measurable forces shaping talent gaps across the 2024 to 2026 window. Recruiting concentration matters for season ceilings because historical title contention aligns with rosters dominated by four- and five-star players, as described in the Blue-Chip Ratio 2024 analysis. Those recruit-quality baselines are then reshaped each offseason by transfer activity and the fraction of production that returns to the team.

How recruiting concentration sets season ceilings
Blue-Chip Ratio and what it measures
The Blue-Chip Ratio concept highlights that teams with a majority of four- and five-star recruits have historically been the realistic contenders for a national championship, which directly ties recruiting concentration to long-term ceilings. That finding helps analysts and staff set expectations for what a roster can reasonably achieve over a season rather than inflating short-term hopes from a few breakout games; for the full discussion of the Blue-Chip Ratio methodology and implications, see the Blue-Chip Ratio 2024 analysis at CBS Sports CBS Sports Blue-Chip Ratio 2024.
Because recruiting concentration is persistent, it defines an upper bound on seasonal performance. A roster composed predominantly of higher-rated recruits tends to have more starting-level talent across skill positions and trenches, greater internal competition at key spots, and a deeper bench over the course of a long season. That does not guarantee a championship, but it limits how far a team can realistically climb against opponents with concentrated blue-chip talent.
Team talent composites: aggregating star ratings into a roster baseline
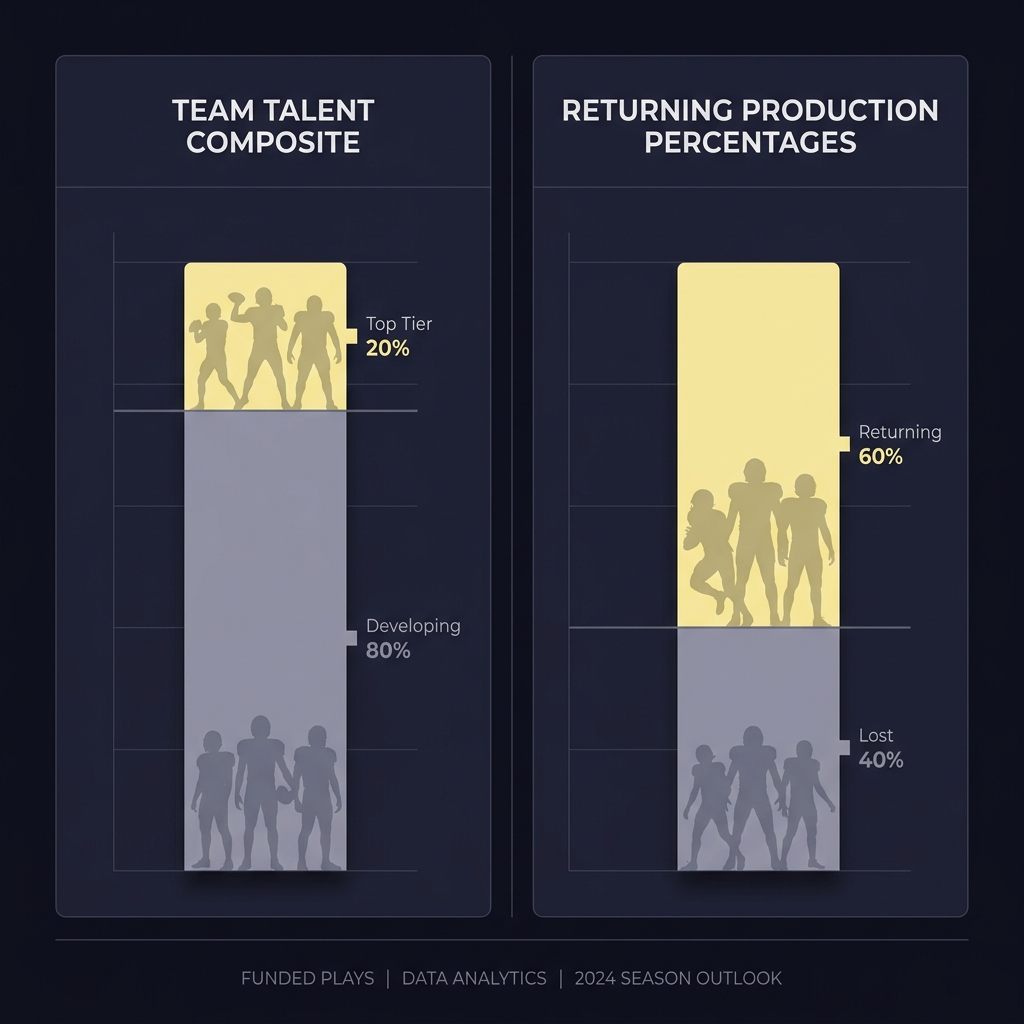
Team Talent Composite rankings aggregate recruit-level ratings into a single roster measure that is useful as a preseason baseline. These composites are not a complete prediction but they provide a stable input before accounting for continuity and the portal. Analysts commonly use a team composite as the starting point for matchup evaluation because it summarizes where blue-chip talent is concentrated across programs; for a standard example, consult the 2024 247Sports Team Talent Composite 247Sports team talent composite 2024. For current aggregator data see the 247Sports 2026 Team Talent Composite 247Sports 2026 team composite.
Importantly, a recruit-quality baseline and on-field readiness are different things. Star ratings capture perceived long-term ability and projection, while readiness depends on experience, scheme fit, coaching, and recent playing time. Still, the baseline matters: over a season the underlying talent pool constrains how often a team can sustain high-level play, especially when injuries and attrition occur.
Transfer Portal and roster churn: why movement widens or narrows gaps
How the portal changes roster composition each offseason
The transfer portal has become a major mechanism for altering roster quality between seasons, producing meaningful year-to-year volatility. The NCAA's 2024 report on transfer-portal trends documents substantial Division I movement and outcomes, confirming that portal activity materially reshapes roster depth and quality each cycle. When assessing talent gaps, portal-driven change can no longer be treated as a secondary noise term; it is a primary input for any serious preseason evaluation NCAA transfer-portal trends 2024. For additional context on recent portal classes see ESPN's coverage of the top portal classes in 2026 College football top portal classes 2026.
Net additions and net losses are more informative than raw transfer counts. A program that brings in several experienced starters while losing only deep reserves will improve its roster differently than a program that trades away starters for unproven recruits. Net impact focuses attention on where incoming players can immediately influence matchups and where losses create gaps in depth charts that matter late in games or through injury waves.
Template to calculate transfer-net and roster-composite adjustments
Use school transaction lists and recruit ratings to populate entries
Net additions, depth implications, and volatility
Once net transfer impact is computed, the next step is to assess depth implications. Transfers often arrive with college experience and can be especially valuable at positions where experience steeply matters, such as quarterback or offensive line. Conversely, a net loss of rotational linemen or linebackers can quickly create late-game fatigue and increase the chance that performance drops versus deeper opponents. The portal's net effect therefore alters not just the starting lineup comparison but the second- and third-level depth that often decides close games.
Because portal windows have become predictable calendar events, roster churn also introduces timing effects teams must manage. Late additions may not be fully integrated before season openers, and late losses can leave coaches with limited options. Analysts should track not only the net number of transfers but the timing and positional distribution to understand how quickly roster changes will translate to on-field performance.
Returning production and experience: the continuity multiplier
Why returning snaps and production matter
Returning production measures how much of last season's on-field output returns for the new season. Predictive systems and preseason rankings bake this continuity into expectations because players who have already produced at the college level generally project to be more reliable early in the season than raw recruits. SP+ and similar systems explicitly weight returning production alongside recruiting because continuity reduces uncertainty in projections and increases short-term readiness ESPN explanation of SP+.
Experience charts, such as the one compiled by Phil Steele, provide a position-level view of who returns snaps and who does not. That information helps convert a roster-talent composite into an actionable expectation for the opener: two teams with similar recruit composites can present very different early-season threats if one returns most of its production and the other replaced starters with freshmen or transfers Phil Steele experience chart 2024.
SP+ inputs and Phil Steele experience measures
SP+ is designed to combine efficiency metrics, opponent adjustments, and roster continuity to produce preseason and in-season projections. Its approach shows why combining a talent composite with returning-production inputs produces better matchup expectations than either input alone. For a technical overview of how predictive systems treat continuity and recruiting together, see the SP+ explanation at ESPN SP+ model overview.
Using returning production as a multiplier on a talent baseline is a practical way to reflect readiness. For example, if a roster composite suggests a small deficit at the line but the team returns most starters and rotational players, the effective gap in early-season matchups will be smaller than the composite alone implies. Conversely, a roster with strong recruits but little returning production may underperform its talent rating until players gain experience.
A practical workflow to quantify a matchup's talent gap
Step 1: build or fetch a roster-talent composite
Step one is to establish a roster-talent composite that aggregates recruit ratings into a team-level score. Use an established composite when available to save time; these rankings provide a defensible baseline for where blue-chip talent concentrates across programs. For a ready example of a roster composite, the 2024 247Sports team-level aggregator is a commonly used public baseline 247Sports team talent composite 2024.
When building your own composite, document how star ratings map to numeric values, whether you weight recent classes more heavily, and how you handle transfers whose college performance is already observable. These choices should be explicit because they materially change the composite and therefore downstream matchup estimates. For an example workflow, see how Funded Plays evaluations work here.
Combine a roster-talent composite as the prior, apply a transfer-net adjustment based on incoming and outgoing experience, and use returning-production percentages as a multiplier for short-term readiness; document assumptions and run sensitivity checks to identify fragile forecasts.
Step 2: adjust for transfer portal net impact
Step two applies a transfer-net adjustment to the roster composite. Calculate incoming transfer value using prior college performance, recruit rating, or a simple experience multiplier, and subtract losses similarly. The result is a net change to the roster baseline that can be converted into expected point-margin shifts or probability adjustments depending on your modeling framework. Remember that the NCAA transfer-portal trends confirm this is a major driver of roster volatility, so the adjustment should not be treated as optional NCAA transfer-portal trends 2024.
Document assumptions such as how much weight you give a returning starter versus a highly-rated incoming transfer, and be explicit about timing. Late transfers may be worth less in the opener than transfers who participate fully in spring and fall practice. Keeping a simple audit trail of these assumptions makes it possible to revisit and refine the adjustment as new information arrives.
Step 3: layer in returning production and experience
The final step overlays returning production and experience measures to reflect readiness. Convert returning snaps or returning-production percentages into a multiplier that scales the adjusted composite. Predictive systems like SP+ already use this kind of combination, which is why aligning custom adjustments with those systems is often the most efficient approach SP+ model overview.
Be explicit about limits and uncertainty. For example, injuries, eligibility appeals, and late coaching changes can all invalidate assumptions about returning production. Where possible, run sensitivity checks that show how much the matchup estimate moves if you alter the returning-production multiplier within plausible bounds. That practice highlights which games are robust and which are fragile to small measurement changes.
How talent differences translate to game outcomes and strategy
Direct matchup channels: skill positions and line play
Talent gaps often show up most clearly in the trenches and in the quality of quarterback play. A measurable advantage in offensive line talent can create sustained time-of-possession advantages, improved third-down conversion, and higher red-zone efficiency, while a clear advantage at quarterback can magnify otherwise small mismatches elsewhere on the roster. Translating a talent composite into positional impacts helps coaches prioritize matchups and play calls 247Sports team talent composite 2024.
Analysts should map composite differences to channel-level metrics such as rush success, pass protection rates, and explosive play propensity. Those channels are where talent differences convert into expected margins and are also where scheme and coaching can best mitigate or amplify roster advantages. Using a channel-focused view makes talent-gap insights actionable for game planning rather than simply descriptive.
Depth, situational football, and special teams effects
Depth matters because games are won and lost after the starters tire, suffer injury, or must be rotated for matchups. A talent-gap assessment that ignores secondary and rotational depth will overstate the sustainability of a lead or the ability to withstand an opponent's rush at the end of a game. Special teams and situational football are frequently underrated channels where depth and experience pay off in field position, turnover margins, and close-game execution; these subtle effects accumulate and often decide narrowly contested games.

Coaches can respond by altering risk tolerance, for example by avoiding extended fourth-down attempts against teams with deeper defensive lines, or by scheming for quick strikes to negate depth advantages. The strategic response depends on which channel the talent gap most affects and on the coach's willingness to adjust play-calling and tempo.
Practical examples and scenarios
Example A: elite roster vs. upper-mid roster
Scenario A compares a roster whose composite shows concentrated blue-chip talent against an upper-mid roster with fewer high-rated recruits. Starting from the composite, an analyst sees a baseline gap in line play and wide receiver depth. If transfers and returning production are neutral, the roster baseline alone suggests a season-level advantage and a preseason favorite designation. But if the underdog returns most of its production while the favorite lost key rotational pieces, the effective gap for early-season matchups shrinks materially.
This narrative shows why composites matter for season ceilings but also why continuity can compress expected margins early in the year. In short, a talent-composite advantage predicts ceiling and sustainability, while returning production predicts immediate readiness.
Get regular talent-gap analyses and pregame checklists
Subscribe to receive regular talent-gap breakdowns, model adjustments, and pregame checklists delivered to your inbox to support data-driven previews.
Example B: portal-rebuilt roster vs. veteran continuity
Scenario B pits a roster that improved via transfers against a team that retained most starters. The portal-rebuilt roster may look stronger on paper after incoming transfers, but the veteran team often has better early-season cohesion and fewer installation errors. If the incoming transfers include experienced starters at key positions, the portal rebuild can quickly erase a talent gap after a short period; the NCAA portal trends demonstrate how often movement reshapes rosters across Division I NCAA transfer-portal trends 2024. See CBSSports analysis of the 2026 transfer cycle CBSSports 2026 transfer cycle.
The practical takeaway is that timing and positional distribution of transfers determine whether a portal rebuild creates an immediate edge or a medium-term improvement. Analysts should report both the short-run and medium-run expectations rather than a single static verdict.
How small talent gaps change game plans
When gaps are small, game plans often shift from trying to out-talent the opponent to trying to create advantageous matchups, limit opponent strengths, and increase variance where the underdog benefits. That can mean more creative play-calling, faster tempo to exploit inexperienced substitutions, or focusing on turnovers and special teams. The same composite gap can therefore imply very different on-field decisions depending on where talent is concentrated and how deep the roster is.
Decision criteria for analysts and staff
When a talent gap justifies changing the game plan
Adopt clear thresholds such as: if the adjusted composite plus returning-production overlay indicates a multi-possession expected margin, consider conservative play-calling and clock-control strategies; if the gap is narrow but depth is weak, plan for late-game fatigue and emphasize clock management. These thresholds should be calibrated to roster realities and the opponent's scheme, not to raw star counts alone. For guidance on blending talent and continuity into preseason projections, see SP+ methodology discussions which illustrate how models weight these inputs SP+ explanation.
Red flags that justify tactical change include a large net loss in starting-caliber players from the portal, a sudden collapse in positional depth due to injuries, or a mismatch in line play that is unlikely to be corrected by schematic tweaks. When these red flags appear, staff should document contingency plans and adjust risk tolerance accordingly.
Thresholds and red flags to watch
Concrete red flags to monitor are: net negative transfers at a position group combined with low returning-production percentages; several starters listed as questionable or out in the 24 to 72 hours before kickoff; and performance trends in situational metrics such as third-down defense or red-zone offense that previously correlated with depth issues. These diagnostics help prioritize which talent-gap signals require immediate tactical responses.
Common mistakes and pitfalls in measuring talent gaps
Overreliance on star ratings
Relying solely on star ratings can misstate short-term readiness and depth vulnerabilities because star ratings are projection tools rather than instant performance measures. Historical analyses show star ratings correlate with long-term outcomes but can miss college-level production nuances that returning-production metrics capture; for the Blue-Chip Ratio context see the CBS Sports coverage of the topic Blue-Chip Ratio at CBS Sports.
Corrective action: combine star-based composites with returning-production overlays and position-level depth checks, and avoid treating star sums as match-level guarantees. Document the limits of each input so decision makers understand the relative confidence in each adjustment.
Ignoring special teams and depth
Another common error is excluding special teams and non-starting contributors from depth assessments. These players often create field-position advantages and can produce turnovers that change game outcomes. Analysts should include special-teams reliability and rotational performance when evaluating how sustainable a talent advantage will be across four quarters.
Corrective action: add a simple rotation and special-teams flag in your pregame checklist to ensure these contributors are considered in final matchup estimates.
Misreading transfer volume without net context
Counting portal entries without assessing net impact exaggerates change. High transfer volume is normal across Division I, but the substantive question is who left, who arrived, and which positions changed in quality and experience. The NCAA transfer-portal trends report provides useful context for how common movement has become and why net measures are superior to raw counts NCAA transfer-portal trends 2024.
Corrective action: always compute a net-transfer metric for the roster and annotate positional distributions rather than relying on total transfer counts alone.
Integrating talent-gap measures into probabilistic models
Weighting recruit composite, transfers, and returning production
A pragmatic approach is to treat the roster-talent composite as the prior, the transfer-net as a directed update, and returning production as a confidence multiplier. In practice, that can look like weighting the composite for long-run ceilings, applying a transfer adjustment proportional to estimated on-field value, and scaling uncertainty down when returning production is high. SP+ and similar systems already implement comparable logic, which is why analysts often align custom adjustments with those systems rather than rebuild entire models from scratch SP+ methodology.
Provide recommended relative weightings as guiding principles rather than fixed rules, for example: treat the composite as the 40 to 60 percent baseline for season-long ceilings, transfer-net adjustments as a 20 to 40 percent directional modifier depending on experience, and returning production as a 10 to 30 percent multiplier on short-term readiness. These ranges are starting points; sensitivity testing is essential to validate them against actual outcomes.
Model uncertainty and sensitivity checks
Run sensitivity checks that vary the transfer and returning-production parameters within plausible bounds to see which match forecasts are robust. If small parameter changes flip a favorite to an underdog, label that forecast as high-uncertainty and communicate contingency scenarios. Sensitivity analysis helps prioritize where to gather better data and where to accept model fragility.
Be transparent about limits: roster evaluations rarely capture intangible coaching changes, midseason development, or sudden eligibility shifts. Where possible, present a base case, optimistic case, and pessimistic case to show a range of plausible outcomes rather than a single deterministic prediction.
Policy, NIL, and future factors that could change talent gaps
Why NIL dynamics and portal rule changes matter
Non-quantitative factors such as NIL dynamics, portal rule changes, and multi-year eligibility can alter how recruiting concentration and continuity translate to on-field outcomes. For example, shifts in transfer timing or eligibility rules could change the effective value of recruiting stars versus experienced returnees. These items are open questions rather than settled facts and should be monitored as part of long-term talent-gap analysis.
Open questions for 2026 and beyond
Key open questions for 2026 include whether portal windows and NIL arrangements will make rapid roster improvements more or less common, and whether multi-year eligibility adjustments change the weight of returning production in preseason models. Analysts should track policy updates and incorporate structural changes into model assumptions rather than treating past correlations as immutable.
Quick pregame checklist to assess talent gaps
Data to pull 24 to 72 hours before kickoff
Use this short checklist 24 to 72 hours before kickoff: pull the current roster-talent composite, compute transfer-net changes in the last window, check top returning-production percentages, review injury statuses for starters, and validate depth at critical positions such as offensive line and quarterback. For examples of how to present these items, see our blog here.
Suggested public sources for these items include team composite pages, official transfer transaction lists from the NCAA, and returning-production summaries commonly published by preseason analysts. Document the assumptions you make about availability and integration of late arrivals to keep the preview auditable and repeatable.
Simple diagnostics to prioritize during preview
Prioritize these diagnostics: net change at line-of-scrimmage positions, percentage of starting production returning on offense and defense, and the presence of experienced backups. If two or more diagnostics are negative, downgrade the matchup estimate and increase contingencies in play-calling and personnel plans.
Conclusion: what coaches, analysts, and fans should remember
Key takeaways
Talent gaps are measurable and meaningful because recruiting concentration sets season ceilings, the transfer portal reshapes rosters between seasons, and returning production determines early-season readiness. Combining a roster-talent composite with transfer-net adjustments and returning-production overlays yields more accurate matchup estimates than any single input alone. For the season-context on recruiting concentration and team composites, see the Blue-Chip Ratio and the 247Sports team talent composite coverage Blue-Chip Ratio 2024.
Next steps: adopt the three-step workflow described here, run sensitivity checks to understand where predictions are fragile, and document all assumptions when using talent-gap assessments for decisions. That discipline produces defensible forecasts and clearer tactical planning across the season. Visit Funded Plays here.
Start with a roster-talent composite, adjust for net transfers, then layer in returning-production percentages to reflect readiness. Document assumptions and run a sensitivity check.
Transfers can significantly narrow gaps, especially when incoming players have college production, but timing, position fit, and integration determine how quickly that benefit appears.
No. Star ratings are useful for season ceilings but should be combined with returning production and depth checks to assess short-term readiness.
References
- https://www.fundedplays.com/challenges
- https://www.fundedplays.com/blogs
- https://www.cbssports.com/college-football/news/blue-chip-ratio-2024-these-are-the-college-football-teams-that-can-win-a-national-championship/
- https://247sports.com/Season/2024-Football/CollegeTeamTalentComposite/
- https://247sports.com/season/2026-football/collegeteamtalentcomposite/
- https://www.ncaa.org/news/2024/10/28/trends-in-the-transfer-portal-division-i-2024.aspx
- https://www.espn.com/college-football/story/_/id/47684263/college-football-transfer-portal-2026-top-classes
- https://philsteele.com/2024/06/25/experience-chart-2024/
- https://www.espn.com/college-football/story/_/id/40786271/what-sp-plus-college-football-ranking-prediction-model-explained
- https://www.cbssports.com/college-football/news/college-football-transfer-portal-2026-retention-gap-conference-tiers/
- https://www.fundedplays.com/blogs/how-fundedplays-evaluations-work
- https://www.fundedplays.com