
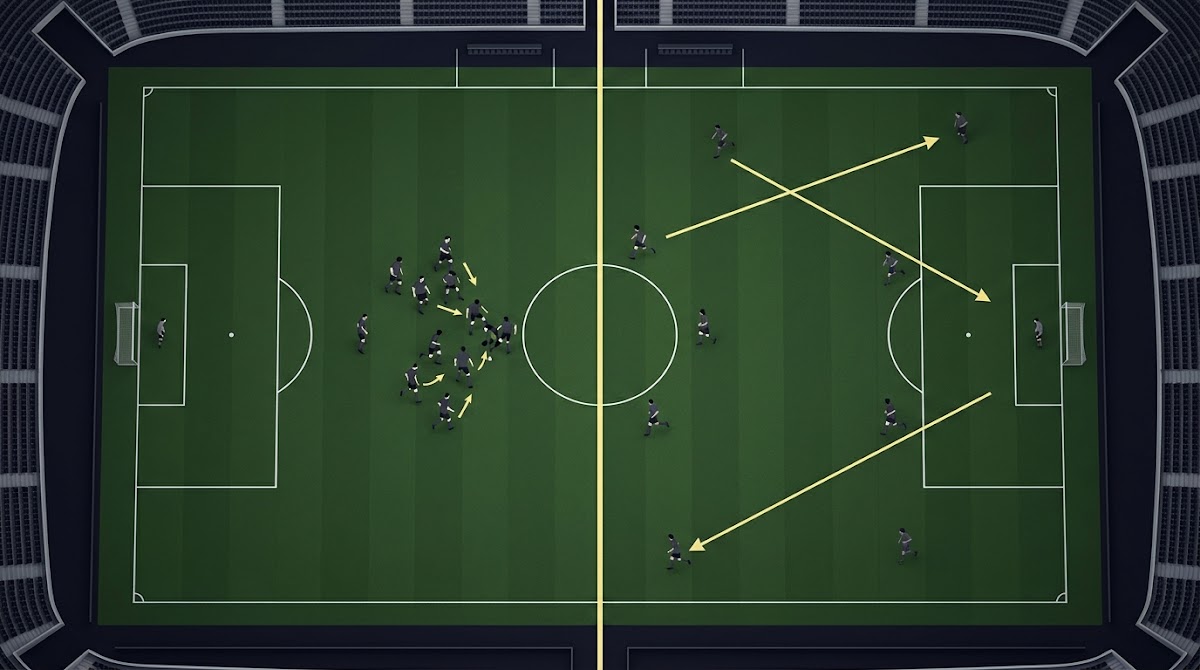
Why Style Matchups Matter More Than Records: the core idea
Why Style Matchups Matter More Than Records is not just a slogan, it is a practical observation about prediction. At its simplest, playing styles are repeatable patterns of behavior on the field or court, measured by pressing intensity, directness of attack, pace, coverage schemes or platoon splits, and those patterns often determine how teams interact in a single game.
Records compress many different contexts into a single number. A 7-3 team might have accumulated wins against weak opponents, benefited from home advantage, or succeeded when key players were healthy. Conversely, a 4-6 team could match up perfectly against a specific opponent because of stylistic fit rather than form. The systematic review of playing styles shows that data derived style clusters, like direct play versus high press or possession, consistently associate with performance indicators beyond raw outcomes, making style diagnostics a repeatable signal for forecasting team playing styles in football: a systematic review.
Matchups often provide a stronger predictive signal than raw records for single games because they capture tactical fit, platoon effects and opponent context that records aggregate away.
That pattern explains why a team with a worse record can still be favored on paper when its core strengths exploit the opponent's structural weaknesses. UEFA technical analysis from recent international competition also documents how contrasting tactical styles, such as aggressive pressing versus direct counterattack, decided key matches even when pre-tournament records suggested different expectations UEFA EURO 2024 Technical Report.
For anyone making predictions, the takeaway is simple: treat records as a background signal and let matchup diagnostics be the front-line input when single-game outcomes matter.

How analysts measure playing styles and matchups
Breaking styles into measurable pieces starts with data. Event data records the who-what-when of passes, shots and defensive actions. Tracking data adds location and speed, which lets analysts calculate pressing intensity, transition frequency and positional spacing. Box score adjustments and possession metrics help normalize output for tempo so that pace does not masquerade as quality.
Researchers typically convert these inputs into style vectors like passes per defensive action, pass length distribution, share of shots from transitions, or platoon performance splits, then use clustering or classification to group teams into archetypes. The systematic review describes common clustering approaches and shows how those clusters map to on-field outcomes when properly validated team playing styles in football: a systematic review.
Those clusters provide the practical payoff: once a team is assigned to a style archetype, a forecaster can ask whether that archetype fits or conflicts with an opponent's archetype. Good clusters balance interpretability and predictive value, but they need opponent adjustment to avoid confounding sample effects with true stylistic strength.
Why matchup analysis often beats records in predictions
There are three mechanical reasons matchup diagnostics can outperform simple records. First, tactical fit matters. A team built to press high can struggle against direct transition teams that thrive on space behind the press. Second, platoon and matchup microeffects such as handedness or pitch mix create repeated biases that records do not capture. Third, opponent adjusted efficiency measures account for strength of schedule and in-game context, which raw records omit.
UEFA's technical work illustrates the first point, showing several instances where tactical contrasts, not prior form, explained match outcomes UEFA EURO 2024 Technical Report.
Practice matchup-focused forecasting with FundedPlays Challenges
If you want to practice this approach in a structured environment, consider trying a challenge that rewards disciplined, repeatable forecasting rather than single results.
The NCAA's NET framework embodies the second and third points in college basketball by prioritizing opponent adjusted efficiency over win-loss records when evaluating teams for selection and seeding NET rankings explained. In baseball, platoon analysis continues to show that batter-pitcher handedness and pitch mix can materially shift expected outcomes, sometimes outweighing recent team form the platoon advantage in 2024. Similarly, NFL analytics from recent seasons show how coverage shells and front structures interact with specific offensive concepts, reinforcing matchup-led game planning coverage shells, fronts and matchup outcomes.
These mechanisms do not make records useless. Instead, they show when records are informative and when they are a noisy aggregate that should be secondary to stylistic diagnostics.
A practical framework: a step by step matchup checklist
Step 1, identify core style vectors. Start by listing the measurable axes that define a team's identity in the sport you follow. For soccer that might be pressing actions, passes per defensive action and transition shot share. For basketball, note possession length, offensive rebounding rate and opponent adjusted efficiency. For baseball, capture platoon splits and pitch usage.
Step 2, find direct stylistic conflicts. Compare the two teams on each axis and flag where one side's strength structurally exploits the other's weakness. If a team is elite at fast transitions and the opponent concedes many transition shots, mark that as a high priority conflict. Where conflict exists, quantify it using league-relative percentiles or z-scores so you can compare across different scales.
Step 3, weight adjustments for context. Assign weights to each flagged conflict based on sport and available data. For example, in baseball a platoon split may carry greater weight in a single game because pitcher selection can directly create or remove that edge. In college basketball, opponent adjusted efficiency typically deserves heavier weight because it reflects strength of schedule and pace differences. The systematic review and efficiency frameworks provide a rationale for these choices team playing styles in football: a systematic review NET rankings explained.
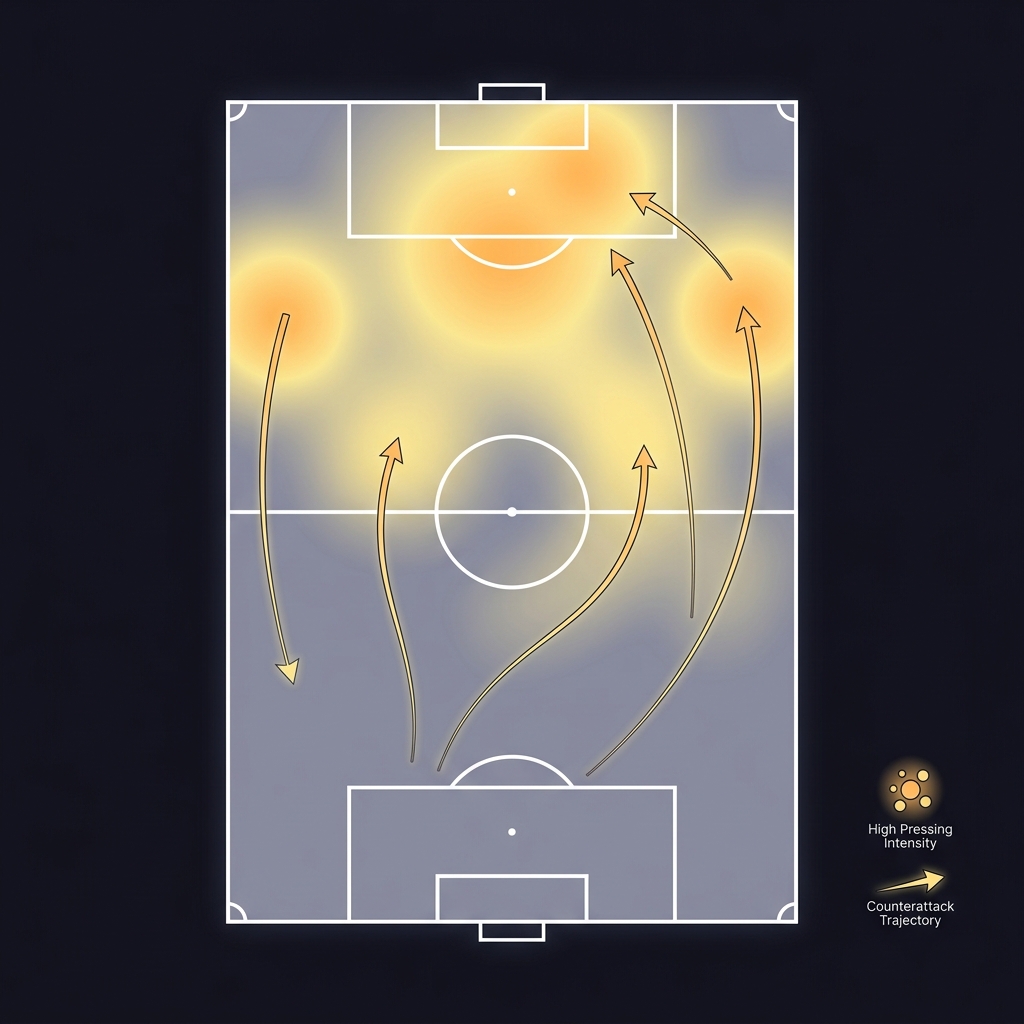
Practical tip: require a minimum sample threshold before trusting a style vector. For season-long diagnostics, prefer metrics aggregated across 10 or more matches. For new lineups or recent tactical shifts, downgrade weight and look for corroborating evidence in event or tracking data.
Sport specific matchup rules: soccer, college basketball, baseball and NFL
Soccer: pressing versus direct counters
High pressing teams aim to win the ball high and create chances quickly, while direct counter teams rely on speed and long passing into space. When these styles meet, the team that can execute its strength without exposing its own weakness usually has the edge. UEFA's competition analysis highlights multiple knockout matches where pressing teams were upset by direct transition opponents that exploited the space behind the press UEFA EURO 2024 Technical Report.

Practice-oriented forecasters can use controlled simulations and challenge formats to test how often stylistic edges repeat across similar matchups, which builds confidence without depending on raw records.
College basketball: possession and opponent adjusted efficiency
In college basketball the NET and opponent adjusted efficiency are designed to correct for pace and strength of schedule. That means two teams with similar records can rank very differently once you account for who they played and how possessions were converted. Using opponent adjusted efficiency as a core input helps identify cases where a team's record is inflated or depressed by schedule quirks NET rankings explained.
When betting or forecasting, treat NET-style measures as primary context and records as a secondary sanity check. Always cross-check with lineup availability and recent tactical changes.
Baseball: platoon and pitch mix
Baseball offers one of the clearest matchup mechanics. Handedness splits and pitch mix persistently influence outcomes at the plate and on the mound. League analyses show platoon effects remain a material edge, particularly when starting pitcher selection or bullpen composition magnifies those splits the platoon advantage in 2024.
A simple rule of thumb is to start with platoon-adjusted run expectancies for the projected lineup and pitcher, then adjust for park factors and recent form. When the platoon gap is large, it should override a superficial reading of team records for a short series or single game.
Evaluating team matchups: metrics and decision criteria
Which metrics move the needle depends on sport. In soccer, passes per defensive action and transition shot share often predict vulnerability to counters. In basketball, adjusted offensive and defensive efficiency, turnover rate and offensive rebounding percentage are useful. In baseball, platoon rates, swinging strike rate and first-pitch strike percentage are strong indicators of pitcher effectiveness.
Use comparative thresholds rather than absolute numbers. For example, a team in the top decile for pressing intensity facing an opponent in the bottom quartile for transition prevention signals a meaningful edge. Similarly, a platoon differential greater than one standard deviation suggests the advantage is substantive, not just noise. When applying thresholds, prefer league-relative measures that place teams in context rather than raw counts.
To combine metrics into a single decision signal, normalize each metric to a common scale, apply sport-specific weights, and compute a composite score. Avoid overfitting by limiting the number of inputs and testing the composite on past matchups. When your composite consistently predicts outcomes better than records, lock those weights into your pregame routine and document decisions for future review.
Tools and data sources to diagnose matchups pregame
Reliable public data sources include official competition technical reports, league statistical pages, and event data feeds that publish passes, shots and defensive actions. For many teams and leagues, those sources provide enough information to run a quick matchup check without proprietary tracking access.
Tracking data improves diagnostics by adding spatial and temporal context. It lets you quantify pressing traps, average passing lanes and defensive spacing, which are hard to see in event data alone. Where tracking is available, use it to validate hypotheses formed from event metrics.
fast pregame style scanner for matchups
use as a quick filter before deeper analysis
When time is limited, prioritize a short list: opponent adjusted efficiency, a pressing or transition indicator for the sport, and any clear platoon or matchup-specific metric. If those three agree, you have a robust signal to act on.
Common mistakes and blind spots when prioritizing matchups over records
Overfitting to recent games is a frequent error. A sudden tactical tweak or a one-off opponent weakness can create the illusion of a new style when the pattern is just noise. Always check whether a perceived style persists across multiple matches or is explained by unique context.
Other blind spots include roster changes, tactical switches by the coach, weather and unusual game contexts like extra time or neutral venues. These factors can nullify stylistic edges quickly, so build a short roster and context checklist into your pregame routine and downgrade style signals when uncertainty is high.
How to weigh roster changes, injuries and single game variance
The impact of a missing starter depends on role. Losing a central defender who organizes a high press can flip a pressing matchup more than losing a rotational forward. Conceptually, assign a multiplier to key player absences based on positional importance and involvement in the defining style vectors.
If lineup uncertainty or single game variance is large, discount style signals proportionally. For example, when a starting pitcher is questionable or a team is missing its primary transition threat, reduce the style-derived weight and rely more on broader efficiency metrics and records. Always check official availability reports and substitution tendencies before finalizing a call.
Examples: three case studies of matchups changing the expected outcome
Soccer case, inspired by international tournament analysis: a high pressing team entered a knockout tie with a superior win-loss record, but the opponent specialized in direct transition attacks and rapid vertical passing. The pressing team repeatedly left space behind the midfield, which the direct attackers exploited to score early and force a defensive reshuffle. UEFA technical analysis documents similar scenarios where tactical contrasts, not prior records, determined the match outcome UEFA EURO 2024 Technical Report.
Baseball case: during a short series a team with a better record faced a rotation where the opponent could start a left-hander against a lineup heavy with right-handed hitters. Platoon splits favored the pitcher and the matchup swung, with run expectancy models adjusted for handedness showing the underdog with a clear edge on that day the platoon advantage in 2024.
College basketball case: a squad with a modest record but strong opponent adjusted efficiency faced an opponent with a better record but weak schedule strength. The efficiency metrics, which control for pace and opponent quality, suggested the supposed underdog was the structurally stronger team; postgame analysis affirmed that efficiency explained the upset better than raw records NET rankings explained.
Building a consistent prediction workflow that leverages style edges
Start each day with a short pregame checklist. Gather opponent adjusted efficiency, a pressing or transition indicator, and any platoon or matchup-specific metric for games of interest. Score each matchup on a simple 0 to 10 scale per axis and compute a weighted sum using the sport-specific weights you have validated.
Record every decision and the rationale in a postgame log. Track outcomes against your composite score, then run monthly reviews to recalibrate weights and identify persistent biases. This habit protects you from hindsight bias and helps transform one-off insights into disciplined, repeatable advantage.
How skill based funded challenge platforms reward style aware forecasting
Funded evaluation models typically judge consistency and drawdown control across many decisions rather than rewarding single lucky wins. That structure aligns well with matchup focused forecasting because the approach emphasizes repeatable edges and disciplined weighting rather than chasing isolated upsets.
Using a challenge environment can help forecasters practice checklist discipline, document decisions and learn how often stylistic edges repeat in controlled simulations. Remember that platform rules, drawdown limits and eligibility criteria shape performance outcomes and consult platform terms before participating.
Conclusion: when to trust records and when to trust matchups
Records are useful as a general indicator of past success, especially over long samples. They become less reliable for single games where tactical fit, platoon effects and opponent adjusted efficiency can create meaningful deviations from team averages.
Final checklist: 1) Check opponent adjusted efficiency for contextual baseline, 2) identify and quantify any direct stylistic conflicts, 3) apply sport-specific weights and account for lineup uncertainty before finalizing a call. When used together, matchup diagnostics and conservative weighting produce more reliable single-game predictions than raw records alone team playing styles in football: a systematic review.
Playing styles are measurable patterns like pressing intensity or platoon splits that describe how a team operates, while records only summarize past outcomes without context.
Yes, the same principle applies across sports, though the relevant metrics and weights differ by sport and context.
Trust records more when long sample sizes and schedule balance are present; trust matchup diagnostics for single games or when clear stylistic conflicts exist.
References
- https://www.tandfonline.com/doi/full/10.1080/24748668.2024.xxxxx
- https://www.uefa.com/insideuefa/football-development/technical/technical-reports/
- https://www.fundedplays.com/challenges
- https://www.ncaa.com/news/basketball-men/article/2024-11-05/net-rankings-explained
- https://www.mlb.com/news/platoon-advantage-2024-analysis
- https://www.pff.com/news/nfl-coverage-schemes-matchup-outcomes-2025
- https://www.fundedplays.com
- https://www.fundedplays.com/blogs
- https://www.fundedplays.com/blogs/how-fundedplays-evaluations-work
- https://pmc.ncbi.nlm.nih.gov/articles/PMC12954490/
- https://www.nature.com/articles/s41598-022-19948-1
- https://dl.acm.org/doi/10.1145/2939672.2939764