

What we mean by a small sample in fighter statistics
Common metrics in combat sports - Why Small Samples Matter in Fighter Statistics
In combat sports analytics, many headline numbers are proportions: a fighter's win rate, strike accuracy, and takedown defense are all ratios of successes to attempts. These proportion-type metrics can look decisive after only a handful of fights or recorded attempts, but small counts produce wide uncertainty around the true underlying rate. For practical guidance on interval estimation for proportions and how uncertainty behaves at small sample sizes, consult the NIST e-Handbook of Statistical Methods.
Because these metrics are ratios, a single extra successful event or a single missed attempt can shift a percentage by a surprisingly large amount when the denominator is small. That variability is not a reporting error, it is a fundamental property of sampling, and it is why analysts should show margins of error or confidence intervals alongside point estimates for early records.
Compute a point proportion and a conceptual interval
Use Wilson or Agresti-Coull for real intervals
Why a single fight can sway early numbers
A fighter with only a few recorded fights can move dramatically in public rankings based on one result because each fight contributes a large fraction of the total observations. That means early leaderboards and quick takes are especially prone to over-interpretation unless they include statements about uncertainty and count thresholds. Statistical offices and guidance documents recommend clearly communicating margins of error for small-sample indicators to prevent misleading conclusions.
Practical reporting starts with naming the metric clearly and showing how many attempts are behind it: display both the point estimate and the interval, and avoid ranking fighters whose metrics come from minimal attempts.

Basic statistics: how uncertainty scales with sample size
The square-root law for sampling error
Uncertainty around a proportion shrinks with the square root of the sample size, so reducing the margin of error by half typically requires roughly four times as many observations. Put another way, small increases in fight counts rarely translate into big gains in precision; large, sustained accumulation of attempts is needed to narrow intervals materially. This scaling behavior is a foundational point in binomial proportion guidance and practical statistical handbooks.
For fighters and analysts, the square-root relationship explains why a stable estimate of a fine-grained metric like strike accuracy needs many more recorded strikes than a headline win-loss record needs fights. When you see a percentage derived from a modest number of attempts, treat the estimate as provisional rather than definitive.
Implication: big increases in fights needed to cut uncertainty materially
The practical implication is that leaderboards and short-term trend reports must not interpret small numerical differences as meaningful unless the underlying attempt counts are large enough to produce narrow intervals. That is especially true for metrics based on many repeated attempts per fight, such as landed strikes, because each percent change in such metrics can still be noisy at low counts. Guidance from statistical offices emphasizes publishing margins of error so users can calibrate their expectations.
When using these ideas in commentary, make it standard to note both the denominator and the interval, and to reserve firm comparisons for metrics with defensible precision.
Which interval methods work best for small samples
Why the simple Wald interval performs poorly
The simple Wald confidence interval, based on the classic normal approximation around a sample proportion, can perform poorly when counts are small or proportions are near the extremes; it may produce intervals that are too narrow or that extend beyond the logical range. For proportion metrics in fighter analytics, methodological guidance recommends alternatives that better maintain coverage and calibration in small-n situations; the NIST e-Handbook summarizes these practical considerations.
Because of the Wald interval's shortcomings, especially at small sample sizes, analysts should avoid defaulting to it for win rate, strike accuracy, or takedown defense reporting if the attempt counts or event frequencies are low.

Wilson and Agresti-Coull intervals: modern defaults
Wilson and Agresti-Coull intervals are recommended alternatives because they provide better calibration and more sensible behavior with small denominators, often yielding shorter intervals with nominal coverage properties that are closer to intended values; these methods are described in methodological literature on interval estimation for binomial proportions. See a detailed review in the literature on confidence intervals for a binomial proportion.
In practice, routine reporting for proportion metrics should present Wilson or Agresti-Coull intervals alongside point estimates for clarity and to reduce the chance that early fluctuations are mistaken for stable skill differences.
Exact versus approximate intervals: trade-offs for analysts
Clopper-Pearson (exact) intervals are conservative
Exact, Clopper-Pearson intervals are sometimes used because they guarantee coverage under the binomial model, but they are typically conservative and therefore wider than many approximate intervals at small sample sizes. That conservatism reduces the risk of false precision but can also make results appear less informative when counts are modest.
Analysts who favor conservative reporting may accept the wider Clopper-Pearson intervals, while those who need more compact but well calibrated intervals often adopt Wilson or Agresti-Coull methods instead.
When to prefer approximate intervals for tighter calibration
Where common use cases require both reasonable coverage and tighter intervals, Wilson-style intervals are often the practical choice. Literature comparing these approaches finds that approximate intervals balance coverage and interval length well for many applied settings in which small sample issues appear.
Decisions on which interval to use should weigh the cost of appearing overconfident against the value of sharper, better-calibrated intervals in a given editorial or analytical context.
Practical marker: caution note for readers and platform users
How to introduce uncertainty to audiences
A short, plain-language caution next to early statistics helps readers interpret them correctly: explain that small denominators can make percentages change quickly and that confidence intervals indicate how much precision we have in an estimate. Statistical guidance recommends visible notes or badges when estimates are based on few attempts rather than many.
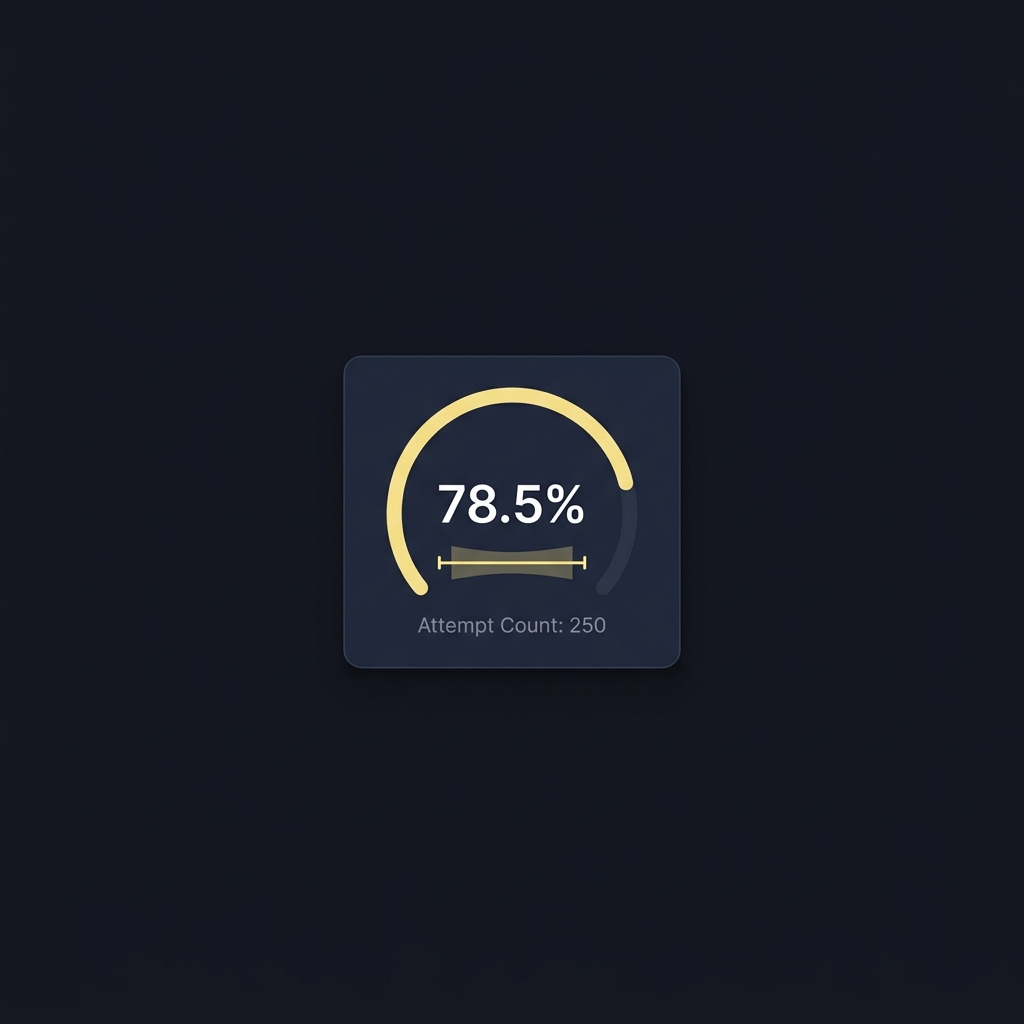
Dashboards can make this explicit by showing the attempt count, an interval, and a badge indicating low-confidence when appropriate; this reduces misinterpretation for casual readers and experienced analysts alike. See how platform documentation and evaluation guidance describe display choices in our post about how Funded Plays evaluations work.
See how FundedPlays explains challenge metrics and methodology
Consider this a prompt to check the attempt counts and confidence intervals before drawing firm conclusions from early statistics.
Short example paragraph for dashboards and leaderboards
An example label for a leaderboard entry might state the point estimate, the confidence interval, and the number of attempts, with an inline note that the interval is wide when counts are low; that straightforward language helps avoid overstating certainty and follows recent guidance on communicating uncertainty.
Make the caution text reusable and place it near any metric where the denominator falls below the documented threshold for reliable interpretation.
Comparing two fighters: why point differences can mislead
When a difference is real versus noise
Comparing point estimates between two fighters without considering uncertainty inflates the risk of false positives, especially when one or both fighters have few observations. Methodological handbooks advise using confidence intervals or formal tests rather than relying on raw percentage differences to decide whether an observed gap is likely to reflect a real performance difference.
When numbers are close and intervals overlap substantially, treat the difference as inconclusive and seek additional data or complementary metrics before making a decisive call.
Early fighter statistics should influence judgments only cautiously; treat small-sample estimates as provisional, look for confidence intervals and attempt counts, and avoid firm rankings until evidence accumulates.
Use confidence intervals or formal tests instead of point comparisons
Confidence intervals give a simple visual and statistical check: if intervals overlap a lot, the apparent leader is likely not significantly different from the challenger. For more formal assessment, analysts can use appropriate proportion comparison tests, but the first step for most dashboards is to show intervals to avoid misleading direct comparisons.
Reporters and editors should adopt a policy to avoid definitive language about superiority unless uncertainty measures support that conclusion and the counts behind the metrics are adequate.
How to communicate uncertainty: labels, intervals, and narrative
Best practices from statistical offices and guidance documents
Official guidance from national statistical offices and analyst guidance emphasizes publishing margins of error or confidence intervals alongside estimates, and using plain language to explain what those intervals mean in practice. Clear captions and short explanatory tooltips help non-technical users understand that early figures may change as more data accrues.
Follow established guidance by showing the interval, the denominator, and a short sentence about the reliability of the estimate rather than leaving readers to infer stability from a single number.
Design choices for leaderboards and short-form content
Simple display options include error bars for numeric charts, shaded ribbons for time-series uncertainty, and badges that flag low-count estimates. For short-form content, a brief parenthetical note like, "based on X attempts; interval shown" helps reduce overconfidence in early stats.
Use neutral language that avoids definitive labels when counts are low and prefer comparative wording such as "suggests" rather than "proves" until evidence accrues.
Decision criteria: rules of thumb and thresholds
Conservative thresholds versus rapid signals
Analysts and platform teams often adopt conservative, defensible rules of thumb that delay final leaderboard decisions until attempt counts provide reasonable precision. The exact threshold depends on the metric, but the principle is consistent: prioritize stability and transparent documentation over quick rankings that change frequently.
Document your chosen thresholds and update them when evidence or context suggests a different trade-off between speed and reliability. Our blog is a place to record platform-level documentation and rationale.
How to set minimum-attempt counts for different metrics
Different metrics require different amounts of data: rates based on many repeated actions per fight, like strike accuracy, benefit from pooling many more attempts than an infrequent event such as a finish. When setting internal thresholds, be explicit about the rationale and note that these are judgment calls rather than immutable rules.
When thresholds are in place, consider using soft rules that allow expert override when contextual evidence justifies it, while recording the reason for transparency.
Techniques to stabilize sparse estimates: shrinkage and pooling (conceptual)
What shrinkage and Bayesian pooling do conceptually
Shrinkage and hierarchical, or Bayesian, pooling are conceptual techniques that borrow strength across fighters or groups to reduce variance in sparse estimates. Instead of treating each fighter entirely independently, these approaches pull noisy estimates toward a group-level mean, which often produces more stable rankings in the short term without fabricating data.
While these methods reduce volatility, they introduce modeling choices and potential bias if the pooled group is not appropriate, so practitioners should document assumptions and test sensitivity to different pooling choices.
When pooling across fighters or populations helps and the trade-offs
Pooling can be especially useful when many fighters share comparable contexts and the goal is to produce more robust operational metrics for dashboards. The trade-off is that pooling can mask true heterogeneity if fighters differ systematically in ways the model does not capture.
Practical use of shrinkage should be accompanied by clear notes describing the grouping strategy and by checks that pooled estimates behave sensibly as more data arrives.
Common mistakes and pitfalls when using fighter statistics
Over-reliance on early leaderboards
One frequent error is presenting early leaderboards as if they are definitive. Without intervals or count indicators, rankings built on small numbers mislead readers and bettors about the strength and stability of those rankings. Avoid making strong claims about superiority based on sparse data.
Instead, mark early entries clearly and provide mechanisms for readers to see how rankings shift as more observations accumulate.
Misinterpreting percentages without context
Percentages stripped of their denominators are easy to misread. A 60 percent strike success figure means very different things if it is based on a handful of recorded strikes than if it is based on hundreds. Report the underlying counts and the interval, and avoid absolute language when referring to percentages from low counts.
Corrective actions include using alternative displays, adding explanatory tooltips, and educating readers on basic sampling logic to reduce misinterpretation.
Practical scenarios: how to read common cases (qualitative examples)
A new prospect with five fights
A newcomer with only a handful of recorded fights can have strikingly high or low proportions simply because each outcome is a large share of the total. Interpret such early figures as provisional and seek more context, such as opponent quality and event conditions, before treating the record as a stable signal.
When possible, present newcomer stats with prominent notes about low counts and suggest readers check back after a larger sample accumulates.
A veteran with many fights but low activity metrics
A veteran who has many fights may still have noisy micro-level metrics if the sample is gathered under varied conditions or if the particular metric counts are limited. In such cases, combine the point estimate with an interval and consider additional context like opponent level and fight circumstances before comparing to less experienced fighters.
In both scenarios, emphasize that the same numerical point estimate can have very different credibility depending on how many attempts underpin it.
How to visualize uncertainty and design cautious leaderboards
Visual techniques: error bars, ribbons and badges
Error bars and shaded ribbons are simple visual encodings that communicate the width of uncertainty around a point estimate. Badges or colored indicators can flag entries with low counts and point readers to explanatory tooltips that define what low-confidence means for a particular metric.
Always include the denominator near the visual so users can judge how much data supports the displayed number, and prefer sorting rules that respect minimum counts to avoid misleading top lists.
UX patterns for flagging low-confidence estimates
Default sorting can favor records that meet minimum-attempt thresholds, or platforms can choose not to rank until a threshold is met. Tooltips that explain intervals in plain language reduce confusion and help readers appreciate why early estimates move a lot.
Design patterns that combine visual cues with clear microcopy perform best for mixed audiences of casual fans and data-focused users.
A short checklist for analysts, writers and platform builders
Before publishing a stat
Check the denominator and compute an appropriate confidence interval; avoid the simple Wald interval for small counts and prefer Wilson or Agresti-Coull methods when reporting proportions. Document the choice of interval and the rationale in editorial or platform notes.
Flag low-count estimates visibly and avoid definitive language about superiority until counts and intervals support that assertion.
Dashboard checklist
Include the point estimate, interval, denominator, and a low-confidence badge when appropriate. Record thresholds and decisions in the platform documentation so users and auditors can understand how metrics were produced.
Link to methodological guidance and explain terms in plain language for non-technical users. See a practical discussion of methods and sample size considerations in this review.
Conclusion and further reading
Key takeaways
Small samples create wide uncertainty, and analysts should treat early fighter statistics cautiously. Use Wilson or Agresti-Coull intervals rather than the Wald interval for proportion metrics, publish margins of error, and design leaderboards and dashboards that flag low-confidence estimates to avoid misleading users.
These practical steps follow contemporary methodological guidance and help readers and platform users make better-informed judgments about fighter performance.
Where to learn more
Readers who want to dive deeper should consult methodological handbooks and official guidance on measuring and communicating uncertainty; those documents explain interval methods and communication principles in more detail for practitioners.
Adopt a culture of transparency and documentation when publishing fighter metrics so that readers can see both the estimate and the uncertainty that surrounds it.
An example label for a leaderboard entry might state the point estimate, the confidence interval, and the number of attempts, with an inline note that the interval is wide when counts are low; that straightforward language helps avoid overstating certainty and follows recent guidance on communicating uncertainty.

Trust grows as the number of attempts behind the percentage increases; look for published confidence intervals and the denominator before treating a stat as reliable.
For small to moderate sample sizes, prefer Wilson or Agresti-Coull intervals rather than the simple Wald interval.
Pooling can reduce variance by borrowing strength across similar fighters but introduces modeling choices and potential bias, so document assumptions and check sensitivity.
References
- https://www.itl.nist.gov/div898/handbook/prc/section2/prc241.htm
- https://pmc.ncbi.nlm.nih.gov/articles/PMC4792103/
- https://repository.upenn.edu/bitstreams/567df766-cd47-4022-9d25-68b0da53e52d/download
- https://www.fundedplays.com
- https://www.fundedplays.com/blogs
- https://www.fundedplays.com/blogs/how-fundedplays-evaluations-work
- https://www.fundedplays.com/challenges