
Why simulation matters for strategy development
What simulation is trying to replicate
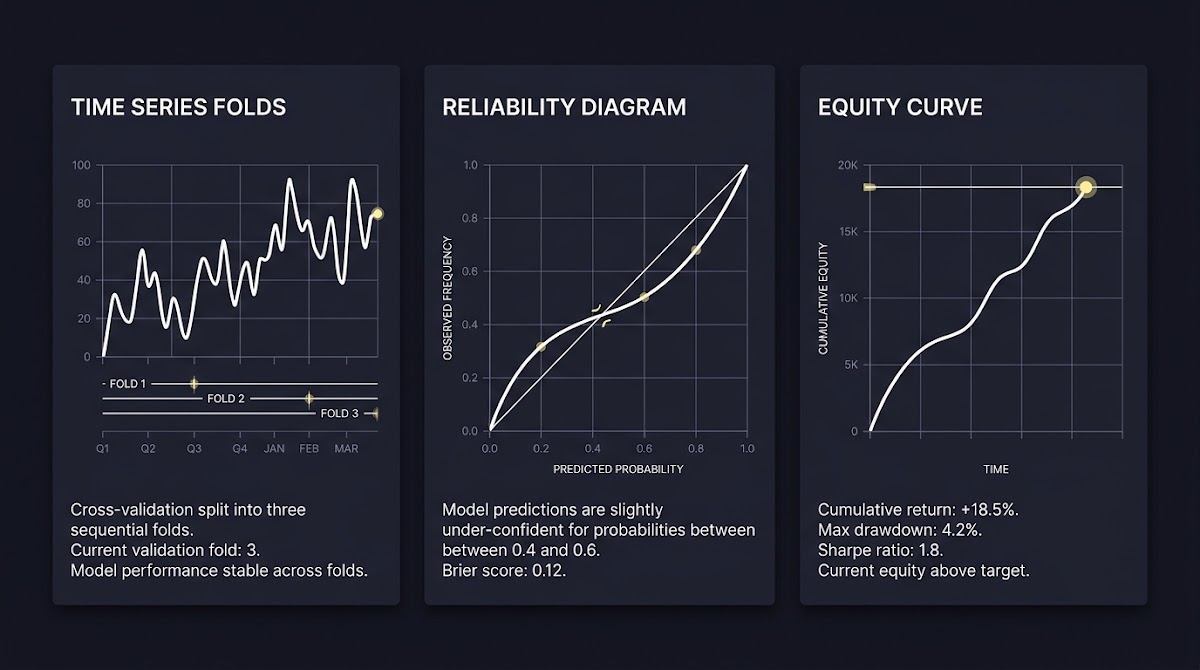
Simulation creates a controlled environment to test strategies without real-money exposure, letting you exercise hypothesis, data flows and decision logic before risking capital. In practice, a simulation mirrors the live signal pipeline, order or stake sizing rules and the timing of events so you can find hidden problems in the strategy design early on.
When set up correctly, simulation helps reveal structural problems such as data leakage, unrealistic fills or unrealistic rebalancing assumptions that can otherwise make a model look better on paper than it would in deployment. Modern evaluation toolchains make it easier to reproduce splits, metrics and reports so those checks become part of routine development rather than an afterthought scikit learn documentation
Start a first simulation test with a checklist for reproducible evaluations
Set up a first simulation test now and download a short checklist to validate your data splits and scoring choices
That said, simulation cannot guarantee future results. A well executed simulated edge is only a strong signal when the evaluation is free of look ahead bias and selection mistakes; otherwise simulated performance can be misleading.
High level benefits for strategy work
Simulation accelerates learning: you can iterate faster, test counterfactuals and compare alternative staking rules without the emotional and financial cost of live runs. It also enforces discipline by requiring predefined objectives such as drawdown limits and calibration targets before you call a strategy ready.
Used responsibly, sports trading simulation helps teams move from intuition to measurable, repeatable outcomes by separating model behaviour from market noise and human reactions.
What simulated sports trading is and how it differs from wagering
Virtual bankrolls and challenge formats
Simulated sports trading typically uses virtual bankrolls and structured challenge objectives to evaluate forecasting skill. Participants place virtual stakes or submit probability forecasts against defined evaluation windows and controlled drawdown rules, which lets an evaluator measure consistency over time instead of single-event wins or losses.
In a challenge format, progressive risk management and scaling rules are often enforced so users must demonstrate disciplined growth rather than one off lucky results. This mirrors how funded account models let performers scale after meeting specific performance criteria.

Skill based evaluation vs staking on odds
Unlike ordinary wagering, the emphasis is on predictive accuracy, calibration and disciplined bankroll management rather than exploiting short term odds mispricing. The evaluation is usually rule based: meet a calibration threshold, avoid breaching drawdown limits and preserve a target equity curve shape over a predefined period.
That focus makes simulated trading useful for analysts who want to demonstrate consistent forecasting ability without exposing real capital during the development and validation phases.
A rigorous evaluation framework: partitioning, scoring and bias controls
Overview of the three core pillars
A trustworthy simulation pipeline rests on three pillars: time aware partitioning, proper scoring for probabilistic outputs and statistical controls for selection bias. Each pillar addresses a distinct failure mode that can otherwise create a false sense of edge.
Time aware partitioning prevents look ahead bias in sequential data, proper scoring rewards calibrated probability estimates and bias controls protect against overfitting from multiple searches. These elements work together to produce results you can reasonably expect to approximate live performance under similar conditions Time series cross validation (Forecasting: Principles and Practice)
You cannot know for certain, but by using time aware splits, proper probabilistic scoring and bias correction tests, then validating with pilots and continuous monitoring, you can reduce avoidable mistakes and increase confidence before allocating real capital.
Which pillar causes the most trouble for your projects and why
Why all three are necessary together
Using only one pillar is risky. For example, clean partitions with random shuffles but no correction for multiple testing can still produce a large number of spurious winners. Similarly, excellent in-sample calibration measures mean little if the model was tuned on the same data repeatedly without any holdout procedure.
Adopting partitioning, scoring and bias controls as a combined standard reduces error rates and helps you prioritize changes that genuinely improve out of sample behaviour.
Data partitioning and walk forward cross validation explained
Why time series cross validation avoids look ahead bias
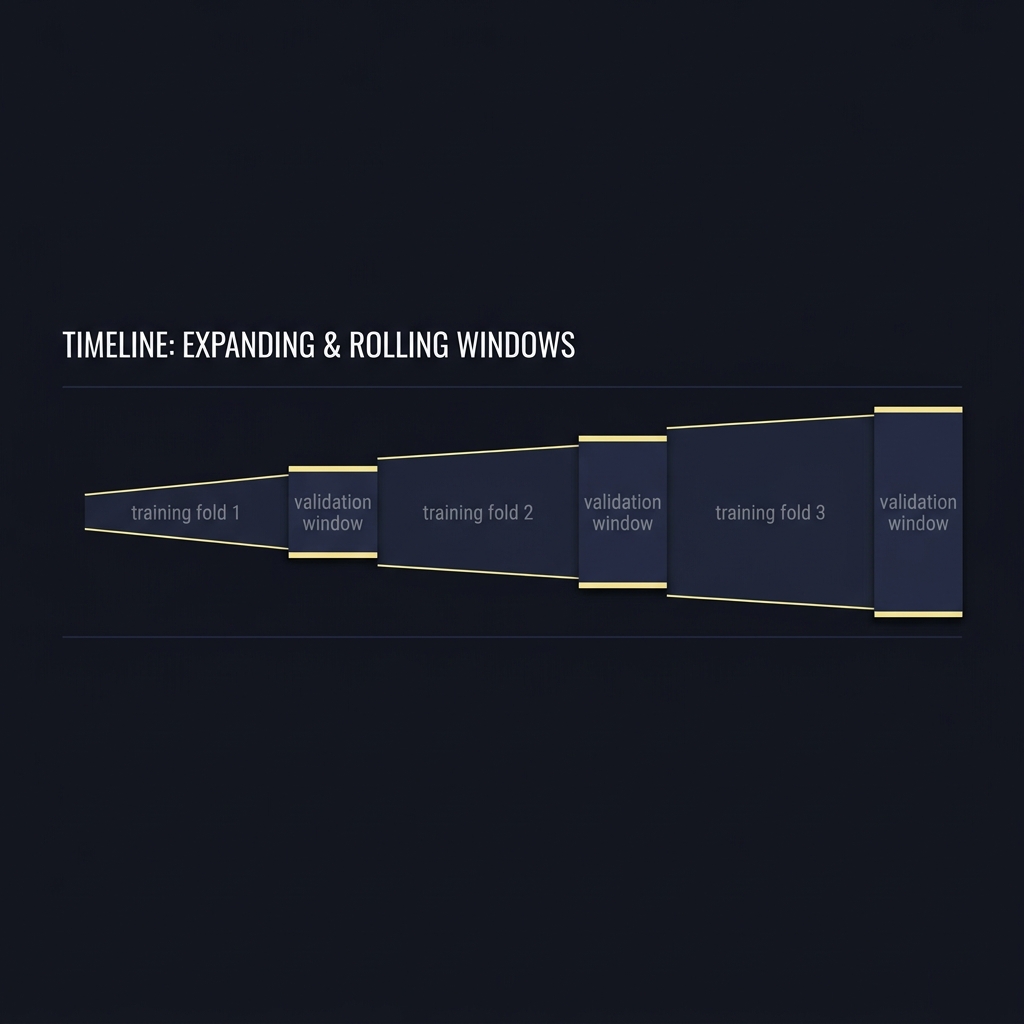
Random shuffles and standard cross validation assume independent observations; sports sequences are ordered in time, so using those techniques risks look ahead bias when the model can implicitly see future patterns. Walk forward cross validation simulates deployment by training on past windows and validating on subsequent unseen windows, which better approximates the live forecasting scenario Time series cross validation (Forecasting: Principles and Practice). For a practical walk-forward walkthrough see Understanding Walk-Forward Validation.
Two practical variants are common: expanding window, which grows the training set each step, and rolling window, which keeps the training window size fixed while moving it forward. Each has trade offs: expanding windows capture more history while rolling windows emphasize recent patterns.
Automated walk forward split parameters for sequential sports data
Use with fixed random seeds for reproducible runs
Practical variants: expanding window and rolling window
Choose expanding window when the process is relatively stable over time and you value the extra training history. Pick rolling window when you expect regime shifts and want to test sensitivity to more recent information. For both, pick fold sizes and step sizes that approximate your intended deployment cadence so validation performance reflects real timing constraints.
Heuristics: set validation horizons to match your live holding period and choose step sizes that create a manageable number of folds for statistical comparisons. Record the exact split dates so experiments are auditable and repeatable scikit learn documentation
Evaluating probabilistic forecasts: log loss and Brier score
Why accuracy alone is not enough
Point accuracy or percent wins tells you how often a predicted outcome occurred, but it does not reward honest probability estimates. A model that predicts 60 percent for many events should be correct close to 60 percent of the time; scoring rules measure that alignment between predicted probability and observed frequency.
Strictly proper scoring rules encourage truthful probability reporting because they give the best expected score to honest probabilities rather than to extreme or hedged forecasts Strictly Proper Scoring Rules, Prediction, and Estimation

How scoring rules reward calibration
Log loss penalizes confident incorrect forecasts heavily, making it sensitive to extreme errors, while the Brier score treats squared probability errors and is easier to decompose into calibration and resolution components. Reporting both gives a rounded view: log loss for sensitivity to overconfidence, Brier for interpretability and calibration checks.
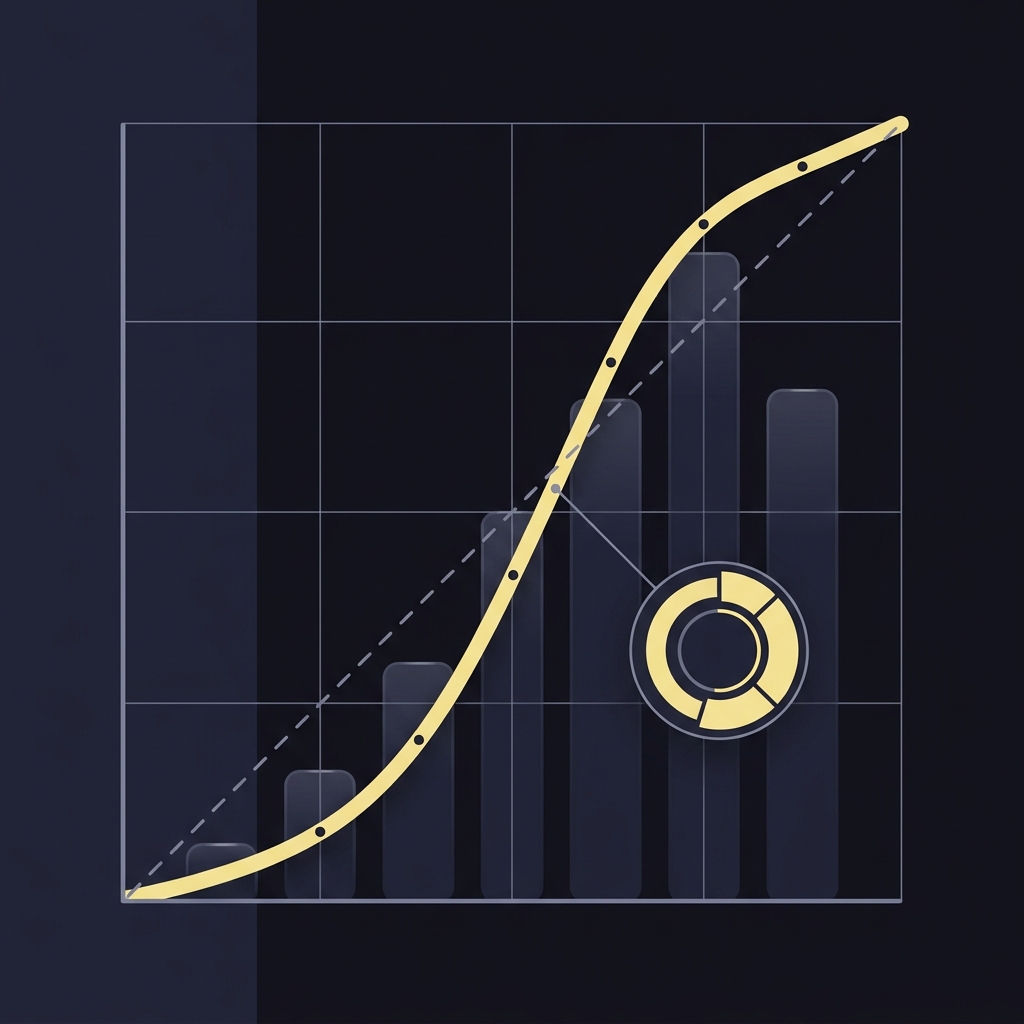
In practice, include reliability diagrams or calibration tables alongside aggregate scores to see where probabilities systematically deviate from observed frequencies and to inform recalibration steps in your development loop scikit learn documentation
Detecting and correcting backtest overfitting and selection bias
How multiple testing inflates apparent edge
When many model variants, parameter sets or filters are tested, the probability of finding at least one seemingly strong result by chance increases. This multiple testing problem, often called data snooping, can make backtests look far better than any strategy will perform live.
White's Reality Check is a formal method to adjust p values under data snooping, helping you separate chance findings from plausible edges when many candidate rules are assessed A Reality Check for Data Snooping
White's Reality Check as a guard
Apply Reality Check or similar resampling tests when your selection process searched a large hypothesis space. If the Reality Check fails to reject the null, treat the apparent improvement as likely a sampling artifact and tighten the experiment design before proceeding.
Practical signals of overfitting include large performance gaps between best and median variants, extreme sensitivity to small parameter changes and unusually high performance on only a few time windows.
Adjusting performance metrics: the Deflated Sharpe Ratio
Why raw Sharpe can mislead in simulated strategies
The Sharpe ratio assumes normally distributed returns and a single tested strategy. In simulation you often test many variants and encounter non normal return distributions; naive Sharpe therefore can overstate the significance of an observed risk adjusted edge.
The Deflated Sharpe Ratio corrects for selection bias and non normality to provide a more conservative estimate of true skill, which helps temper decisions about moving a strategy to live trials The Deflated Sharpe Ratio: Correcting for Selection Bias, Backtest Overfitting, and Non-Normality
How the Deflated Sharpe Ratio mitigates selection bias
Compute the Deflated Sharpe after your search phase as a sanity check. If the deflated value is substantially lower than the raw Sharpe, investigate whether the top result depends on an unusually lucky period or extreme parameter tuning. Use it to decide whether more robust cross validation or narrower hypothesis tests are required.
Interpret the deflated figure conservatively: it is a diagnostic, not a guarantee, but a large gap between raw and deflated Sharpe is a reliable warning sign.
Comparing forecasting strategies with proper statistical tests
Why mean differences are not enough
Small average score differences between strategies can be driven by luck, especially in noisy sports outcomes. Comparing means without a statistical framework risks adopting a worse model by chance.
Tests that compare predictive accuracy provide a formal way to ask whether observed differences are likely to persist out of sample, rather than being artifacts of a particular split or period.
Using Diebold Mariano and similar predictive accuracy tests
The Diebold Mariano test measures differences in forecast accuracy while accounting for serial correlation in errors, making it appropriate for sequential sports predictions. Use it to compare competing probability forecasts on the same holdout windows and report p values and effect sizes, not just which model scored higher on average Comparing Predictive Accuracy
Pay attention to sample size and test power: small holdouts limit the test's ability to detect moderate but practical differences, so plan folds with enough data to support conclusive comparisons.
Building a reproducible evaluation pipeline and available tools
Key pipeline components: data, splits, metrics, reports
A minimal reproducible pipeline includes ingestion and timestamp validation, preprocessing with preserved label alignment, time aware splits, scoring with proper rules and final bias checks and logging. Save split indices and random seeds so you can rebuild any run exactly.
Modern ML toolchains provide utilities to standardize these steps, and adopting versioned datasets and experiment tracking reduces ambiguity when results are shared or audited scikit learn documentation
Tooling examples for reproducible runs
Use standard libraries for splitting and scoring, keep notebooks small and scriptable, and record package versions. Automation and experiment tracking let you rerun entire evaluations and compare runs side by side without manual reconstruction. See a cross-validation tutorial at nixtla cross-validation docs.
Combine automated pipelines with human review to catch label or timestamp errors that automation might overlook.
Common mistakes and how to avoid them
Data related errors
Typical data mistakes include timestamp misalignment, label leakage and inconsistent updating of feature pipelines. Any of these can introduce look ahead bias or produce overly optimistic results.
Quick checks: confirm event timestamps precede any features derived from the same event, re run the pipeline on a held out period and compare feature distributions, and keep clear documentation of any imputation or forward filling logic Time series cross validation (Forecasting: Principles and Practice)
Evaluation and interpretation traps
Avoid cherry picking best splits, ignoring calibration, and neglecting multiple testing. If a model looks great only on a subset, treat that as a hypothesis rather than evidence until validated across independent windows.
Remediations include predefining search ranges, limiting the number of candidate variants, and using bias correction tests after selection to quantify the likely inflation.
Designing experiments: controls, baselines and robustness checks
Pre registration and hypothesis control
Pre register your hypotheses and primary performance metrics before heavy tuning. That reduces the effective search space and makes downstream p values and confidence statements more meaningful.
Include a simple baseline model as a control and compare new variants to that baseline using the same out of sample splits and scoring rules.
Robustness checks to run after initial success
After a promising simulation result, run out of sample holdouts, perturbation tests such as small noise injections and ensemble stability checks to ensure performance is not brittle. Document every check and its outcome for auditability.
Good documentation includes parameter grids tested, exact split dates, and the rationale for any ad hoc filters applied during exploration A Reality Check for Data Snooping
Practical scenario examples and how to run them in simulation
Example 1: probability calibration exercise
Steps: produce probabilistic forecasts for a season, compute Brier score and log loss on walk forward folds, and plot reliability diagrams for each fold to identify systematic miscalibration. Use recalibration techniques such as isotonic regression or Platt scaling on the training side and validate recalibrated outputs on the holdout folds.
Pass criteria might include consistent reduction in Brier score across folds and improved alignment on reliability diagrams without sacrificing discrimination.
Example 2: testing a staking rule with walk forward CV
Set a staking rule, for example fractional Kelly or fixed percent, and test it using walk forward splits where stake sizing is recalculated each training fold and then applied to the following validation fold. Log equity curves, drawdowns and compute deflated Sharpe after the full search.
Run sensitivity analysis on step sizes and horizon lengths to see whether the staking rule's apparent advantage persists under small timing changes backtesting guide
Moving from simulation to live or funded deployment: final checks
Operational checks and monitoring
Before live or funded deployment, verify latency, data completeness and robust logging for delayed or missing events. Ensure that the live ingest pipeline matches the simulation timestamping and that fallbacks are in place for partial data. Learn more about our evaluation process here.
Keep continuous monitoring for calibration drift and return metrics and set alerting for breaches of predefined thresholds so you can react quickly if performance deviates from expectations scikit learn documentation
Small scale pilot testing
Run a small scale pilot using conservative stakes or a limited allocation to confirm assumptions under live conditions. Treat this pilot as an additional validation fold and be prepared to roll back if monitoring shows calibration or risk metrics deteriorating.
Define explicit scaling rules and drawdown protections so growth follows disciplined milestones, not emotion driven increases.
Conclusion: using simulation to build disciplined, testable strategies
Summary of practical next steps
Adopt the three pillars: time aware splits, proper scoring for probabilities and bias corrections. Build reproducible pipelines, pre register hypotheses and treat initial successes as hypotheses to be stress tested with robustness checks.
Iterate with disciplined experiment records and share methodologies transparently so results are verifiable and decisions are based on evidence rather than isolated backtest peaks.
Where to learn more and apply these methods
Start with small, auditable experiments and gradually increase the scope of tests as you accumulate evidence across independent time windows. Use our blog for practical examples and experiment notes.
Use standard libraries and experiment tracking to keep your work reproducible and reviewable. Visit Funded Plays for practical challenges you can use to test workflows.
Simulation is a powerful tool to develop disciplined strategy workflows, but it requires rigor and humility: the goal is to reduce avoidable mistakes and increase the chance that an observed edge generalizes to real conditions.
Walk forward cross validation respects time order by training on past windows and validating on future windows, which avoids look ahead bias common in standard shuffled cross validation.
Use log loss when you need sensitivity to confident errors and Brier score when you want decomposable calibration insight; reporting both gives a fuller picture.
The Deflated Sharpe Ratio adjusts raw Sharpe estimates for multiple testing and non normal returns to give a more conservative performance assessment.
References
- https://scikit-learn.org/1.5/modules/model_evaluation.html
- https://otexts.com/fpp3/tscv.html
- https://www.tandfonline.com/doi/abs/10.1198/016214506000001437
- https://www.fundedplays.com/challenges
- https://onlinelibrary.wiley.com/doi/abs/10.1111/1468-0262.00183
- https://papers.ssrn.com/sol3/papers.cfm?abstract_id=2460551
- https://www.tandfonline.com/doi/abs/10.1080/07350015.1995.10524599
- https://medium.com/@ahmedfahad04/understanding-walk-forward-validation-in-time-series-analysis-a-practical-guide-ea3814015abf
- https://nixtla.io/docs/forecasting/evaluation/cross_validation
- https://machinelearningmastery.com/backtest-machine-learning-models-time-series-forecasting/
- https://www.fundedplays.com
- https://www.fundedplays.com/blogs
- https://www.fundedplays.com/blogs/how-fundedplays-evaluations-work