
Why Prop Limits and Liquidity Matter, definition and context
Prop trading limits are the internal boundaries a desk sets to control exposure: gross and net exposure caps, concentration thresholds and drawdown limits that trigger escalation or forced reductions. These controls aim to limit loss magnitude and enforce disciplined sizing on every trade.
Internal limits control how large a desk's exposures can grow, while market liquidity determines how easily those exposures can be adjusted. When limits force reductions during low-liquidity periods, execution costs and tail risk rise; coordinated pre-trade checks and stress-tested dynamic limits reduce that risk.
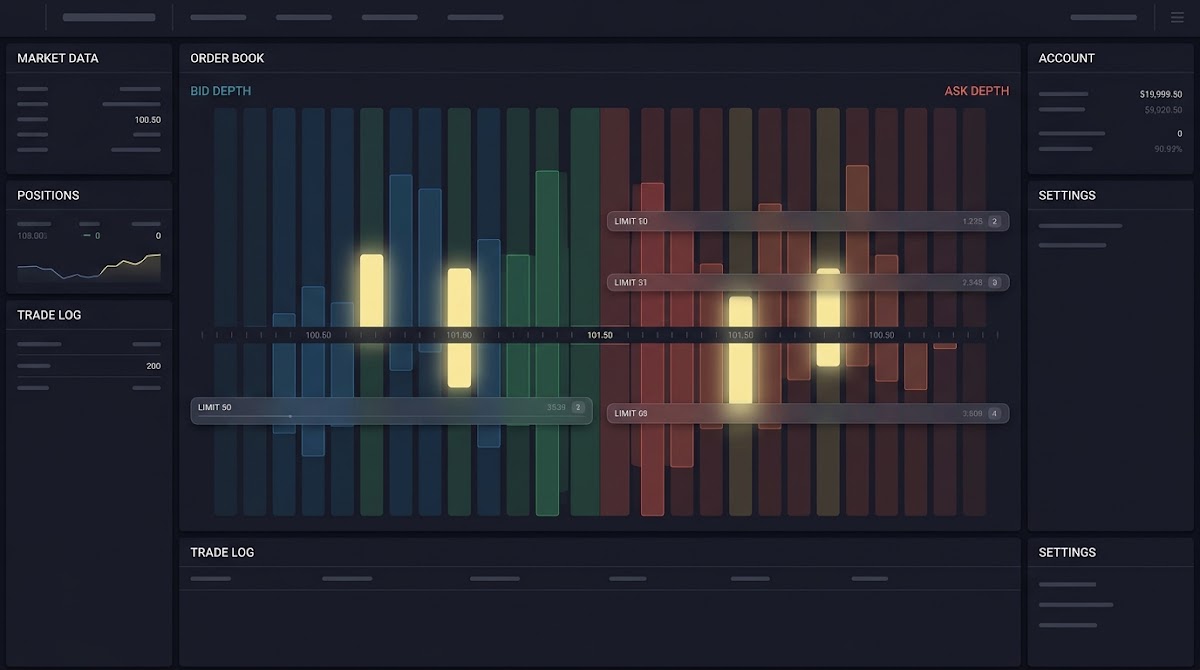
Liquidity is how easily a position can be traded without moving price, usually described by spread, market depth and turnover. Market microstructure factors like order book depth and visible liquidity determine how execution costs accumulate as orders interact with the book. (see Investopedia)
When limits bind and liquidity is thin, the causal chain is straightforward: forced reductions or large orders absorb available depth, widen effective spreads and increase implementation shortfall, especially during stress periods described in supervisory reviews and market studies IOSCO guidance. (see related evidence in a published study on execution costs)
What we mean by prop limits
Internal prop limits include gross and net exposure ceilings that cap total risk, concentration limits that prevent outsized bets in a single instrument, and drawdown triggers that halt or reduce trading after adverse performance. Each type of limit targets a particular failure mode: concentration limits reduce idiosyncratic shocks, while drawdown limits preserve capital and force review.
What we mean by liquidity and microstructure
Liquidity metrics traders watch are the bid-ask spread, the depth at each price level, and turnover or average daily volume. These metrics combine to determine the share of the market an order represents and the likely price impact when that share grows.
How the two interact in practice
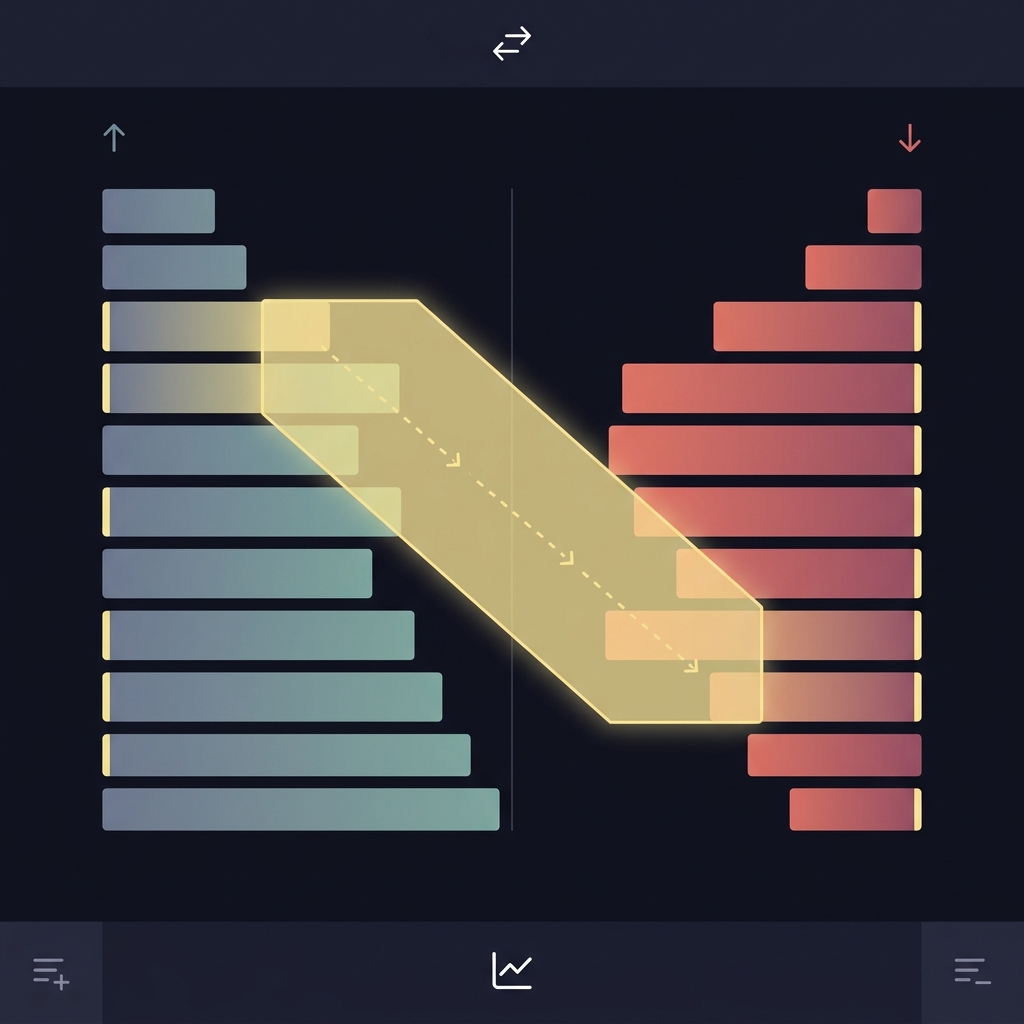
Limits and liquidity interact because a binding limit may force a desk to reduce exposures into prevailing market liquidity, rather than in calm windows. Episodic liquidity droughts documented in recent market reviews show that core markets can quickly see depth evaporate, which magnifies the market impact for larger orders BIS review.
How position sizing, concentration and market liquidity interact
Sizing an order relative to available depth is the primary determinant of market impact. A practical way to think about sizing is share of available depth at the top few price levels and share of average daily volume (ADV); both limit how much of the market would be consumed by a single execution.
Traders often use percentage-of-ADV rules to cap intraday participation. When a trade exceeds a sensible share of ADV, it can move price, widen realized spreads and produce slippage that erodes expected returns. Recent reviews highlight episodes where sudden depth reductions amplified impact for larger orders ESMA report.
Sizing relative to available depth
Practical size limits compare intended order size to visible depth across venues and to a fraction of ADV. Where visible depth is low, even moderate-sized positions can become large relative to what the market will bear without significant impact.
Concentration limits and forced de-risking

Concentration limits prevent a desk holding too much of a single instrument. But when a regulatory or internal threshold is approached, the required de-risking can force sales into thinner windows, creating self-inflicted slippage and increasing tail risk.
Execution cost shows up in widened spreads, price improvement forgone and market impact. If a large order sweeps multiple price levels, realized implementation shortfall can be substantial compared with a small, well-routed slice of the same position.
Regulatory position limits and tangible effects on execution
Regulatory frameworks such as the CFTC Part 150 position limits set external caps on exposures in specified derivatives contracts. These rules are designed to reduce systemic risk but have operational consequences for desks that manage sizeable positions CFTC Part 150 overview.
When a desk approaches or breaches a regulatory limit, compliance requires rapid reduction. In thin markets, that speed can translate directly into higher slippage and adverse price movements, because selling pressure meets reduced depth.

External limits therefore change behavior: desks may elect to stagger positions, avoid deadline concentrations, or keep separate internal buffers to reduce the probability of a regulatory-driven rush to exit the market. (see Funded Plays evaluations)
Overview of CFTC Part 150 and which contracts it covers
CFTC position limits apply to certain derivatives where concentration could affect market functioning. For desks trading those contracts, the limits are a binding operational constraint that must be integrated into sizing and monitoring processes.
How regulatory limits change desk behavior
Desks often respond by tightening internal limits relative to regulatory caps, by using hedging strategies that reduce reportable positions, or by diversifying exposures across correlated instruments, mindful of hidden cross-instrument concentration.
When regulation forces rapid reductions and slippage risk
Rapid liquidation to comply with a regulatory call can coincide with low liquidity windows, producing outsized implementation shortfall and sometimes persistent price dislocations that increase realized losses relative to mark-to-market expectations.
Internal risk limits, governance and monitoring
Internal limits are the frontline control: gross exposure caps, net delta limits, concentration thresholds and drawdown triggers each serve to contain different risk channels. The choice and calibration of these limits need clear ownership and documentation.
Good governance defines who owns each limit, how often limits are reviewed, and what escalation steps are triggered when breaches or near-breaches occur. The Comptroller's Handbook provides practical governance structure guidance that remains relevant for desk-level controls OCC handbook. (see Funded Plays)
Types of internal limits (gross, net, concentration, drawdown)
Gross limits cap aggregate nominal exposure, net limits control directional risk, concentration limits prevent outsized bets in single instruments, and drawdown limits stop further trading when performance deteriorates to a predefined threshold.
Governance and escalation protocols
Escalation protocols should specify automated alerts, decision owners and timelines for action. Quick, pre-agreed steps reduce hesitation when liquidity deteriorates and a prompt response is required.
Real-time monitoring and reporting cadence
Real-time dashboards for exposure, intraday mark changes and market liquidity indicators let desks see when a limit is approaching. Regular reviews ensure limits remain calibrated to current activity and liquidity regimes.
Measuring liquidity and pre-trade checks
Key pre-trade metrics include the prevailing spread, depth at the top N levels, share of ADV, and short-term volatility. Combining these gives a practical sense of whether the market can absorb the intended size without significant price movement.
As conceptual guidance, many desks treat a single-instrument slice under a few percent of ADV as a conservative starting point and widen or narrow that band depending on spread and depth. Pre-trade checks reduce the likelihood of costly market impact by making sizing and routing decisions explicit CFA Institute guide.
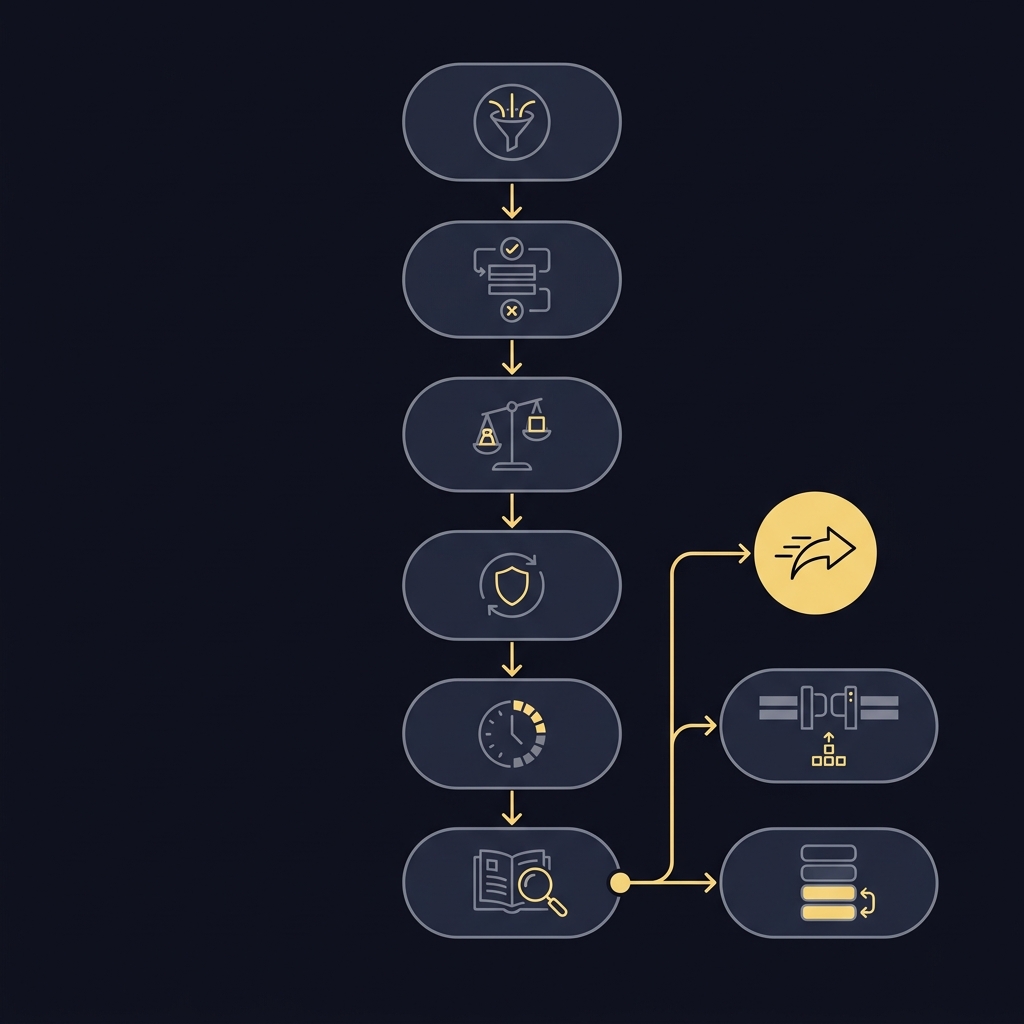
Key pre-trade metrics: spread, depth, share of ADV, volatility
Spread measures immediate friction, depth shows how much volume sits at or near quoted prices, share of ADV estimates market footprint, and volatility indicates how quickly prices can move. Using these together creates a more robust pre-trade signal.
How to set size caps per venue
Size caps reflect visible liquidity per venue and consider hidden liquidity pools. A conservative cap uses the smallest of venue depth estimates to avoid surprising impact if one venue withdraws liquidity during execution.
Simple pre-trade decision rules
Decision rules can be binary or graded: a go/no-go threshold, or a scaled rule where size is reduced stepwise as spreads widen or depth falls. Such rules convert observed market conditions into immediate execution choices.
Execution tactics to reduce slippage
Order slicing spreads a large order into smaller child orders executed over time to limit market impact. Time-weighted schedules like TWAP smooth execution across a window, while limit orders can capture favorable prices at the cost of fill risk.
Algorithmic, liquidity-seeking tactics may access hidden pockets of liquidity but also rely on routing and venue connectivity; they can help in normal conditions but perform unpredictably during sudden liquidity withdrawals CFA Institute guide. (see related HFT and liquidity research study)
Order slicing and time-weighted schedules
Slicing reduces single-period footprint and can be tuned to intraday volume patterns. Time-weighted approaches are simple to implement and reduce variance in execution price, but they do not adapt to short-term liquidity pulses unless combined with liquidity signals.
Limit orders versus market orders
Limit orders control price but risk non-execution; market orders guarantee execution but accept the prevailing spread plus potential depth-driven moves. When spreads widen, shifting toward limit placement reduces realized impact but may miss fills.
Liquidity-seeking algorithms and their limits
Liquidity-seeking algorithms attempt to find passive or hidden liquidity, but their routing logic depends on live venue behavior and can be less effective when many participants withdraw simultaneously.
Stress testing liquidity and calibrating dynamic limits
Scenario design should include sudden spread widening, venue withdrawal and correlated volatility spikes. These scenarios simulate how available depth and execution costs change under stress, informing tighter drawdown and exposure thresholds IOSCO guidance.
Stress test outputs quantify implementation shortfall under defined shocks and help set dynamic limits that tighten as liquidity degrades. Results should feed governance decisions about temporary caps and escalation triggers.
Simple liquidity stress test that estimates implementation shortfall
Use as a comparative estimate
Use stress-test results to create dynamic limits: for example, reduce allowed position size by X percent when modeled shortfall exceeds a tolerance. Document the rule and the governance steps that authorize exceptions.
Scenario design for liquidity droughts
Include both idiosyncratic and market-wide stress scenarios. A venue withdrawal might concentrate flow on remaining venues; correlated volatility spikes can widen spreads across instruments simultaneously, producing compounding effects.
Stress test outputs to inform limit setting
Translate stress outputs into actionable limit changes: smaller position caps, tighter drawdown triggers, or increased margin buffers during stressed regimes. The goal is predictable responses rather than ad-hoc reactions.
How to adapt limits across volatility regimes
Calibrate limits to regime signals: in low-volatility periods, permit wider position sizes within defined bands; in high-volatility or low-liquidity regimes, tighten caps and increase monitoring frequency.
Order routing, venue selection and fragmentation effects
Market fragmentation means depth and spreads vary across venues. Choosing where to send orders affects execution quality: some venues display more visible depth, others host hidden liquidity or offer different fee structures.
Routing strategies should balance visible depth, likely hidden liquidity, fees and latency. Periodic reviews of venue performance help detect fragmentation effects and preserve execution quality over time ESMA report.
How venue choice affects depth and spreads
Some venues consistently show tighter spreads and deeper books for particular instruments; routing to those venues when possible lowers expected impact. However, over-reliance on a single venue creates concentration risk if that venue withdraws liquidity.
Routing strategies and regulatory considerations
Routing must align with best-execution expectations. Desk rules should document how routing choices are made and how execution quality is measured across venues to comply with oversight requirements.
Monitoring venue liquidity over time
Track fills, slippage and venue response during stress tests. Regular venue TCA helps identify when a previously reliable venue has become less effective, informing routing adjustments.
Common mistakes and operational pitfalls
A frequent error is relying solely on average liquidity metrics in calm markets; averages hide episodic droughts that cause the most severe impact when limits bind and sales become urgent BIS review.
Another pitfall is ignoring cross-instrument concentration: correlated instruments can produce hidden exposure when correlation rises, increasing execution risk across a portfolio rather than in one line.
Relying on nominal liquidity in calm markets
Nominal liquidity can be misleading; build rules that reduce position size against observed short-term depth and volatility rather than long-run averages alone.
Ignoring concentration effects across correlated instruments
Measure concentration not only by single-instrument exposure but also by correlated exposures that could be stressed together, increasing the effective market footprint.
Poor escalation or stale governance
Stale limits and unclear escalation pathways cause hesitation during stress. Well-rehearsed protocols with clear owners reduce execution delay and help avoid ad-hoc large market hits.
Practical scenarios and illustrative examples
Scenario 1: A desk needs to sell a large futures position during a sudden depth reduction. Pre-trade checks show spread tripling and depth halving; a full-market sell would sweep several price levels, creating substantial implementation shortfall. Breaking the order into smaller slices and prioritizing limit placements reduces immediate impact but requires time and monitoring.
Scenario 2: A desk is forced to reduce positions because a regulatory threshold was breached. The timing coincides with a thin liquidity window and venue fragmentation. Rapid liquidation across venues increases slippage and may move correlated instruments, demonstrating why buffers and earlier de-risking are preferable to last-minute compliance selling CFTC Part 150 overview.
A large futures order in a thinning market
For large futures, monitor both exchange order book depth and nearby spreads. If modelled shortfall exceeds tolerance, consider staged exits or hedging with correlated liquid instruments to reduce directional pressure.
Forced reduction after a regulatory threshold is hit
Regulatory-forced exits often compress time to act. Maintain pre-approved playbooks that specify venue sequencing, limit order thresholds and communication steps to execute under pressure.
How pre-trade checks change the execution plan
Pre-trade results can shift a plan from a market sweep to a limit-slicing approach, or from immediate execution to a staged window aligned with expected liquidity recovery, reducing expected slippage.
A simple framework for setting dynamic limits
Principles: preserve capital, limit concentration, and adapt limits to observed liquidity regimes. Start by defining base limits, then overlay dynamic rules tied to liquidity indicators and stress-test outputs.
Map stress scenarios to specific quantitative adjustments: if modeled implementation shortfall rises above a trigger, automatically reduce allowed position size by a stated percentage and escalate to limit owners for review OCC handbook.
Principles for limit calibration
Keep limits simple and transparent: use a small set of linked metrics, document the rationale, and assign clear ownership for adjustments and exceptions.
How to link limits to liquidity measures
Connect position caps and drawdown thresholds to observed spreads, depth and volatility. For example, reduce caps as spread multiples of normal widen beyond a threshold or when depth drops below a fractional cut of average levels.
Escalation and exception handling
Document who can approve exceptions, under what conditions and for how long. Temporary exceptions should require a written rationale and post-event review to preserve accountability.
Decision criteria and trade-offs in limit setting
Decisions balance execution cost against opportunity. Accept larger trades when expected alpha justifies potential slippage, when time horizon allows patient execution, or when stress tests indicate recoverable market depth.
Too-tight limits can leave alpha on the table; too-loose limits expose the desk to outsized tail risk. Use both quantitative signals and trader judgment, and require governance sign-off for systematic deviations IOSCO guidance.
Balancing execution cost versus opportunity
Compare expected implementation shortfall to the expected edge from a trade. If the edge substantially exceeds modeled cost, execution is more warranted; otherwise, delay or scale down.
When to accept slippage vs when to defer
Accept slippage when alpha is persistent and larger than modeled shortfall, or when delaying execution risks missing a one-time event. Defer when market conditions promise to improve or when stress tests show extreme degradation.
Quantitative and qualitative inputs to decisions
Combine modeled shortfall, volatility forecasts and trader experience. Documentation of the decision path helps later TCA and governance reviews.
Implementation checklist and continuous monitoring
Pre-trade checklist items: check spread, depth at top N levels, share of ADV, short-term volatility and correlation with nearby instruments. Decide on size, order type and venue routing based on these checks.
Post-trade, run transaction-cost analysis (TCA) comparing realized fills to benchmarks and feed results back into limit calibration and routing choices. Regular reviews align execution practice with governance and regulatory expectations CFA Institute guide. (further reading on checklists available at our blogs)
Pre-trade checklist items
Keep a short checklist for each sizeable trade so the trader confirms market signals and documents the chosen execution plan before sending orders.
Post-trade TCA and feedback loops
Measure realized slippage, identify drivers and adjust limits or routing accordingly. Continuous improvement depends on honest post-trade assessment and prompt adjustments.
Periodic review and regulatory alignment
Set a cadence for limit reviews, venue performance checks and alignment with regulatory guidance. Periodic exercises ensure rules remain effective as markets and strategies evolve.
Conclusion and key takeaways
Liquidity and limits jointly determine execution cost and tail risk. Well-calibrated internal limits and disciplined pre-trade checks reduce the probability that forced actions coincide with thin markets and high slippage BIS review.
Three immediate actions: implement clear pre-trade checks, add scenario-based stress tests to limit calibration, and document escalation paths for quick, accountable responses. These steps support disciplined execution and better-managed liquidity risk.
Remember that no system eliminates risk. The aim is to make outcomes more predictable through governance, measurement and rehearsed protocols rather than to promise risk-free performance.
Internal prop limits reduce execution risk by capping exposure, limiting concentration and triggering pre-defined escalation steps before losses compound, which helps avoid rushed sales into thin markets.
Key pre-trade checks are spread, visible depth at top levels, share of ADV and short-term volatility; combining these into a go/no-go or scaled entry rule helps limit market impact.
Stress testing cannot eliminate liquidity-driven losses but it helps quantify potential implementation shortfall and supports setting dynamic limits that reduce the chance of severe outcomes.
References
- https://www.iosco.org/library/pubdocs/pdf/IOSCOPD780.pdf
- https://www.bis.org/publ/qtrpdf/r_qt2409.htm
- https://www.esma.europa.eu/press-news/esma-news/esma-publishes-trends-risks-and-vulnerabilities-report-2024-2
- https://www.cftc.gov/LawRegulation/DoddFrankAct/Rulemakings/PositionLimits/index.htm
- https://www.fundedplays.com/challenges
- https://www.occ.treas.gov/publications-and-resources/publications/comptrollers-handbook/files/trading-activities/pub-ch-trading-activities.pdf
- https://www.cfainstitute.org/-/media/documents/book/rf-lit-review/2024/best-execution-transaction-cost-analysis.pdf
- https://www.sciencedirect.com/science/article/abs/pii/S0304405X20302373
- https://www.investopedia.com/terms/p/proprietarytrading.asp
- https://papers.ssrn.com/sol3/Delivery.cfm/SSRN_ID2182582_code1939020.pdf?abstractid=2182582
- https://www.fundedplays.com/blogs/how-fundedplays-evaluations-work
- https://www.fundedplays.com
- https://www.fundedplays.com/blogs