
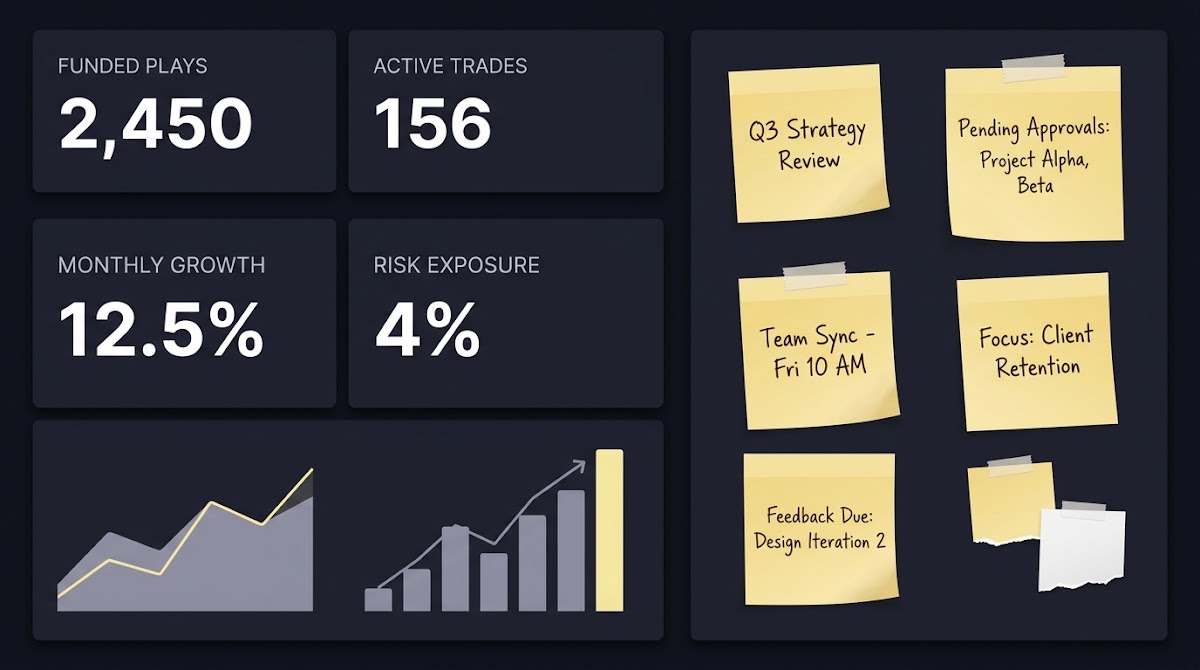
What we mean by notes and why they belong next to numbers, Why Notes Matter as Much as Numbers
Definitions: notes, qualitative observations, and metadata
Start with a working definition. In analytics and forecasting workflows, notes are structured and unstructured narrative records that document assumptions, process observations, contextual details, and metadata tied to a data point or analysis step. Notes include short freeform text, timestamped comments, coded tags, and compact entry fields that capture who made an observation, why it mattered, and what uncertainty or caveats accompanied the metric.
Notes sit beside quantitative measures as complementary information. A conversion rate or effect size answers a what question. Notes answer the why, when, and how questions that give that number meaning in context. Good notes identify implementation constraints, data gaps, and the judgement calls made during cleaning or model selection.
How notes capture mechanisms, edge cases, and assumptions
Notes capture mechanisms that numbers alone cannot show, such as why a KPI shifted during a rollout because a downstream tracking tag failed, or why a variance reflected a single outlier game rather than a trend. Recording assumptions and decision logic makes those mechanisms visible to later reviewers.
Edge cases are another common example. A single match cancellation, an atypical lineup, or a database migration can move a metric for reasons unrelated to the underlying behavior the KPI intends to measure. When those events are recorded in notes with simple metadata, analysts can separate signal from noise more reliably.
Major guideline frameworks recommend pairing qualitative records with quantitative evidence to improve transparency and applicability, and this recommendation helps justify the extra step of keeping notes in a reproducible way, as explained in existing guidance from international manuals Cochrane Handbook.
Why notes matter as much as numbers in decision making
Transparency and audit trails
Notes create an audit trail that traces how an interpretation arose from source observations, transformations, and analytic choices. When a review committee or stakeholder questions an outcome, a structured note can show which assumptions were used, who made the call, and when it was implemented. That traceability reduces misunderstandings and speeds reconciliation between teams.
Guideline consensus across sectors says that integrating qualitative and quantitative evidence materially improves transparency and the applicability of recommendations in real world settings, which is why documenting assumptions is central to evidence to decision frameworks NICE guideline manual.
Reducing bias and improving reproducibility
Without notes, the analytic path is often invisible. Small, undocumented choices in cleaning, exclusion criteria, or hand corrections can bias effect estimates. Recording those choices and the reasons for them helps others reproduce the analysis and test whether different choices would change conclusions.
Well documented research notes, including assumptions and analytic decisions, support an auditable interpretation process and reduce bias, as emphasized in recent systematic review guidance Cochrane Handbook.
Get the sample notes and joint display template
Download the sample template sheet later in this article to start standardizing notes alongside key metrics.
What major guideline frameworks recommend
Cochrane, NICE, WHO and JBI: common themes
Several major manuals converge on the same practical point: qualitative evidence and structured notes should be considered alongside numeric results when forming recommendations, because narrative records capture stakeholder perspectives, contextual constraints, and analytic assumptions that affect applicability. This common theme is explicitly present in multiple guidance documents WHO handbook.
Each source frames the integration slightly differently, but the shared elements are documentation of assumptions, transparent analytic reporting, and using qualitative records to qualify or contextualize effect estimates.
Specific techniques named in manuals
Manuals list concrete techniques to operationalize integration. Typical recommendations include joint displays to present qualitative and quantitative results together, triangulation to check consistency across sources, and convergence coding to classify whether findings align or diverge. These methods are repeatable and help teams show why a decision was made.
The JBI mixed methods guidance and mixed methods chapters in systematic review handbooks provide stepwise descriptions for building these integrated products and for documenting analytic decisions so others can follow the logic JBI Manual.

The workflow is intentionally simple: capture, code, synthesize. First, capture structured notes alongside KPIs. Second, code and tag notes so they map to defined themes, assumptions, or components of your analytic model. Third, synthesize by creating joint displays or convergence tables that show how narrative observations align with numeric results.
A practical integration framework: joint displays, triangulation, and coding
Overview of a three-step integration workflow
Each step has low friction options. Capture can be a shared spreadsheet or a note repository. Coding can use a short controlled vocabulary. Synthesis can be a table that places notes in rows and KPIs in columns, with short cells that explain alignment or discordance.
How to build a joint display with examples
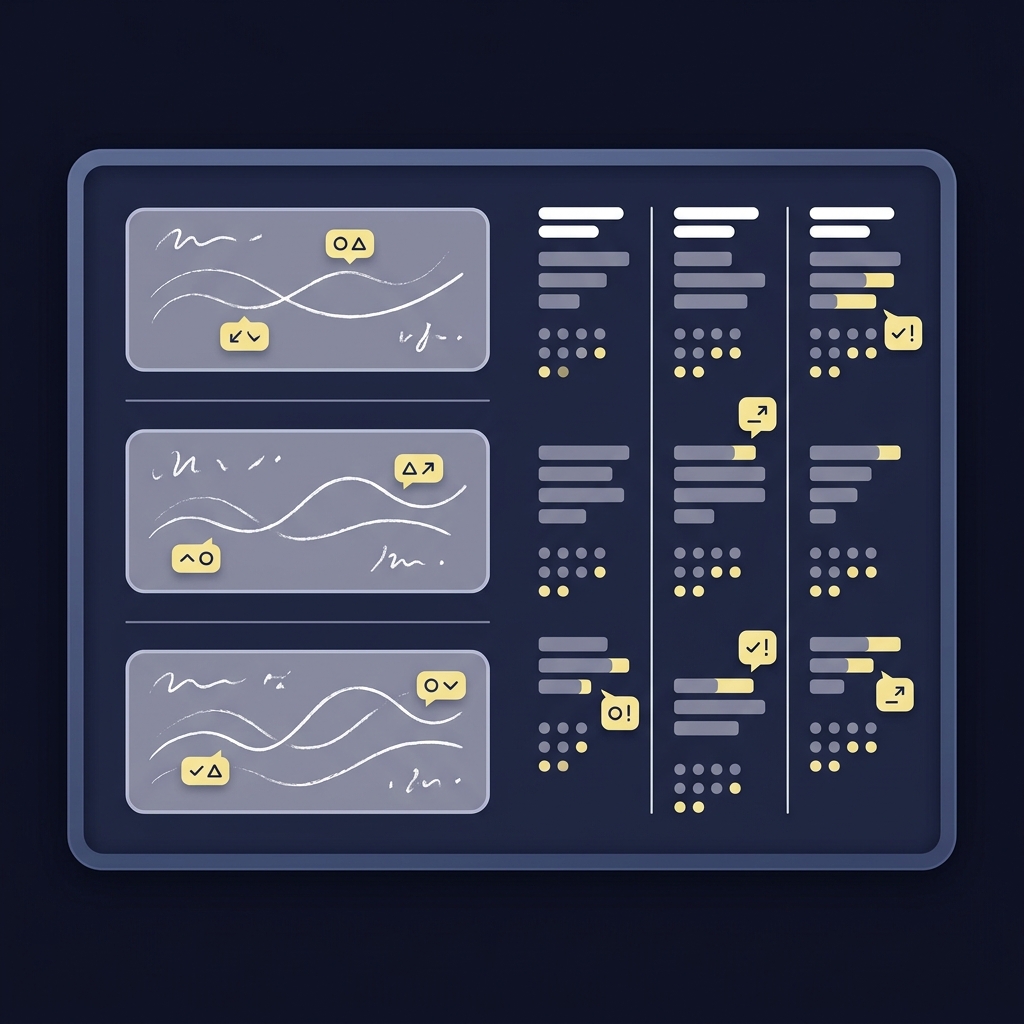
A simple joint display has three columns: observation context, linked KPI or metric, and implication for interpretation. For example, a row might read: "data lag from source system," linked to "weekly active users," with implication "defer trend call until two more weeks of data." That layout makes it explicit when a note should temper an interpretation. See a demonstration of a joint display here.
Triangulation is a practical check inside this workflow. When a note claims a local operational issue caused a change, triangulate against other sources such as logs, stakeholder reports, or independent measures. If all sources align, upgrade confidence. If sources diverge, mark the entry as discordant and flag for follow up. This approach follows the logic recommended for integrating diverse evidence sources NN/g triangulation guide and is discussed in methodological literature such as the joint display literature in academic examples.
shared note repository template to link notes to KPIs
Keep entries under two short sentences
How to capture structured notes in analytics and forecasting workflows
Tooling and templates: what to record
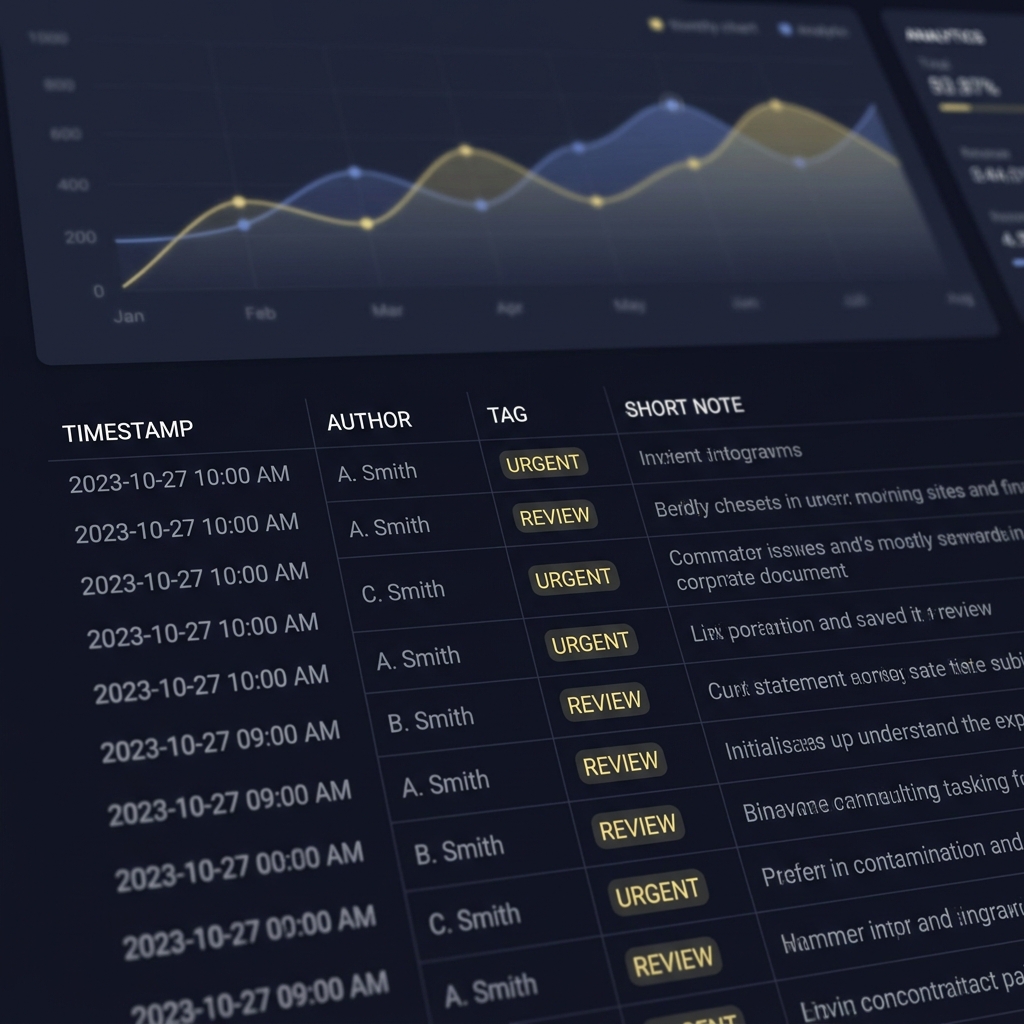
Make recording minimal and consistent. Essential fields include timestamp, author, data source or table, short assumption text, confidence level, and a short action item or suggested next step. That set keeps the burden low while preserving provenance and usefulness for future reviewers.
When a note links to a forecast or a KPI, include the experiment or model version, and a pointer to the raw data or dashboard slice. These small links let an auditor reconstruct the state of play without hunting through an analyst's personal notebook, which supports reproducibility and clear ownership GOV.UK Service Manual.
Tagging, timestamps, and linking notes to data points
Use tags to group notes by theme, such as "data-quality," "implementation-change," or "stakeholder-feedback." Timestamps should be iso-like and include timezone info when cross-region work is common. Always include the data source name and, where practical, the exact query or dashboard link that produced the metric.
These practices let teams filter notes by signal type and quickly assemble joint displays that compare metrics and narrative records across the same time windows. Simple governance rules about where notes live and who can edit them reduce fragmentation and help maintain provenance.
Decision criteria: when notes should change your interpretation
Evaluating credibility and relevance of notes
Not every note should change a decision. Apply clear credibility criteria before elevating a narrative observation. Important criteria include provenance, proximity to the data collection moment, corroboration from independent sources, and the specificity of the observation. Notes that are vague, anonymous, or temporally distant should carry less weight.
Guideline manuals describe how to weigh qualitative evidence when drafting recommendations, and they advise explicit recording of these credibility judgements so the rationale is visible to stakeholders NICE manual.
Weighing discordant evidence
When notes and metrics disagree, follow an explicit escalation path. First, attempt rapid triangulation. Second, if discordance persists, document possible biases such as confounding, selective recording, or measurement error. Third, adjust the interpretation with a graded confidence statement rather than overturning the metric without explanation.

Use conditional language in your recommendations. For example, say "Recommend action X if subsequent monitoring confirms the note's claim" rather than making absolute changes based on a single narrative entry. That cautious path aligns with evidence to decision thinking and preserves both rigor and responsiveness.
Common mistakes and blind spots when teams ignore notes
Examples of bias and missed edge cases
Teams that omit notes commonly see three patterns. First, unrecorded hand edits create silent bias in reported metrics. Second, siloed notebooks mean only one person remembers the rationale behind a change. Third, missing provenance makes it impossible to tell whether a change was caused by a genuine behavioral shift or by an operational artefact.
These blind spots lead to incorrect downstream decisions, such as prematurely scaling a tactic or misattributing causation. A brief, mandatory minimum note field can prevent many such errors by forcing analysts to capture the reason behind key adjustments Cochrane Handbook.
How poor note practices break reproducibility
Reproducibility suffers when the analytic path is not recorded. Without a clear lineage from raw data to final KPI, reviewers cannot rerun the same steps or test alternative assumptions. That lack of traceability undermines confidence in findings and makes audits costly and time consuming.
Quick fixes include minimal templates, mandatory provenance fields, and scheduled synthesis checkpoints where teams reconcile notes into joint displays and close open questions.
Practical examples and scenarios
A forecasting team example: how notes changed a call
Imagine a forecasting team tracking a weekly engagement metric. A sudden drop appears and initial model output shows a large negative effect. An analyst records a note that the drop coincides with a tagging issue on a content feed, including the timestamp and the affected content id range. The team triangulates with server logs and a stakeholder report, confirming the tag failure, and they update the forecast with a corrected data window. The integrated display shows the numeric drop and the note side by side, making the decision to withhold an urgent intervention transparent to others.
That sequence, capture through synthesis, mirrors recommended mixed methods procedures for resolving divergent signals and documenting decisions for reviewers JBI guidance.
Capture structured notes alongside KPIs, code them to map to themes, and synthesize with joint displays and triangulation so decisions are transparent, reproducible, and informed by context.
A guideline development example: integrating stakeholder input
In a guideline setting, stakeholders submit qualitative comments that suggest an intervention is impractical in a certain region. The guideline team records those comments as notes, codes them by theme such as "feasibility" and "resource constraint," and adds those coded notes to a joint display with pooled effect estimates. As a result, the recommendation text includes an explicit rationale that the effect estimate is conditional on local implementation capacity, and the audit record shows how stakeholder input affected the final phrasing.
This approach follows evidence to decision logic that uses qualitative evidence to qualify applicability and to explain conditional recommendations Cochrane Handbook.
Team checklist and minimal templates to start today
Quick template for structured notes
Use a compact template you can copy into a shared repository. Required fields: timestamp, author, data source, short assumption, confidence (low, medium, high), action item. Example filled entry: timestamp 2026-06-01T09:12Z, author J. Smith, data source page_views_v2, assumption "tagging delay explains dip", confidence medium, action "re-run metric after patch and flag for review."
Keep each entry brief and use tags to allow rapid filtering. This minimal approach reduces friction and increases adoption among analysts while preserving the key provenance fields needed for later audits GOV.UK Service Manual.
Synthesis checklist for weekly reviews
For weekly synthesis meetings, use a short checklist: 1) Pull notes linked to KPIs for the period. 2) Triangulate entries flagged as high impact. 3) Populate joint display rows for any discordant items. 4) Record decisions and assign follow up. 5) Archive the display with version metadata so reviewers can trace the logic later.
Governance matters. Assign ownership for notes storage, set periodic audits of note quality, and include a lightweight change log so edits remain visible. These governance steps keep the system trustworthy and reduce the chance that notes become fragmented or stale.
Conclusion and next steps for teams
Three immediate actions
First, adopt a minimal template for notes and require the essential provenance fields on every key observation.
Second, schedule a weekly synthesis checkpoint where notes are converted into joint displays for decision makers. See related posts on our blog.
Third, apply simple credibility criteria when allowing narrative evidence to modify an interpretation.
Longer term cultural changes
Long term, normalize the habit of pairing notes with numbers so documenting assumptions becomes part of the analytic rhythm. Train new team members on the coding vocabulary and make joint displays a regular deliverable in reports. Manuals from major guideline developers support this approach, and consistent practice will improve transparency, reduce bias, and make decisions easier to defend Cochrane Handbook. For examples and company resources see Funded Plays.
Keep notes brief but specific: timestamp, author, data source, short assumption, confidence level, and an action item are usually sufficient.
A note should change interpretation when it meets credibility criteria like provenance, corroboration, and proximity to the data collection moment.
Begin with a minimal template and mandatory provenance fields, then schedule brief synthesis meetings to convert notes into joint displays.
References
- https://training.cochrane.org/handbook/current/chapter-21
- https://www.nice.org.uk/process/pmg20
- https://www.who.int/our-work/science-division/evidence/who-handbook-for-guideline-development
- https://jbi-global-wiki.refined.site/space/MANUAL/3283910685/Chapter+8%3A+Mixed+methods+synthesis
- https://pmc.ncbi.nlm.nih.gov/articles/PMC10365872/
- https://www.nngroup.com/articles/triangulation/
- https://journals.sagepub.com/doi/10.1177/16094069221104564
- https://www.gov.uk/service-manual/user-research/analysis-and-synthesis
- https://www.fundedplays.com/challenges
- https://www.fundedplays.com/blogs/how-fundedplays-evaluations-work
- https://www.fundedplays.com/blogs
- https://www.fundedplays.com
- https://oasis.library.unlv.edu/cgi/viewcontent.cgi?article=1017&context=red_fac_articles