
Quick summary: the short answer and what this article covers
What readers will learn
Very fast live price moves are usually the result of several interacting forces: displayed liquidity that can disappear, surprise information hitting the tape, automated trading strategies that change behavior, and microsecond latency effects that create fleeting quotes.
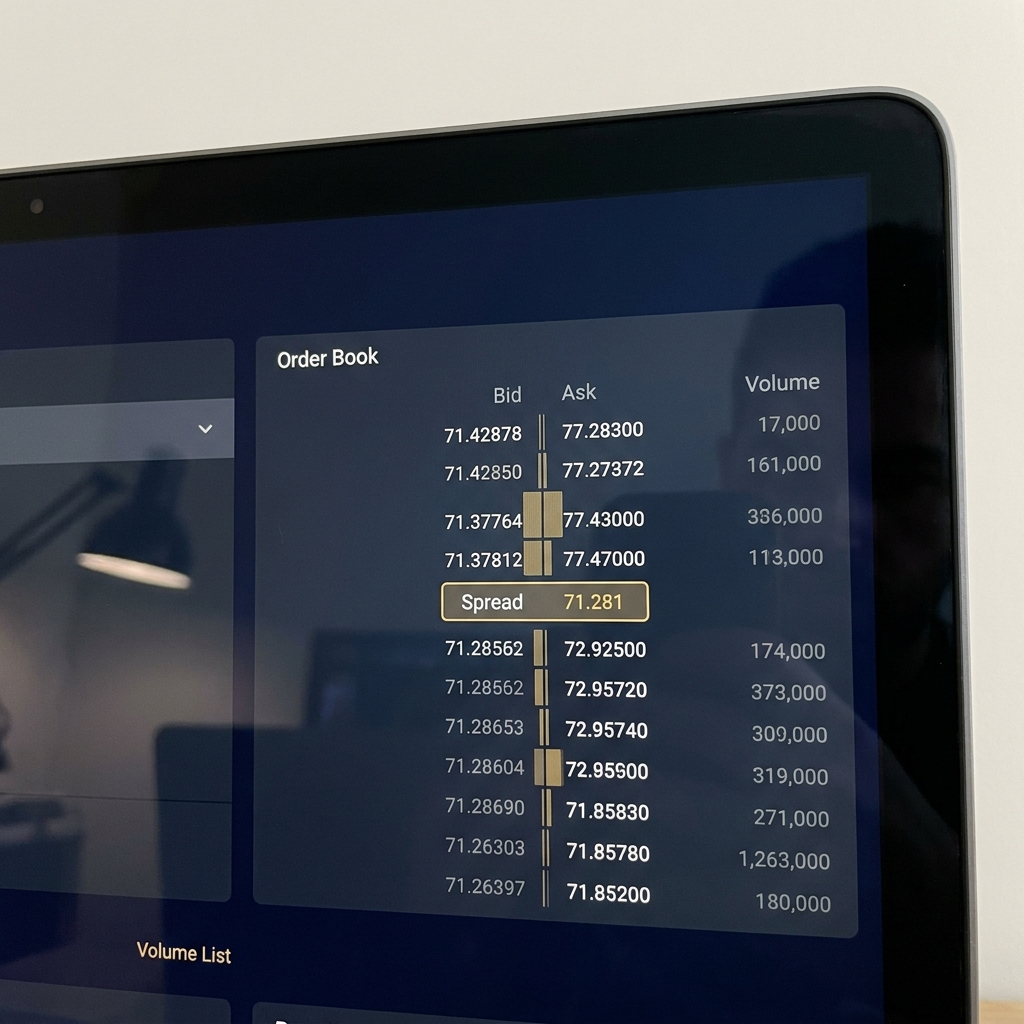
Those mechanics matter because even small trades can move prices sharply when depth thins, and execution quality can worsen in seconds.
Why Live Markets Move So Quickly
This section briefly defines the topic and points you to the monitoring checklist later in the article.
The article is evidence based and draws on regulatory and stability reports that document episodes of rapid depth evaporation and speed-related frictions, including a recent central bank review of cross-asset volatility and foundational research on speed races. BIS Quarterly Review, December 2025
a short real-time monitoring checklist for spreads, depth, and news
Use combined signals not single triggers
Definition and context: what we mean by live markets and fast moves
Defining live markets, spreads, and displayed depth
Live markets refer to tradable venues and electronic order books where prices update continuously, often multiple times per second.

The bid-ask spread is the difference between the best bid and best ask price at a moment in time. Displayed depth is the shown quantity at those prices; hidden liquidity is orders not visible on the displayed book, such as iceberg orders or dark pool interest.

Why the speed of price change matters for traders and risk teams
Speed matters because execution quality, slippage, and short-term PnL depend on how much quantity rests at the best prices and how quickly those quantities can vanish.
Short-horizon moves are typically driven by microstructure factors rather than changes in fundamental value, so separating execution risk from valuation risk is important for short-term decision making.
How liquidity can evaporate in seconds
Displayed depth and why it can be brittle
Displayed depth can be brittle when market participants reduce size or cancel quotes in response to increased perceived risk, leaving a thinner book that magnifies price impact for incoming orders.
Regulatory reviews document episodes where displayed liquidity thinned rapidly, and those episodes were associated with larger intraday swings and wider spreads. BIS Quarterly Review, December 2025
When liquidity providers withdraw, the same market order moves the price more because there are fewer resting shares or contracts at nearby price levels.
Get the real-time monitoring checklist
Sign up to receive the monitoring checklist and short updates on market microstructure developments relevant to live trading.
That thinning can happen even in normally liquid instruments when risk appetite changes unexpectedly, or when market makers step back to reprice across correlated instruments.
Order flow, dealers, and structural vulnerabilities
Why dealer capacity and concentration matter
Dealer capacity is the ability of intermediaries to absorb incoming order flow without materially changing quoted prices.
When capacity is limited and a small number of dealers supply a large share of liquidity, order flow surges can overwhelm those dealers and amplify price impact, a structural vulnerability noted by policy reports. FSB recommendations on market liquidity
How core government bond market structure can amplify moves
Core government bond markets are especially sensitive because dealer inventories and risk limits matter more when flows are large, and the withdrawal of market-making capacity can spill into other asset classes.
U.S. and international work has highlighted concentration and dealer capital limits as channels that can turn concentrated flows into large moves in a short time. OFR Annual Report 2024 Federal Reserve note on order flow imbalances
The role of algorithms and high-frequency activity
When algorithms help price discovery and when they pull back
Algorithmic trading often improves quoted depth and narrows spreads during normal conditions by providing continuous two-sided quotes and reacting to order flow.
However, many automated strategies reduce displayed size or widen quoting when volatility rises, which can make very short-term price moves steeper because the visible book no longer reflects latent buying or selling interest. ESMA TRV report
Short-horizon mechanics: fleeting quotes and race conditions
Speed competition can produce fleeting quotes that exist for tiny time windows, and those fleeting quotes can move apparent best prices without delivering tradeable size for longer-horizon orders.
Foundational work on high-frequency speed races explains how latency advantages create short-horizon dislocations that remain relevant to current market behavior. Quarterly Journal of Economics article on HFT arms race PMC article
How surprise news and macro shocks trigger instant moves
Why scheduled vs unscheduled events behave differently
Scheduled announcements like known economic releases allow some market participants to prepare pricing and adjust quotes, while unscheduled geopolitical or headline shocks can catch liquidity providers off guard and prompt immediate withdrawal of displayed size.
Reports on EU and UK markets document that surprise macro and geopolitical headlines often widen spreads and reduce depth within seconds, producing abrupt intraday moves. ESMA TRV report
How would you act if a major unexpected headline hit during your active window?
Prices move quickly when displayed liquidity thins, surprise information hits, algorithmic behavior changes, and latency differences create fleeting quotes, all of which increase short-term price impact and reduce execution quality.
After a surprise, markets may show large midprice moves and a sudden rise in volatility measures, and execution managers often either reduce sizes or switch to limit-only approaches until the book stabilizes.
Latency and the speed arms race in market microstructure
Why even millisecond differences matter
Latency differences determine who sees and reacts to new quotes first; when many participants race to be first, quotes can change faster than larger orders can execute at posted sizes.
This creates conditions where apparent top-of-book prices reflect very short-lived interest rather than durable depth, and that can distort execution quality for slower participants. Foundational evidence links these race conditions to fleeting quotes and short-horizon price effects. Quarterly Journal of Economics article on HFT arms race

A practical real-time monitoring checklist
Metrics to watch: spreads, depth, and volatility gauges
Track the following signals in real time: sudden bid-ask spread widening, rapid falls in displayed bid or ask depth, spikes in sub-second volatility measures, and a burst of news headlines affecting correlated assets.
Combine these metrics rather than acting on a single signal; for example, a small spread move without depth change is less concerning than simultaneous spread widening and depth collapse. BIS Quarterly Review, December 2025
How to interpret signals and set thresholds
Set thresholds tied to typical intraday baselines: a spread several times wider than the rolling median, displayed depth beneath a percentile threshold, or a microsecond volatility spike are useful triggers.
Use a short notification chain that distinguishes alerts for monitoring from alerts that require immediate execution adjustments, and document false positives to refine thresholds over time. ESMA TRV report
Common mistakes and sticky myths
Misreading correlation as causation
Fast price moves often correlate with many indicators, but correlation does not prove a permanent revaluation; rapid moves can reflect transient liquidity conditions rather than new fundamentals.
A common mistake is overfitting alerts to past episodes and expecting identical behaviour in future events; markets and participant behaviour evolve with regulation and technology. BIS Quarterly Review, December 2025
Over-reliance on latency or on a single metric
Relying solely on latency advantages or one metric can create blind spots; for example, being fastest on one venue does not protect against a correlated liquidity withdrawal across venues.
Algorithmic withdrawal is conditional and strategic, not an automatic market failure, so risk controls should focus on combined signals and pre-planned execution rules. OFR Annual Report 2024
Short scenarios traders should rehearse
A sudden macro surprise during thin hours
Scenario: a key macro release surprises on the downside during low-liquidity local hours. Expect immediate spread widening, reduced displayed depth, and volatile midprice swings across related instruments.
Prepared response: reduce order sizes, switch to passive limit orders with conservative prices, and pause exposure if the book shows sustained thinness. After the initial shock, reassess using depth and volatility gauges. ESMA TRV report
A concentrated bond market flow and cross-asset spillover
Scenario: a concentrated sell flow in core government bonds meets limited dealer capacity, pushing bond yields sharply and spilling into correlated rates and equity derivatives.
Prepared response: trim size in correlated assets, widen execution limits, and monitor dealer inventory signals. Dealer concentration can amplify such moves, so controls should account for cross-asset contagion. FSB recommendations on market liquidity
How recent reforms and transparency efforts may change the picture
Regulatory recommendations and intended effects
Recent policy work aims to enhance market resilience by improving transparency around liquidity provision and encouraging practices that bolster dealer capacity during stress.
The FSB has outlined recommendations focused on core government bond markets to strengthen resilience, and domestic reports have highlighted areas where structural fragility matters for rapid moves. FSB recommendations on market liquidity
Open questions and limits of reforms
While reforms may reduce some sources of abrupt depth evaporation, open questions remain over whether they fully prevent rapid withdrawal of displayed liquidity in extreme events.
Ongoing monitoring of how reforms change intraday behaviours remains important, and practitioners should continue to use real-time indicators. OFR Annual Report 2024
A short decision framework: when to trade and when to stand aside
Checklist for order sizing and execution during fast moves
If you detect simultaneous spread widening and depth collapse, reduce order size, favour limit orders over market orders, and consider pausing automated strategies until conditions stabilize.
Signals that should prompt caution include persistent depth below baseline, cross-asset volatility spikes, and missing dealer responses to large flow. Implement hard limits on executed size tied to these signals. BIS Quarterly Review, December 2025
Risk controls to protect PnL and reduce market impact
Use tiered execution: small, passive orders during stressed windows; larger, aggressive orders only after confirming recovery in depth and spread metrics.
The right choice depends on horizon and access to execution tools, so document playbooks for different scenarios and rehearse them periodically. Bank of England Financial Stability Report July 2025
Conclusion: key takeaways and suggested next steps
Three practical takeaways
1. Rapid live price moves usually come from a combination of thin displayed liquidity, surprise information, algorithmic withdrawal, and latency effects.
2. Monitor combined signals rather than single metrics, and use pre-planned execution rules to reduce market impact and protect PnL. BIS Quarterly Review, December 2025
Where to learn more and monitor developments
Follow stability and regulatory reports for updates on reforms and transparency changes, and keep a live monitoring rack that shows spreads, depth, and sub-second volatility.
Revisit and rehearse decision frameworks after notable events so your responses remain aligned with evolving market structure. FSB recommendations on market liquidity
Fast moves typically reflect a mix of thinning displayed liquidity, surprise news, automated strategy behavior, and latency-driven quote dynamics rather than immediate changes in long-term value.
Monitoring tools help by giving early warnings, but no tool eliminates risk; combine indicators and have execution rules to reduce impact.
Reforms may reduce some vulnerabilities, but they are unlikely to eliminate sudden depth withdrawal in all scenarios; ongoing monitoring remains essential.
References
- https://www.bis.org/publ/qtrpdf/r_qt2512.htm
- https://www.fsb.org/2024/04/enhancing-the-resilience-of-market-liquidity-in-core-government-bond-markets/
- https://www.financialresearch.gov/annual-reports/2024-annual-report/
- https://www.esma.europa.eu/press-news/esma-news/trends-risks-and-vulnerabilities-trv-report-no-1-2025
- https://doi.org/10.1093/qje/qjv027
- https://www.fundedplays.com/challenges
- https://www.bankofengland.co.uk/financial-stability-report/2025/july-2025
- https://www.federalreserve.gov/econres/notes/feds-notes/order-flow-imbalances-and-amplification-of-price-movements-evidence-from-u-s-treasury-markets-20251103.html
- https://pmc.ncbi.nlm.nih.gov/articles/PMC12358520/
- https://www.investopedia.com/terms/b/bid-askspread.asp
- https://www.fundedplays.com
- https://www.fundedplays.com/blogs
- https://www.fundedplays.com/blogs/how-fundedplays-evaluations-work