
Why Key Numbers Matter in NFL Spreads: a quick overview
What readers will learn
Why Key Numbers Matter in NFL Spreads is often a phrase you will hear in conversations about disciplined line shopping because certain margins of victory show up far more often than others. This article introduces the idea that specific margins, notably 3 and 7, are concentrated outcomes in football scoring and that those concentrations change how books price spreads and how bettors can capture small expected value advantages.
Readers will get a practical, evidence-based overview of the mechanics behind key numbers, how recent rule changes affect landing frequencies, and a step-by-step framework you can use when shopping lines. The recommendations here are backed by recent analyses of season-level margins and market behavior, and they are framed for testing rather than as guarantees.
Explore the FundedPlays Challenges page to learn about structured, measurable challenge workflows
Track lines early, note half-point availability, and subscribe to a simple checklist to make line-shopping a measurable habit.
How this article uses evidence and examples
The article ties concrete points to published analyses of landing frequencies and market signals while keeping examples schematic so you can replicate them in practice. Where I cite a specific empirical claim about margin frequencies or market effects, I include the original report or announcement as a reference for readers to consult.
The approach emphasizes process: identify key numbers, shop prices, avoid paying through 3 or 7 without documented edge, and use closing-line comparisons to validate decisions over time.
What key numbers are and the mechanics behind them
How scoring patterns create concentrated margins
Key numbers are the margins of victory that occur most often because of common scoring sequences in football, such as touchdowns with extra points and field goals. Because touchdowns plus an extra point produce a seven point swing and field goals produce three, margins of 3 and 7 show up more often than arbitrary numbers, creating concentrated landing frequencies that matter for spread betting.
That concentration is not mysterious. When a game features multiple scoring events, combinations of field goals and touchdowns produce repeated totals and margins that make certain differences more likely. Understanding those patterns is the first practical step toward recognizing why half points around those margins can change the probability of a push versus a win or loss.

Push probability, market pricing, and the half-point effect
A push happens when the final margin exactly equals the spread, returning stakes rather than producing a win or loss. Because pushes are more likely where landing frequencies cluster, books and bettors treat spreads adjacent to key numbers differently. For example, a market that sits at -3 faces a higher push probability than one at -2.5 or -3.5, which is why the presence or absence of the half-point matters in expected value calculations.
Books account for that push concentration in price and limits, often moving lines or adding scarcity to half-point alternatives to balance liability. Learning to spot when a half-point is available without excessive cost is a practical way to convert small probabilities into repeatable long-term gains.
Why 3 and 7 dominate the landing distribution
Data patterns from recent seasons
Analyses of recent NFL seasons show that margins of 3 and 7 remain the most frequent landing points, reinforcing their role as primary key numbers in spread markets, which explains why bettors and market makers pay attention to these figures Unabated analysis of NFL key numbers.
Concentrated margins increase push probability at those numbers, which makes half-point differences disproportionately valuable; disciplined shoppers who secure better numbers and validate entries against the closing line can convert small probability advantages into measurable expected value over time.
How those numbers shape market behavior
Because 3 and 7 appear most often, lines that sit on or cross those numbers tend to see greater resistance and cost. Market makers increase limits or adjust pricing to reflect the elevated push risk, and bettors who routinely secure a half-point away from these keys often realize incremental expected value. Over many trades, even small half-point advantages compound into measurable differences when compared to closing line performance.

Securing +3.5 instead of +3, or -2.5 instead of -3, is a concrete example: the half-point reduces the push probability and therefore shifts the payoff distribution in ways that matter for long-run edge, as explained in analyses of closing-line value and market behavior Unabated discussion on closing-line value.
Rule changes and evolving keys: PAT 2015 and the 2024 kickoff rule
How the 2015 extra-point rule nudged margins toward 6 and 8
The 2015 change to extra-point attempts increased variance around the once-standard automatic one-point conversion, which modestly raised the relative frequency of margins such as 6 and 8. That shift altered the distribution without removing 3 and 7 as the dominant keys, so the practical implication is to watch adjacent numbers but not to abandon the established priorities NFL Football Operations summary of the 2015 PAT change.
Analysts observed that the new PAT dynamics pushed some games off the classic key numbers and into nearby columns, so bettors should treat 6 and 8 as secondary keys that have become slightly more relevant since 2015, especially in specific game scripts or rule-driven contexts.
What the 2024 hybrid kickoff rule could change and why we must watch multi-season data
The NFL implemented a hybrid kickoff rule in 2024 designed to increase returns and change field position, which can plausibly affect scoring patterns and therefore landing frequencies over time. The rule's intent and initial description are public, but its long-run effects on margins need multiple seasons of observation before one can draw firm conclusions NFL announcement of the 2024 kickoff rule.
For now, treat the 2024 rule as a watch item. It is reasonable to monitor whether landing frequencies near 3, 6, 7, and 10 shift as teams adapt special teams strategy and as the overall scoring environment evolves. Changes of this kind can be subtle and gradual, so resist quick heuristic switches until empirical multi-season patterns appear.
How lines, prices and limits behave around key numbers
Why books show resistance near 3 and 7
Market makers account for higher push probabilities by imposing price resistance and by making half-point alternatives harder to access without a price concession. When liability concentrates at a key number, books may move lines more cautiously or shorten limits rather than leaving a market exposed to frequent pushes and correlated outcomes, which is visible in observed price behavior near common keys Action Network explanation of NFL key numbers.
Resistance can show up as slower line movement, larger price concessions required to obtain a better number, or increased bookmaker limits on certain sides. For disciplined bettors, seeing this resistance is a market signal rather than a barrier: it informs whether a half-point is worth pursuing when weighed against model-implied edge and roster news.

Using market signals: line movement, limits, and half-point pricing
Reading market signals is about turning observed behavior into repeatable decisions. If you see a line push from -3 to -3.5 with limited availability at -3.5 and a high cost at most books, that scarcity is itself information and should be priced into your decision framework.
One reliable validation technique is to track whether your early entries beat the closing line. Beating the closing line remains a robust indicator of edge, so compare your entries and outcomes to the close as a way to measure whether your key-number-aware choices add value over time Unabated on closing-line value.
A practical framework to use key numbers when line shopping
Step-by-step checklist for pregame and live markets
1) Identify key numbers on your card, marking games where the spread is at or adjacent to 3 or 7.
2) Shop multiple markets or books to find half-point alternatives. Record the price difference and any limit constraints.
3) Evaluate model-implied edge against cost to secure the half-point. If the adjusted edge exceeds your documented threshold, take the better number; if not, pass.
4) For live markets, consider how scoring events change the probability of landing on a key number and whether the half-point remains available at a fair price after those events.
5) After each event, compare your entry to the closing line and log the result to quantify whether your choices improved your closing-line performance over time Unabated guidance on using closing-line comparisons.
quick trade logging and line-check workflow
Keep entries concise for consistent tracking
Tools and metrics to monitor (including closing line)
Use a simple tracker to log date, line taken, book, price, and the closing line. Over time, summarize how often half-point efforts beat the close and compute the net result versus a baseline that ignores half-points. This is how you turn anecdote into evidence.
Track a few core metrics: frequency of half-point availability, cost paid to secure it, win rate when you took it, and closing-line difference. These metrics provide a quantitative basis to decide whether pursuing small half-point advantages consistently improves your edge.
Decision criteria: when to take half-points and when to pass
Simple rules of thumb
Favor taking a half-point when your model or documented edge justifies the cost, especially if the half-point moves you off 3 or 7. Clear conditions that favor taking the half-point include model-implied edge beyond your threshold, correlated lineup news that increases confidence, or low cost relative to expected value gains.
Conversely, pass on half-points when EV is marginal, uncertainty is high, or market resistance at a key suggests the cost is driven by predictable push risk rather than mispricing Action Network on priced-in push risk.
Situations where paying through 3 or 7 may be justified
There are situations where crossing a key can be justified, such as when you have outsized model confidence, unique team news that meaningfully alters win probability, or correlated exposures that require line management. When you do cross a key, document the rationale and track the outcome so the decision becomes part of your process rather than an ad hoc choice.
Strategic reasons to cross a key should be rare and recorded. Over time, this discipline prevents drifting into emotional or momentum-driven decisions that erode long-term performance.
Typical mistakes and common pitfalls when using key numbers
Overfitting to short-term noise
One common error is overreacting to single-season blips or limited samples, especially during periods when rule changes are in play. The 2024 kickoff rule, for example, is plausible in its effects but requires multi-season data before you reprogram heuristics around landing frequencies NFL announcement of the 2024 kickoff rule.
Avoid wholesale strategy shifts based on early or partial-season trends. Build a testing window and require consistent multi-season signals before updating core heuristics tied to 3 and 7.
Chasing half-points without process
Chasing every available half-point without documented edge and bankroll discipline is another predictable pitfall. Small wins can feel addictive, but without tracking and stop-loss rules you can erode capital and create misleading samples that confirm bias.
Maintain a tracking discipline that logs every half-point decision, the rationale, and the closing-line comparison so you can objectively evaluate whether chasing those edges is actually profitable in your workflow Unabated on process validation using closing-line metrics.
Practical scenarios and examples you can test
Scenario A: securing +3.5 instead of +3
Imagine your model gives a 48 percent chance for the underdog to cover at a listed spread of +3. If you secure +3.5 instead, you remove the push scenario and improve the payoff on ties. Record the entry price, track the closing line, and compare the net outcome after a sample of such trades to see whether the half-point pursuit materially changes your closing-line performance.
In practice, run this scenario in simulation or with small stakes and log both the immediate result and the closing-line delta to build a sample that verifies the heuristic before committing larger stakes.
Scenario B: avoiding paying through 7 when uncertainty is high
When a line sits at -6.5 and you are deciding whether to take -7 at a small additional cost, weigh your model confidence and roster uncertainty. If key injuries or uncertain weather make your estimate fragile, prefer to avoid paying through 7 unless your model indicates a clear edge that justifies the cost. Document the choice and check outcomes versus the close to validate the approach.
These scenarios are exercises rather than prescriptions. The core idea is to test and quantify whether the rules of thumb improve your process before scaling them into routine practice Unabated on iterative testing and CLV.
Conclusion and what to monitor next season
Key takeaways
3 and 7 remain the primary key numbers in NFL spreads, and being disciplined about half-point availability around those numbers is a reliable way to hunt for incremental expected value. The 2015 PAT change made 6 and 8 modestly more relevant, and the 2024 kickoff rule is an event worth monitoring as additional seasons of data accumulate NFL summary of PAT changes.
Beating the closing line continues to be a robust validation tool. Use line shopping, documented decision rules, and closing-line comparison to turn anecdote into measurable edge, and update heuristics only when multi-season evidence supports a change.
Data points to watch
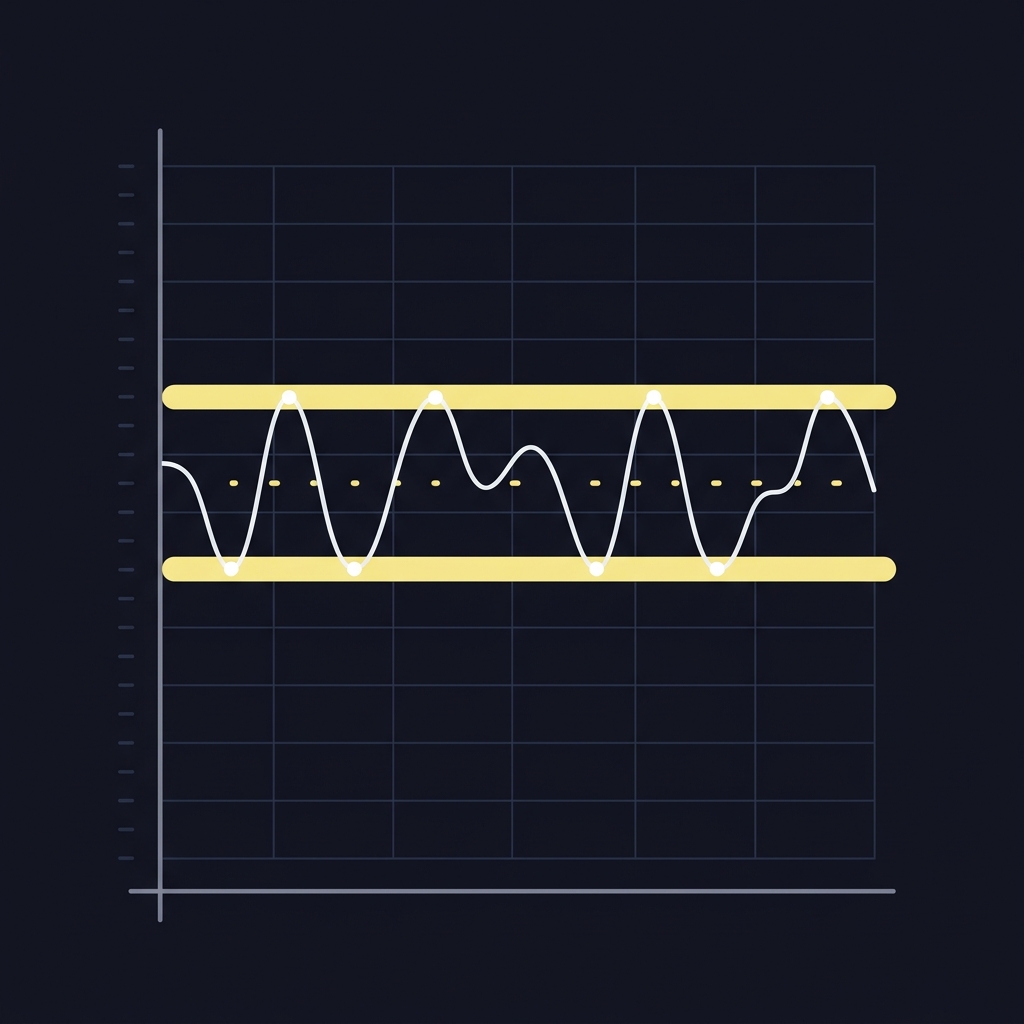
Track landing frequencies for 3, 7, and adjacent margins like 6 and 8, monitor closing-line beat rates after half-point plays, and observe whether kickoff-rule adaptations shift field position and scoring patterns meaningfully over seasons. Those metrics will tell you whether to tweak priorities or to maintain the status quo.
Yes. The 2015 change increased the frequency of margins like 6 and 8, but 3 and 7 remain the primary key numbers, so treat 6 and 8 as secondary considerations.
Log date, line taken, book, price, and the closing line. Track frequency of half-point availability, cost paid, and whether your entries beat the close to assess value.
Not immediately. The 2024 kickoff rule is worth monitoring, but update heuristics only after multi-season evidence shows consistent shifts in landing frequencies.
References
- https://unabated.com/learn/nfl-key-numbers/
- https://unabated.com/articles/does-closing-line-value-still-matter/
- https://operations.nfl.com/the-rules/2015-changes-to-the-point-after-touchdown/
- https://www.nfl.com/news/nfl-owners-approve-implementing-new-kickoff-rule-for-2024-season
- https://www.actionnetwork.com/nfl/nfl-key-numbers
- https://www.fundedplays.com/challenges
- https://www.fundedplays.com/blogs/how-fundedplays-evaluations-work
- https://www.fundedplays.com/blogs
- https://www.fundedplays.com
- https://www.covers.com/nfl/key-numbers
- https://www.espn.com/nfl/story/_/id/46447959/nfl-kickoff-rules-return-landing-zone
- https://www.uakron.edu/economics/docs/academics/senior-projects/JoshuaKlattSeniorProjectSpring2025.pdf