

What home-court advantage means and why it matters
Why Home-Court Advantage Is Stronger in Some Arenas
Home-court advantage is the measurable edge teams enjoy when playing at their own arena, typically visible in higher home win rates and better scoring margins than on the road. Analysts quantify this edge using metrics such as home versus away win rate, average scoring margin at a given venue, and adjusted performance measures that control for team strength and opponent quality.
Measuring at the arena level is useful because it separates persistent venue effects from team-level strength or a single strong season. League season summaries provide the baseline home/away splits analysts use to judge whether a venue shows an unusual edge relative to the league, and those public summaries make multi-season benchmarking practical 2025 NBA season summaries on Basketball-Reference. Analysts can also test these checks on platforms such as Funded Plays.

Core mechanisms behind stronger home-court advantage
Multiple mechanisms combine to create stronger home-court advantage at specific arenas. The principal contributors include crowd influence, travel and rest patterns, arena physical context such as altitude and sightlines, officiating tendencies and player familiarity with a particular court. These factors often act together; for example, crowd noise can amplify small officiating biases while travel fatigue can magnify the effect of routine disruption.
Systematic reviews find that crowd presence and referee behavior are established drivers of home advantage, and they emphasize that these are part of a wider, interacting set of causes rather than single explanations. That synthesis helps analysts prioritize which variables to measure when testing for arena-level effects an updated review in Sports Medicine - Open and an assessment of officiating decisions Home advantage and the influence of officiating decisions.
How crowd size and noise make some arenas louder advantages
Crowds affect games in two main ways: they influence players directly, raising arousal, confidence and perceived momentum for home players while disrupting visiting team communication, and they influence referees indirectly by creating pressure and ambiguous sensory cues during disputed plays. Acoustic design and the shape of a bowl determine how crowd noise translates into on-court distraction and support, so two arenas with the same attendance can produce different practical effects.
Try venue-aware challenges on FundedPlays
Explore the article examples and tools below to see how simple venue checks can be built from public game logs and officiating reports.
Natural experiments from the pandemic era where games were played without spectators provide strong causal evidence that removing fans reduced home-favorable officiating patterns and narrowed home performance advantages, supporting the role of crowd-driven mechanisms in creating arena-level edges a systematic review of competitions without spectators and related analyses such as The Effect of the Crowd on Home Bias.
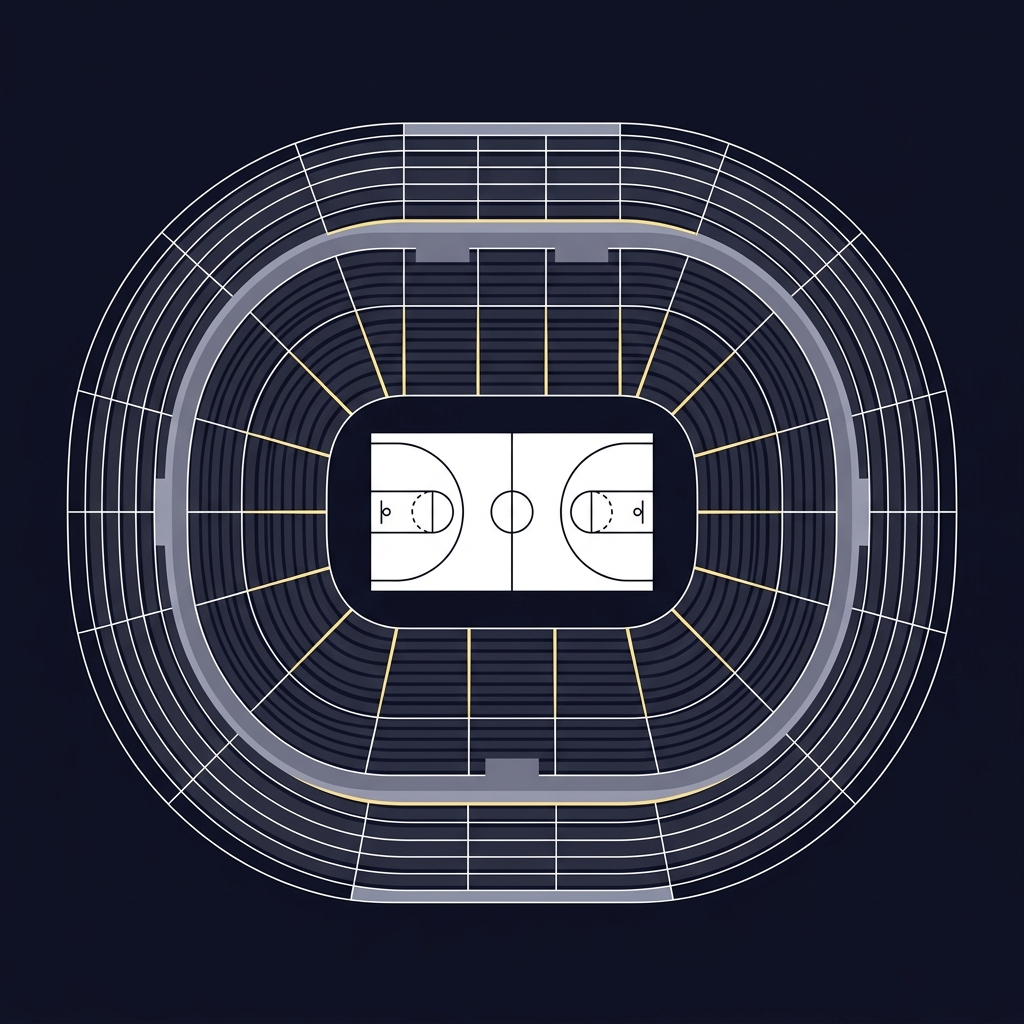
Not every large crowd produces the same advantage; architectural features such as sightlines, entry paths and even court backdrop contrast can change visiting shooters' visual references and small timing cues, which in turn affects measurable shooting efficiency and turnover rates.
Officiating, transparency and venue-specific whistle patterns
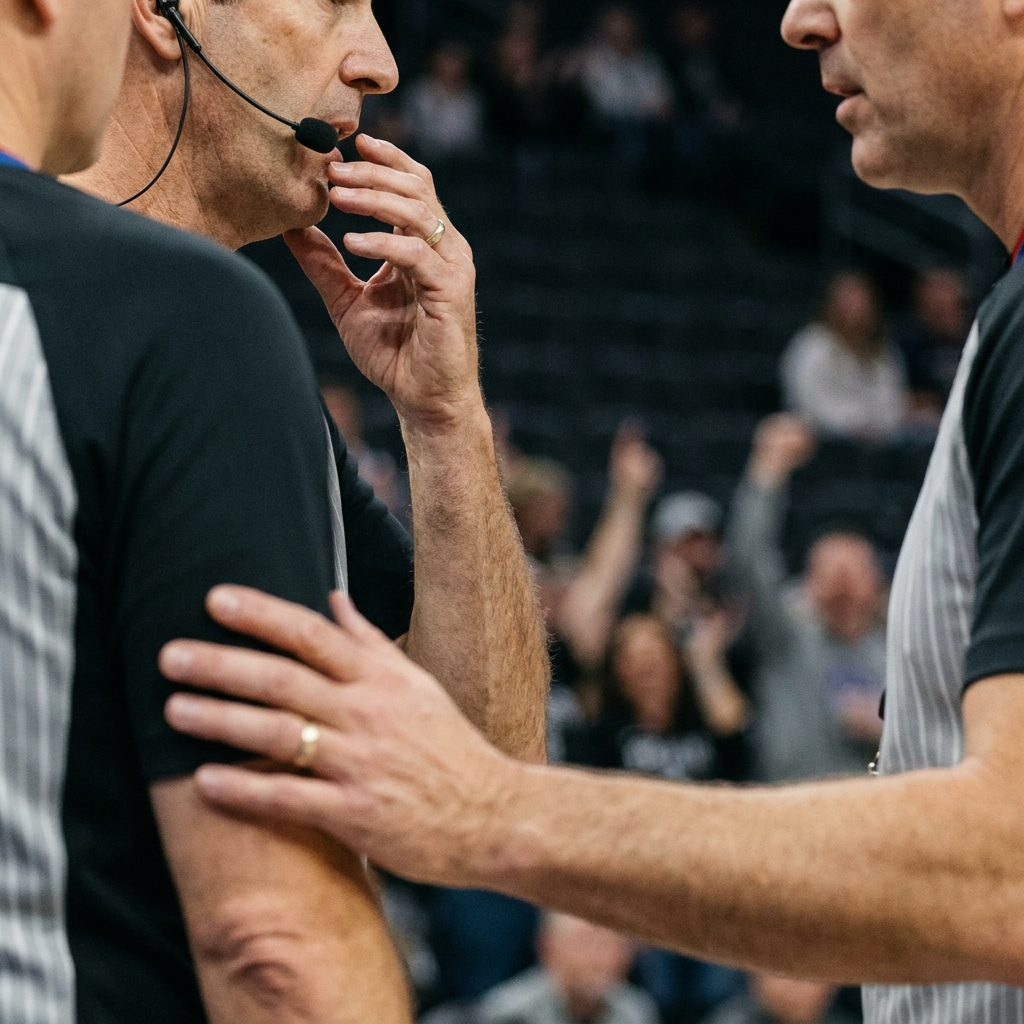
Officiating can vary by venue because referees respond to subtle social and sensory cues in noisy, partisan environments, and those responses can translate into systematic differences in foul calling or missed infractions. Do NBA refs favor the home team? Do NBA refs favor the home team?

Analysts can use L2M reports to compute error-rate baselines in late-game states and then test whether a particular arena shows persistent deviations after controlling for game state and team quality. Because these reports document specific calls and outcomes, they make it possible to move from anecdote to reproducible, data-driven checks NBA Last Two Minute reports.
A simple first check is to aggregate L2M-identified call errors by arena for a multi-season window, then normalize by the number of close-game opportunities to detect venues that exceed league error rates; this method helps separate random variability from consistent patterns.
Travel, schedule design and why some road trips cost more
Travel burden is a measurable driver of road performance. Cumulative miles, time zone crossings and back-to-back games all disrupt sleep, recovery and practice schedules, making some road trips inherently more costly. Incorporating travel miles and time-zone shifts into short-term forecasts helps explain why certain arenas host visitors that underperform relative to baseline expectations.
League schedule design in the 2024-25 season reduced back-to-back games and highlighted travel patterns as a policy lever that can change aggregate road performance, which means analysts should treat schedule structure as a controllable covariate when modeling venue effects NBA schedule release and travel notes.
quick travel burden check for a road trip
Use multi-day aggregation for season-level estimates
Quantifying travel is practical: compute straight-line miles or use scheduled flight distances, record the number of time zones crossed and flag back-to-back sequences; combining these variables gives a transparent travel-burden score that explains part of venue-level visiting-team underperformance.
Altitude, sightlines and other physical arena factors
High elevation imposes physiological stress on visiting players who have not had time to acclimatize, producing modest but persistent home edges that diminish as visiting teams arrive earlier or schedule acclimatization. Peer-reviewed studies find small but detectable performance differences tied to altitude, especially for teams that travel from low-elevation locations without extra preparation research on altitude and performance in professional basketball.
Non-altitude factors such as court backdrop contrast, lighting and unique sightlines change depth perception and the visual cues shooters use, which can translate into measurable venue-specific shooting variance. Teams can mitigate these effects with early arrival, targeted practice sessions on the arena court and video preparation focused on visual references.
Player routines, practice access and the familiarity edge
Routine matters. Home teams keep consistent pre-game rituals, unbroken travel-free days and stable access to the practice court and locker room, which together create small performance advantages that accumulate across a season. Familiarity with the home facility means less cognitive load around logistics and more time for focused game planning.
A combination of crowd effects, travel and schedule burden, officiating tendencies, arena physical characteristics and familiarity-driven routines creates stronger venue-level advantages; testing requires multi-season data and appropriate controls.
Those routine advantages are behavioral rather than physiological, but they are measurable in practice access logs and minute-by-minute performance metrics that show fewer early-game turnovers and steadier rotation patterns for home teams that keep consistent routines.
Team tactics, coaching and roster fit for home environments
Coaches adapt tactics to exploit home-court traits, for example by emphasizing pace, defensive switching or floor spacing that suits local sightlines and crowd feedback. Substitution patterns and matchup choices can be intentionally skewed at home to maximize the marginal benefit of crowd and court familiarity.
Roster characteristics such as a high proportion of veteran decision-makers or two-way shooters who maintain composure under pressure can interact with venue effects. These tactical and roster modifiers are contextual; they amplify or dampen existing arena tendencies but are rarely sole causes of a persistent edge.
Data sources and how to measure arena-specific effects
Reliable public sources include league season summaries, Basketball-Reference splits, play-by-play logs and NBA L2M reports. Combining these sources allows analysts to compute adjusted home/away win rates, venue-level scoring margins and officiating error rates in a consistent framework. Use season summaries to set the league baseline and play-by-play to compute venue-specific metrics Basketball-Reference season splits.
A practical checklist: aggregate multiple seasons to increase sample size, compute adjusted scoring margins by controlling for team quality, and compare L2M-derived error rates by venue. When sample sizes are small, widen the multi-season window before declaring a venue effect as persistent.
Modeling arena effects: controls, confounders and simple tests
Recommended controls include team strength indicators, rest days, travel miles, time zones, game state and opponent quality. Including these covariates helps isolate venue fixed effects from schedule-driven or roster-driven variance.
A simple modeling approach is a mixed-effects or linear model with venue fixed effects and team-season controls; interpret venue coefficients as the arena-level deviation after accounting for the listed covariates. Validate model outputs against L2M and season summaries to ensure that venue estimates are consistent with officiating reports and league baselines use L2M reports for validation.
Common mistakes and analyst pitfalls
Avoid attributing short-term team quality swings or a run of home wins to permanent venue advantage without controlling for schedule quirks. Single-season anomalies often revert, so require multi-season evidence before asserting persistent arena-level edges.
Small-sample traps are common: venues with few close games can show large apparent effects that disappear once more observations accumulate. Confounding between crowd effects and officiating is another frequent pitfall, so test crowd-driven hypotheses with natural experiments or L2M data where possible evidence from empty-venue natural experiments.
Practical examples and short case studies
High-elevation venue examples show measurable but small edges for home teams that are consistent across seasons; analysts who include arrival and acclimatization windows see those effects shrink when visitors allow extra preparation time. Readers can reproduce these checks using season summaries and multi-year game logs to compare early-season visits versus late-season visits peer-reviewed altitude research.
Using Last Two Minute data, a simple arena check aggregates identified call errors in close games across several seasons and compares the per-opportunity error rate to a league baseline. If a venue consistently exceeds league error rates after controlling for game state and team quality, that suggests an officiating pattern worth further investigation NBA L2M methodology and reports.
How fans, analysts and challenge platforms can use these insights responsibly
For fans and analysts, incorporate venue covariates such as travel burden and recent home/away splits into short-term forecasts, and assign higher uncertainty to venue claims supported by small samples. Track venue-level performance over multiple seasons rather than relying on a few games.
Participants on skill-based challenge platforms should use venue-aware strategies as part of a disciplined process: test approaches across venues, document results, and avoid implying guaranteed returns from venue effects. Platforms that emphasize consistent performance can help users evaluate whether a venue-aware edge holds over time how Funded Plays evaluations work.
Conclusion: a checklist for spotting truly strong home-court arenas
Checklist: confirm multi-season persistence, control for team strength and schedule, compare venue scoring margins to league baselines, check L2M officiating patterns, and account for travel and physical context. Only after these steps should an analyst label an arena as having a truly strong home-court advantage.
Remember that most effects are modest; rigorous replication and transparent reporting are essential when claiming venue-level advantages, and small-sample caution should guide public statements.
Crowd presence is a major contributor: evidence from natural experiments without spectators shows reduced home-favorable effects, but the exact share depends on other factors like travel and officiating.
Travel and scheduling are measurable contributors and can explain much variance, but they rarely account for all differences; arena physical factors and officiating also matter.
Aggregate multi-season venue metrics, control for team strength and schedule, compare against league baselines, and check L2M officiating reports for consistent error-rate deviations.
References
- https://www.basketball-reference.com/leagues/NBA_2025.html
- https://www.fundedplays.com/challenges
- https://sportsmedicine-open.springeropen.com/
- https://sjsp.aearedo.es/index.php/sjsp/article/view/home-advantage-influence-officiating-decisions
- https://www.frontiersin.org/articles/10.3389/fspor.2022.915312/full
- https://pmc.ncbi.nlm.nih.gov/articles/PMC9420652/
- https://official.nba.com/last-two-minute-reports/
- https://pudding.cool/2017/03/home-court
- https://www.nba.com/news/nba-unveils-2024-25-regular-season-schedule
- https://journals.plos.org/plosone/
- https://www.fundedplays.com
- https://www.fundedplays.com/blogs/how-fundedplays-evaluations-work
- https://www.fundedplays.com/blogs