

Quick overview: why this metric matters when games are tight
What readers will learn
Why Free-Throw Rate Matters in Close Games is a focused look at one simple but powerful stat: free-throw rate, the share of a team or player's free-throw attempts relative to field-goal attempts. In tight finishes, free throws concentrate and can swing outcomes, so this metric belongs on any late-game checklist.
How to use this article
The article follows a short roadmap: a clear definition and measurement guide, a rules section that explains why free-throw volume rises late, a review of evidence linking fouls and free throws to close-game outcomes, and practical pre-game and in-play templates you can use right away. Look for the Product link in the measurement section, the empty reflective Question in the rules section, the Tool calculator in this opening, and the CTA in the decision rules section.
Quick FTR calc from free throws and field goal attempts
Use per-game or per-100 possessions for comparison
Free-throw rate is actionable because the rules of each league and late-game dynamics concentrate free-throw opportunities when games are close. Analysts should treat FTR alongside free-throw percentage and foul patterns rather than as a sole predictor.
Why Free-Throw Rate Matters in Close Games
At its simplest, free-throw rate helps answer: who is likely to get to the line and how much will those trips matter in the final minutes. That practical focus is why the metric is so useful to coaches, bettors, and analysts who need quick, evidence-based adjustments in close games.
Definition and context: what free-throw rate is and how analysts measure it
Standard FTR: FTA divided by FGA
Free-throw rate is commonly defined as free-throw attempts divided by field-goal attempts, sometimes expressed as a percentage or as attempts per 100 possessions for apples-to-apples comparisons; this formal definition appears in contemporary stat glossaries and resources NBA Stats Glossary and publicly available player season free-throw lists ESPN free-throws.

In practice, a brief example helps: a player with 50 free-throw attempts and 200 field-goal attempts has an FTR of 0.25, or 25 percent, which tells you how often that player turns shooting possessions into free-throw chances.
Pace-adjusted variants and per-100 possession metrics
Because teams play at different speeds, analysts often use pace-adjusted variants such as free-throw attempts per 100 possessions to compare players and teams fairly; Dean Oliver's Four Factors provide the foundational framework that situates FTR among core efficiency measures Basketball on Paper.
When you fetch numbers, prefer season-level and per-100-possession measures for neutral comparison, and keep raw per-game counts as supplementary context rather than the main comparator.
How late-game rules amplify free-throw importance
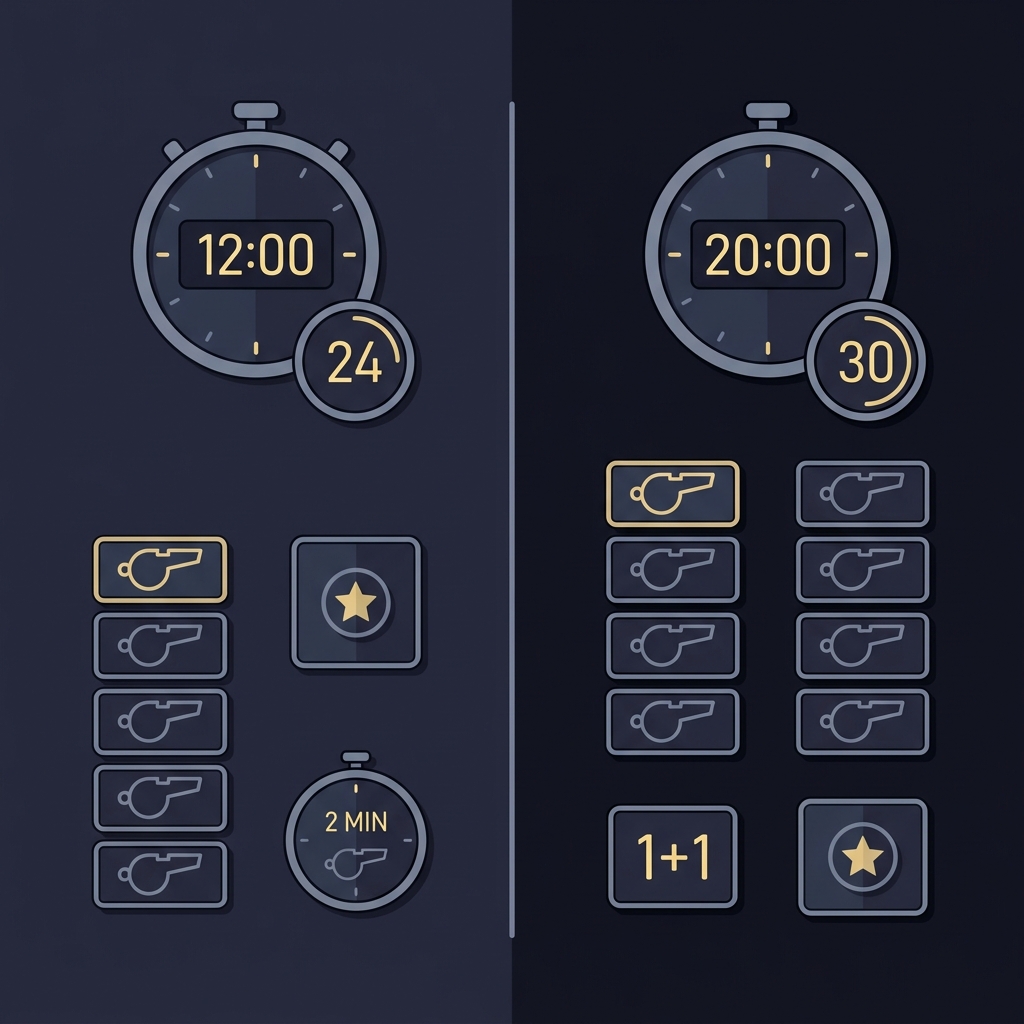
NBA: team foul penalty by quarter and last-two-minute provisions
The NBA's team-foul penalty structure by quarter and its special last-two-minute provisions increase the frequency and impact of free throws late in games, which raises the practical weight of free-throw rate when scores are close Official NBA Rulebook.
Treat free-throw rate as a volume signal that matters most under league-specific late-game rules; always pair it with free-throw percentage, bonus status, and foul-trouble checks, and use structured decision rules rather than instinctive reactions.
NCAA: one-and-one and double-bonus effects
In college play, the one-and-one after the seventh team foul and the double-bonus after the tenth shift late-game strategy by creating larger windows of free-throw opportunity, concentrating trips to the line as teams fight for final possessions NCAA rules book.
Because those rules change how teams manage fouls and clock, the same raw FTR number can imply different late-game risks in college and professional contexts; always consider the rule set before applying strategies across levels.
The evidence: what research and team clutch stats say
Systematic reviews and meta-analyses
Peer-reviewed performance analyses identify fouls and free throws as significant discriminators of winning in close games, supporting the use of FTR and free-throw differential as key indicators rather than anecdotal hunches Frontiers in Psychology review.
That systematic perspective stresses we should treat FTR as one of several signals and to apply appropriate caution with small samples or situational splits.

League clutch leaderboards and practical correlations
League clutch leaderboards show that teams which pair higher clutch-time FTR with solid free-throw percentages tend to post better clutch offensive ratings and improved late-game records, offering practical predictive value for in-play decisions and matchup planning NBA clutch stats and related player splits players clutch stats.
Those correlations are useful for rule-of-thumb decision-making, but they do not imply determinism; match context, player roles, and moment-to-moment strategy still shape outcomes.
How to measure free-throw rate in 2026: practical metrics and splits to check
Season and player-level FTR
Before a game, pull season-level FTR and per-100-possession FTR for both teams and for primary scorers to see baseline foul-drawing tendencies; authoritative stat glossaries and team clutch splits provide the standard definitions you need NBA Stats Glossary.

For player-level work, combine FTR with each key ballhandler's free-throw percentage and the opponent's defensive foul rate to estimate both volume and expected points from the line. See the Funded Plays blog.
Clutch splits and pace-adjusted measures
Clutch splits, last-five-minute splits, and FTA per 100 possessions are the situational metrics you want in the final minutes; clutch splits show whether a team sustains its foul-drawing tendency under pressure and pace-adjusted metrics remove tempo bias NBA clutch stats.
When comparing, use per-100 values and clutch windows from the same data provider so definitions match; mixing providers with different clutch criteria can create misleading comparisons.
Pre-game and in-play checklist: what to check before tip and during crunch time
Pre-game: matchups and foul profiles
Pre-game checks should include team and opponent season FTRs, primary scorers' FT%, opponent defensive foul rate, and projected matchup minutes for primary defenders to estimate likely foul paths during crunch time NBA clutch stats.
These items let you convert a raw matchup read into simple actions: expect more trips to the line, adjust defensive aggressiveness, or identify players to target or avoid driving in late possessions. See Funded Plays for related analysis.
In-play: bonus status, foul trouble, and ballhandler FT% checks
During the game watch the current team bonus status, remaining time, personnel in foul trouble, and which player will handle the final plays; in the NBA, quarter penalties and last-two-minute procedures change the cost of fouls in the closing moments Official NBA Rulebook.
Keep a short list of two hedges for live decisions: reduce risky drives when opponents are in the penalty with strong FT shooters, or increase isolation attempts when the opponent draws frequent fouls but shoots poorly from the line.
Decision criteria: when free-throw rate should change your plan
Rule of thumb for coaches: if the opposing team's clutch FTR is high and their primary scorers convert at an above-average FT%, prioritize avoiding fouls that lead to free throws and consider switching to more containment-based defense rather than aggressive help; this tradeoff reflects both foul volume and conversion quality NBA clutch stats.
Rule of thumb for bettors: a market hedge or lean can be justified when live indicators show a team is likely to generate multiple late free-throw trips and the opponent has elite FT%; use in-play odds and team bonus status to size hedges conservatively and avoid overreaction to a single sequence.
Try checklist practice with FundedPlays Challenges
If you rely on checklists, try converting these rules into a short, repeatable pre-game and in-play checklist you can practice in simulation to see how often the signals align with outcomes.
When a team is in the penalty and the opponent's FT% is strong, the expected cost per foul rises; in those moments, intentional fouling becomes a tactical choice that depends on timeout availability, substitution patterns, and the specific matchup rather than a fixed rule Official NBA Rulebook.
Common mistakes and pitfalls when using FTR in close-game analysis
A frequent error is over-interpreting short clutch samples; clutch splits are by definition small and can show volatile swings that regress toward a season mean, so treat very recent spikes or drops as noisy unless they persist across larger samples Frontiers in Psychology review.
Another common mistake is using FTR without FT% and matchup context; a high FTR matters more when the fouled team converts reliably from the line, so always pair volume with accuracy checks.
Practical scenarios: three applied examples from recent league contexts
Scenario 1: exploiting high FTR but weak FT% late
Imagine a team with a high clutch FTR but below-average free-throw percentage; a practical plan is to encourage attacking the rim late, drawing fouls while relying on defensive rebounding and offensive retentions to mitigate opponent scoring, because trips to the line are less costly when conversion is weak NBA clutch stats.
Actionable takeaway: target drives and contact against their primary defenders, but keep contingency plans for offensive rebounds and quick resets.
Scenario 2: guarding a team with elite clutch FTR and FT%
If an opponent combines elite clutch FTR with high FT%, shift to containment defense that forces perimeter shots and uses clean verticality; the objective is to reduce contact opportunities that create easy points from the line NBA clutch stats.
Actionable takeaway: prioritize matchups that minimize drives and keep fouls on non-shooters when possible.
Scenario 3: live in-play adjustment when a primary defender picks up fouls
When a primary defender gets into foul trouble in the final minutes, projected defensive matchups change and FTR expectations can spike; a live adjustment is to protect the remaining key defender with substitutions that lower foul risk while using timeouts to reorganize end-game roles NBA clutch stats.
Actionable takeaway: have a substitution plan ready and communicate who will take the key end-of-game defensive assignments before possession starts.
College specifics: how NCAA bonus rules change late-game dynamics
College rules create different incentives because one-and-one situations and the double-bonus concentrate free throws differently than professional quarters; after the seventh team foul the one-and-one increases the pressure on ballhandlers to make contact count, and after the tenth the double-bonus further raises late-game free-throw volume NCAA rules book.
Strategically, coaches manage clock and substitutions differently in college: intentional fouling and late substitutions often aim to force one-and-one or to avoid giving the opponent easy late attempts, so analysts should use level-specific clutch splits rather than extrapolating from pro data.
Open questions in 2026: rule, whistle, and lineup effects to watch
Referee emphasis and whistle tendencies can move seasonal baselines for FTR, and this remains a research area; changes in official interpretations or enforcement can shift how often players reach the line, altering historical comparisons across seasons Official NBA Rulebook.
Lineup construction is also evolving: small-ball and switching defenses may change which players draw fouls and where on the court contact happens, so track lineup-level foul-drawing rates and how switching affects late-game penetration and contact.
Practical templates: pre-game checklist and a short in-play flow
Pre-game one-page checklist
Copyable pre-game items: season FTR and FTA per 100 possessions for both teams, primary ballhandler FT%, opponent defensive foul rate, likely starter minutes and substitution windows, and last-5 and clutch FTR splits for primary scorers NBA Stats Glossary.
Keep this to a single sheet that you can read quickly and use to set defensive priorities and betting hedges before tip; see how Funded Plays evaluations work for an example.
In-play decision flow for the last two minutes
Short flow: detect bonus status, check key player's FT%, note foul trouble, adjust defensive aggressiveness, and choose between hedging or holding position in the market; this keeps decisions structured and repeatable under pressure NBA clutch stats.
Combine these templates with responsible bankroll and risk management practices, and favor small, informed adjustments over large reactive moves.
Conclusion: key takeaways and how to act on free-throw signals
Three essential rules of thumb
First, use free-throw rate as a volume signal and always pair it with free-throw percentage to estimate expected points from the line Basketball on Paper and advanced stats basketball-reference advanced.
Second, treat league rules and clutch splits as context: NBA and NCAA structures make free throws more likely in close games, so level-specific checks are essential Official NBA Rulebook.
Third, avoid overconfidence with small-sample clutch splits; use repeated checklist practice and simulation to see how often FTR signals align with outcomes before you change live tactics or bet sizing Frontiers in Psychology review.
Use the templates and decision rules here to make structured, modest adjustments in coaching and market decisions rather than betting strategies that assume certainty.
Free-throw rate is typically free-throw attempts divided by field-goal attempts and can be expressed per 100 possessions for pace adjustment.
No. A high free-throw rate indicates more trips to the line but must be paired with free-throw percentage and matchup context to estimate impact.
No. NCAA one-and-one and double-bonus rules change late-game free-throw dynamics, so use level-specific clutch splits.
References
- https://www.nba.com/stats/help/glossary/
- https://www.espn.com/nba/stats/player/_/stat/free-throws
- https://books.google.com/books?id=6ckmAQAAQBAJ
- https://official.nba.com/rulebook/
- https://www.ncaapublications.com/p-4748-2024-25-and-2025-26-ncaa-mens-basketball-rules-book.aspx
- https://www.frontiersin.org/articles/10.3389/fpsyg.2024.XXXXX/full
- https://www.nba.com/stats/teams/clutch-traditional/?Season=2024-25&SeasonType=Regular%20Season
- https://www.fundedplays.com/challenges
- https://www.nba.com/stats/players/clutch-traditional
- https://www.fundedplays.com
- https://www.fundedplays.com/blogs
- https://www.fundedplays.com/blogs/how-fundedplays-evaluations-work
- https://www.basketball-reference.com/leagues/NBA_2026_advanced.html