
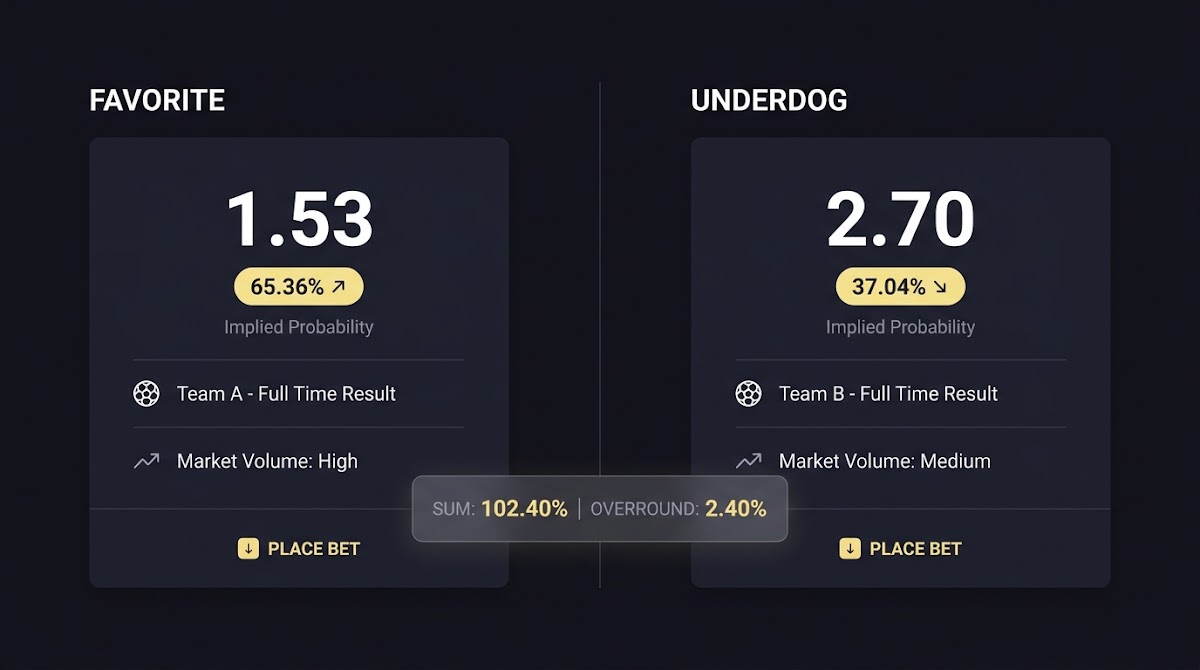
Overview: why favorite and underdog prices often differ
Bookmakers embed a margin into displayed odds so the implied probabilities sum to more than 100 percent, and that margin is not always split evenly across both sides of a market; this uneven uplift is a primary reason why favorite and underdog prices are not symmetrical, and understanding that mechanism is the first practical step for any shopper of lines Pinnacle betting resources.
Quick takeaway, in short: convert the quoted odds to implied probabilities, compute the market total and then normalize each side to remove the vig so you can see which side carries more uplift relative to a fair mirror image. Those steps let you separate operator margin from potential informational or behavioral mispricing Investopedia implied probability guide.
How this article will help you: you will get clear definitions, conversion formulas for American, decimal and fractional formats, a worked example that walks the math, and practical decision rules for whether an observed asymmetry should change your stake or your prediction approach Journal of Economic Perspectives summary of favorite longshot bias.
Run the quick odds diagnostic
Try the diagnostic workflow on one market you follow, using a quick odds conversion and the normalization step to see whether the favorite or the underdog carries the larger implicit uplift.
Why Favorite and Underdog Prices Are Not Symmetrical
The favorite longshot bias and operator margin allocation together explain recurring asymmetries; favorites are often adjusted differently from longshots because public demand and liability management make symmetric pricing unnecessary for profit preservation Journal of Economic Perspectives.
Definition and market context: what asymmetry means in betting prices
Overround and vigorish refer to the same practical reality: operators price a market so that implied probabilities sum to more than 100 percent, creating a built in margin between the true expected outcomes and the prices available to bettors Pinnacle betting resources.
Implied probability is the conversion of quoted odds into a percent chance that implies the market view; decimal, fractional and American formats each map to the same underlying probability if converted correctly, which makes cross operator comparison possible Investopedia implied probability guide.
When we say prices are asymmetric we mean the vig or uplift above fair probabilities is not shared equally by both sides, so a favorite might be adjusted down relative to its true chance while an underdog is adjusted up, producing non mirror image implied chances across the book Investopedia vigorish explanation.

Step 1: convert odds to implied probabilities (and a Question for readers)
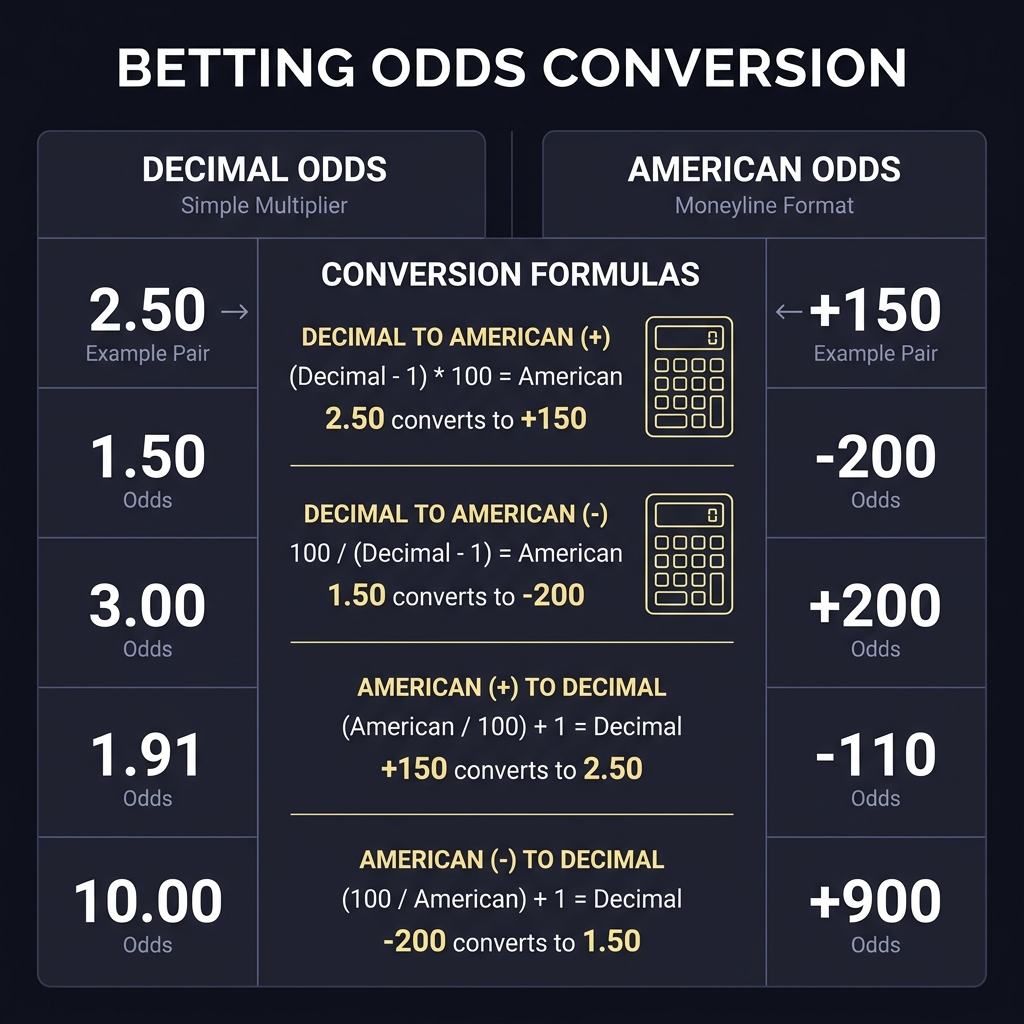
Conversion formulas are operator agnostic: for decimal odds, implied probability is 1 divided by the decimal odds; for fractional odds a b over c expression maps to decimal by adding 1 then using the decimal formula; for American odds the formulas differ by sign: positive American odds convert with 100 divided by (odds plus 100) and negative American odds convert with the absolute value divided by (absolute value plus 100). A compact reference helps avoid mistakes Investopedia implied probability guide and Smarkets guide to implied probability.
Worked examples make this concrete. Decimal 1.80 converts to 1 divided by 1.80 which gives 0.5556 or 55.56 percent implied probability. Fractional 4/1 equals decimal 5.00 so it maps to 20 percent implied probability. American +200 equals decimal 3.00 and maps to 33.33 percent implied probability while American -150 converts to 150 divided by 250 which is 60 percent implied probability Investopedia implied probability guide.
Favorites and underdogs differ because operators embed a margin and then allocate that margin unevenly based on demand and liability considerations, and behavioral patterns such as the favorite longshot bias further shape persistent skews.
Common pitfalls: display rounding by operators can hide small asymmetries, and converting American odds incorrectly by sign is a frequent error; always keep three or four decimal places in intermediate steps to avoid masking a market skew that matters at scale Investopedia implied probability guide.
Step 2: measure market overround and remove the vig
Compute the market total by summing each side's implied probability; a sum greater than 100 percent indicates the overround or vig. For a two way market the calculation is straightforward: implied probability of side A plus implied probability of side B equals market total, and that total minus 100 percent is the aggregated uplift captured by the operator Pinnacle betting resources.
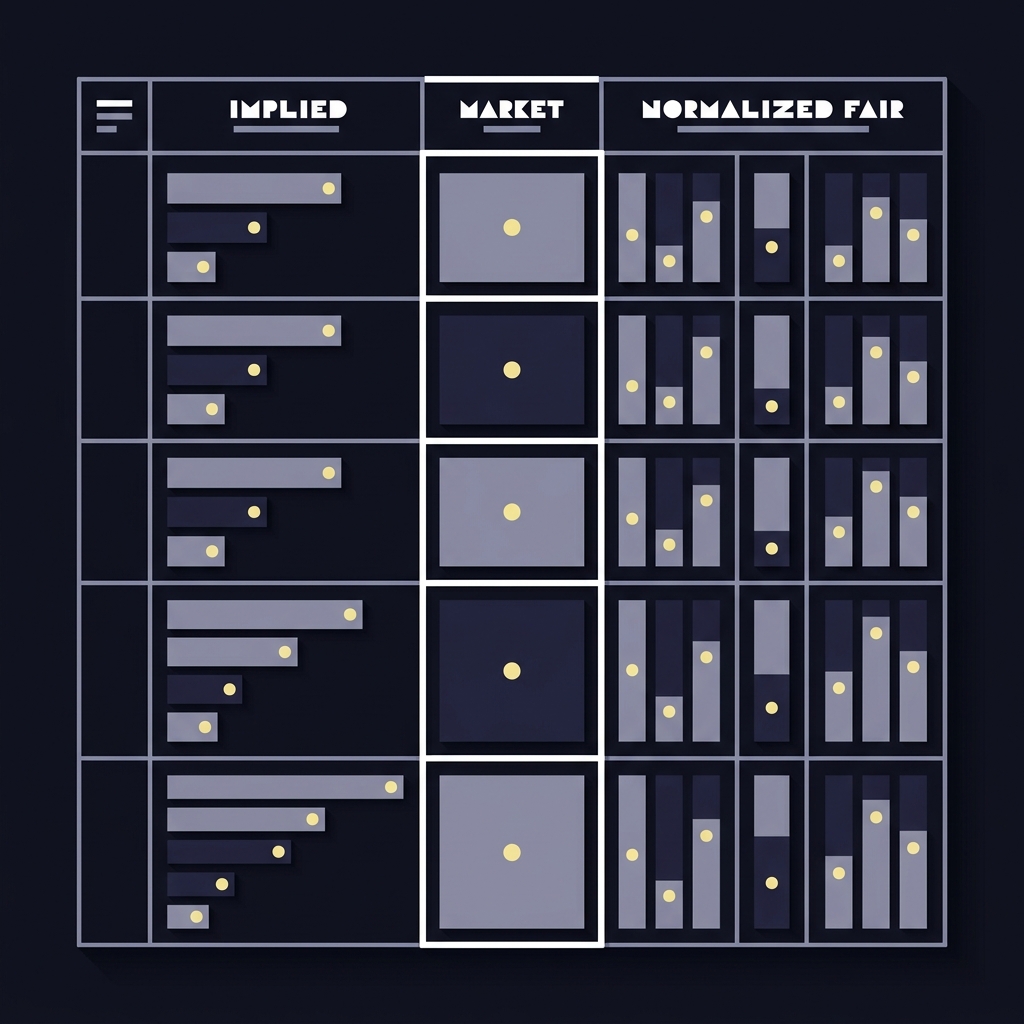
Normalization removes the vig: divide each implied probability by the market total to get the fair or normalized probability. For example if the two implied probabilities sum to 104 percent, dividing each by 1.04 rescales them to sum to 100 percent and reveals how the margin was allocated between sides Investopedia implied probability guide.
Once normalized you can compare the adjusted favorite and underdog probabilities to see which side was given the larger relative uplift; larger uplifts on the underdog are a common pattern and may indicate longshot overpricing or deliberate margin placement by the operator Pinnacle betting resources.
Why bookmakers produce asymmetric prices: margin allocation, demand and liability
Operators embed a margin because it ensures profit on average, but they do not have to split that margin evenly; instead they can skew prices toward the side where they expect aggregate money flow or where liability would otherwise concentrate, which produces asymmetric favorite and underdog prices Economic Journal discussion of bookmaker incentives.
Public demand patterns drive many of those choices. If large groups of bettors consistently back favorites or longshots, the operator may set prices to manage that predictable flow rather than to produce a mirror image market, and that behavior can lock in persistent asymmetries across similar contests Economic Journal.

Liability management is practical and risk oriented: moving a favorite price a little can reduce exposure on a likely outcome, while keeping a longshot price attractive can maintain volume. Those trade offs mean asymmetric allocation of the vig is often the rational operator response, not an accidental bias Pinnacle betting resources.
Evidence from markets: the favorite-longshot bias and what it implies
Empirical literature documents a persistent favorite longshot bias where longshots are typically overpriced and favorites underpriced relative to true probabilities; this pattern helps explain why adjusted, normalized prices often show systematic skew in favor of longshots Journal of Economic Perspectives.
Behavioral explanations include misperception of small probabilities and preference for large payoffs, which drive consistent demand for longshots and give operators an incentive to keep longshot prices attractive even though that allocation increases the implicit cost on other sides Journal of Economic Perspectives.
Market percentages, exchanges and liquidity signals (Tool placement)
Exchange markets report a market percentage that is closely related to overround but also reflects liquidity and traded volume; where exchanges show heavy traded volume on one side it signals where market pressure and implicit vig concentrate Smarkets help on overround and efficiency.
Using exchange data is useful because traded volume and available liquidity show which prices are real money prices and which are nominal operator quotes; that helps you understand whether an asymmetric uplift is actionable or simply a displayed sticker price with little volume behind it Smarkets help centre.
normalize implied probabilities and compute market percentage
use decimal odds for inputs
Practical signal rules of thumb include checking both market percentage and available matched volume; a high market percentage with low traded volume suggests operator sticker margin rather than a liquid skew, while a high percentage with heavy volume indicates market participants are accepting that uplift Smarkets help on market percentage.
Worked example: compute and compare adjusted probabilities for a sample match
Start with quoted decimal odds to keep the arithmetic compact. Suppose the favorite is 1.60 and the underdog is 2.40. Convert implied probabilities: favorite 1 divided by 1.60 equals 0.625 or 62.5 percent implied. Underdog 1 divided by 2.40 equals 0.4167 or 41.67 percent implied; sum those to compute market total Investopedia implied probability guide.
Market total equals 104.17 percent in this example, so the overround is 4.17 percentage points. Normalize each side by dividing by 1.0417: favorite normalized probability equals 62.5 divided by 1.0417 which yields about 60.0 percent, while the underdog normalized probability equals 41.67 divided by 1.0417 which yields about 40.0 percent. The normalization shows the favorite lost about 2.5 percentage points to the vig while the underdog gained nearly the same proportionate uplift Pinnacle betting resources.
Interpretation: the normalized probabilities add to 100 percent and make clear where the implicit cost sits. In this case the underdog carries more of the proportional uplift relative to a symmetric fair market, which could be the product of public demand, a deliberate pricing heuristic or both Pinnacle betting resources.
Decision criteria: when asymmetric pricing should change your approach
Assess significance by comparing the observed skew to typical operator margins; a small asymmetry inside the range of normal overround is often not actionable for disciplined size adjustments, while larger skews relative to the operator's usual margin warrant a conservative response Pinnacle betting resources.
Context matters: event liquidity, how mature the market is, recent news driven line movement and your own edge estimate should determine whether you reduce stake, pass on the market or proceed with a small adjusted stake. Treat asymmetric pricing as a signal, not a guarantee of mispricing Economic Journal.
Common mistakes and traps when diagnosing asymmetry
A leading mistake is using un normalized implied probabilities to judge fairness; because every operator shows a built in margin, raw implied probabilities overstate the cost on both sides unless you remove the vig first Investopedia implied probability guide.
Other traps include taking single market snapshots as definitive and ignoring liquidity or recent matched volume; line drift often contains information and comparing a snapshot to the market path can reveal whether an unusual skew is persistent or transient Pinnacle betting resources.
Quick checklist and lightweight tools for everyday use
Three minute pre bet checklist: convert odds to implied probability, compute market total, normalize probabilities, compare which side saw more uplift, check exchange market percentage and matched volume, then decide stance and stake size Smarkets help on overround.
Bookmark operator and exchange help pages that show how to compute overround and market percentage and keep a simple calculator template to speed repeated checks Pinnacle betting resources.
Scenario analysis: interpreting specific skew patterns
When the favorite appears underpriced relative to normalized probabilities, possible causes include heavy public support for the underdog, an operator hedge, or new information that the market has not fully re weighted; check volume, market path and recent news before concluding a value opportunity Economic Journal.
When the longshot looks inflated after normalization the most plausible explanations are behavioral demand for large payoffs or a deliberate price that encourages volume while shifting margin onto other sides; in both cases treat the pattern as a signal to verify liquidity and your edge with simulated tests before adjusting real stakes Journal of Economic Perspectives.
Using asymmetry responsibly: strategy and bankroll principles
Apply conservative adjustments to stake sizing when asymmetry is material rather than chasing small perceived edges; scale reductions preserve long term discipline and reduce the risk of over reacting to transient skews Pinnacle betting resources.
Test any rules with simulated funds or a funded simulation environment before applying them to real capital; using a funded simulation environment helps you see whether normalization based rules improve net performance without risking real cash Journal of Economic Perspectives.
Conclusion: key takeaways and next steps
Recap the diagnostic workflow: convert odds to implied probabilities, sum to find market total, normalize to remove the vig and then compare adjusted probabilities to see where the uplift sits. That workflow isolates operator margin from potential informational edges and tells you whether an asymmetry is structural or market driven Investopedia implied probability guide.
Asymmetric pricing arises from a mix of operator margin allocation, liability management and behavioral demand that includes the favorite longshot bias; use exchange liquidity signals and simple normalization tools to make objective pre bet checks and always test rules in simulation before real application Journal of Economic Perspectives.
Convert each quoted odd to implied probability, sum probabilities to get market total, then divide each implied probability by the market total to normalize and remove the margin.
No. Skew often reflects demand, liquidity or liability management rather than a pricing error, so check volume and recent line movement before assuming a mispriced market.
Yes. Exchange market percentage and matched volume show where real money is trading and can indicate whether an observed uplift is actionable or simply a sticker price.