
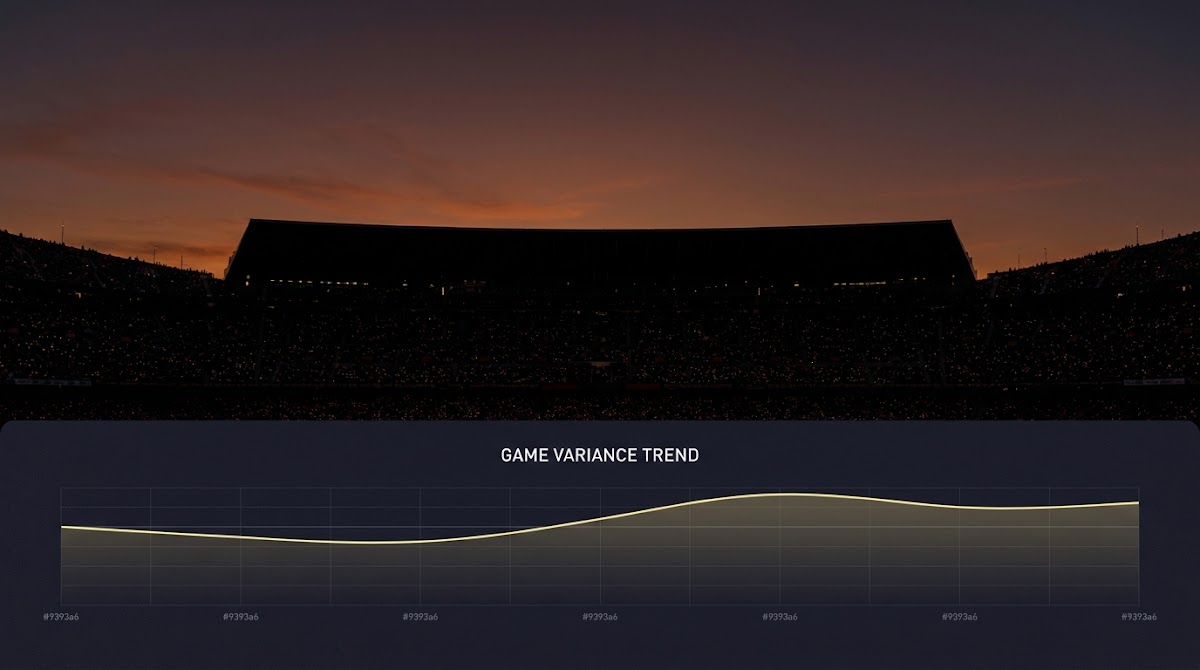
What we mean by day-to-day variance in baseball
Day-to-day variance describes how a single game outcome can differ sharply from a team’s longer-term ability. In plain terms it is the gap between what one game shows and what a season-sized sample would reveal, and it is driven largely by baseball’s low overall scoring where single events carry outsize weight. Analysts rely on stabilization ideas to avoid overreacting to a short run of results, because a handful of games usually does not shift the underlying signal enough to justify big belief updates Stabilization of Statistics and Sample Size
Because baseball is low-scoring and contextual factors like park effects, weather, pitcher matchups, and small samples amplify randomness; single-game swings often reflect noise rather than a durable change.
That difference matters for fans, commentators, and anyone evaluating performance challenges: a surprise loss or an unexpected hitting streak is often noise rather than a durable change in team quality. Treating one game as definitive ignores the statistical reality that low-run sports amplify randomness, which is why conservative priors and clear stabilization thresholds are common practice among experienced analysts Stabilization of Statistics and Sample Size
High-level drivers: How small samples, parks, weather and matchups combine
Several measurable contributors explain why single MLB games swing more than season trends imply: small-sample randomness, park factors, weather and altitude effects, starting-pitcher dynamics including times-through-the-order patterns, and daily platoon matchups. These components do not act in isolation; they interact in ways that can amplify game-to-game movement and change the expected variance of a matchup Park Adjustments
For modelers the practical implication is that combining these adjustments tends to outperform naive point-process assumptions because pooled effects explain observed overdispersion in run scoring, and recognizing interaction terms helps set realistic uncertainty bands for a single game Stabilization of Statistics and Sample Size

Small-sample statistics: why single games can be misleading
In baseball a single game is a very small sample relative to the season, so random variation in a few plate appearances can create large deviations from a team’s true underlying level. Because runs are relatively rare compared with higher-scoring sports, a single extra home run or a couple of well-timed hits can tilt a result, and the right response is usually to treat that outcome as low-confidence evidence until a larger sample forms Stabilization of Statistics and Sample Size
The practical rule of thumb for most analysts is to use conservative priors and stabilization thresholds: wait for enough opportunities before allowing short-term volatility to change a model’s mean estimate substantially. That might mean requiring several dozen plate appearances or more for a hitter split to be considered reliable, or applying shrinkage to short-window rates to reflect the underlying uncertainty Stabilization of Statistics and Sample Size
Practice forecasting with structured evaluation
Test forecasting approaches within structured evaluation challenges and virtual funded accounts to see how conservative priors and stabilization change realized outcomes without risking real funds.
Parks, humidors and environment: why venue still moves the needle
Park factors quantify how much a venue changes run scoring relative to a neutral baseline, capturing traits like fence dimensions, prevailing wind patterns, and surface characteristics; these differences persist even after league-wide interventions because ballparks remain physically distinct environments Park Adjustments
MLB’s 2022 decision to require humidors at all parks standardized one important element of the batted-ball environment but did not eliminate venue-specific effects; recent park-factor leaderboards continue to show material differences from park to park that affect home-run rates and run scoring and therefore single-game variance MLB to use humidors at all 30 ballparks in 2022 SABR analysis
When a matchup happens in a hitter-friendly park or at a high-altitude site, expectations should widen: a park that increases carry or favors hitters makes upsets more likely in any one game, and modelers should prefer up-to-date park-factor tables rather than assuming a neutral venue Park Factors Leaderboard (2024)
Starting pitching, TTO and bullpen usage: intra-game variance drivers
The times-through-the-order penalty is a robust, documented phenomenon where a starting pitcher’s run prevention typically weakens each time a batting order cycles, and that pattern adds a predictable form of intra-game risk as the starter faces hitters multiple times Times Through the Order Penalty (TTOP)
Modern starter management, including earlier hooks and more frequent matchups with specialized relievers, shifts variance into the bullpen: when a team pulls a starter early, the matchup landscape becomes more dependent on reliever handedness, matchup history, and bullpen depth, which can increase volatility in the late innings Times Through the Order Penalty (TTOP)

To account for this in game-level forecasting, incorporate expected starter durability and an estimate of when the TTOP is likely to bite; if a model predicts a short outing for the starter, widen credible intervals and weight bullpen matchup priors more heavily in single-game projections Times Through the Order Penalty (TTOP)
Platoon matchups and lineup variability: predictable daily swings
Platoon splits arise because many hitters and pitchers perform differently against left and right opponents, so daily lineup choices and pinch-hitting decisions can produce measurable edges that change game-level expectations in predictable ways Platoon Splits and Matchups
Reliever handedness also matters late: a team that layers righty-heavy late innings into a contest with strong right-handed batters can reduce run-scoring risk, while the opposite alignment can amplify it; tracking announced lineups and recent bullpen usage helps capture those predictable daily swings Platoon Splits and Matchups
Models that capture overdispersion: going beyond Poisson
Simple Poisson models assume variance equals the mean and therefore often understate the observed dispersion in MLB run scoring. Empirically, run counts exhibit overdispersion relative to Poisson, so negative binomial or other flexible distributions provide a better fit and produce more realistic prediction intervals Park Adjustments
Beyond distributional choice, combining park adjustments, platoon splits, and TTOP effects inside hierarchical or ensemble frameworks helps explain more variance than any isolated tweak. Hierarchical priors let team- and player-level rates borrow strength from season context while properly widening single-game credible intervals to reflect small-sample uncertainty Stabilization of Statistics and Sample Size
Quick conceptual calculator to set a conservative game-level variance multiplier
Practical model choices include fitting a negative binomial for runs with covariates for park, handedness matchups, and expected times-through-the-order exposure, or using ensembles that average a structural model with a smoothed historical distribution; the key is to report wider intervals for one-off games to avoid overconfident calls Park Adjustments
What variance means for single-game decision criteria

When deciding whether a short streak or an upset is meaningful, apply a signal-to-noise filter: ask whether the observed change exceeds what a conservatively shrunk estimate would expect, and use credible intervals to quantify how plausible a durable shift is. In many cases a small run of results falls well within the expected noise band and should not prompt major strategy changes Stabilization of Statistics and Sample Size
Park and matchup context should alter confidence: a surprising result in a hitter-friendly park with favorable platoon alignment is less informative about season-level talent than the same result in a pitcher-friendly contest, so always condition your belief updates on venue and announced lineups Park Factors Leaderboard (2024)
Common mistakes: where analysts and fans overreact
A common error is overfitting to short runs-reacting to a handful of games by changing long-term ratings or abandoning a tested approach. This chasing behavior confuses noise for signal and often reduces out-of-sample performance rather than improving it Stabilization of Statistics and Sample Size
Another frequent omission is ignoring park and weather context: treating every home run or rally as equivalent without conditioning on venue or atmospheric effects leads to miscalibrated forecasts. Use recent park-factor tables rather than assuming neutral conditions if you want to avoid this mistake Park Factors Leaderboard (2024)
Practical examples: two game scenarios and how to model them
Scenario A: underdog upset in a hitter-friendly park. If a lower-rated offense faces a favorable park and warm, wind-aided conditions, the single-game upset probability increases relative to a neutral site. A modeler should therefore apply a park-adjusted baseline to both teams and widen the credible interval to reflect the added environmental variance, citing the park-factor leaderboard for the venue’s recent behavior Park Factors Leaderboard (2024)

Scenario B: a strong starter is knocked out early. When a starter exits before facing the lineup multiple times, the contest becomes dependent on bullpen depth and platoon matchups. In that situation shift weight to reliever splits and recent usage patterns, and expand uncertainty bands to reflect the increased possibility of volatile late-inning outcomes Times Through the Order Penalty (TTOP)
In both scenarios, the recommended reporting style is to present a central estimate alongside a clearly labeled credibility range and a short note explaining which contextual inputs drove the widening; that transparency helps non-technical users understand why a single-game projection differs from season expectations Stabilization of Statistics and Sample Size
How this matters if you test strategies on funded challenge platforms
High single-game variance is precisely why structured evaluation platforms favor consistency and clear rules: a platform that assesses performance across many simulated opportunities will better reward a genuine predictive edge than any single one-off result, because the evaluation horizon filters noise from durable skill Stabilization of Statistics and Sample Size
FundedPlays is an example of a skill-focused challenge platform where participants can practice disciplined forecasting within virtual funded account frameworks and transparent evaluation rules; using such structured challenges lets users see how conservative priors and stabilization affect long-run performance without implying earnings guarantees Stabilization of Statistics and Sample Size
Data sources and monitoring: what to check before a game
Before setting a confident one-off forecast, check a few core inputs: the latest park-factor leaderboards for venue adjustments, weather forecasts and wind direction for carry estimates, and announced lineups with bullpen availability notes; these inputs materially change the expected variance for a matchup Park Factors Leaderboard (2024)
Remember that the 2022 humidor rollout reduced some systematic ball carry variation, but up-to-date park-factor tables still matter because parks differ on more dimensions than just humidity. Incorporate these inputs before narrowing credible intervals for a single-game call MLB to use humidors at all 30 ballparks in 2022
Quick checklist for modelers and active fans
Five things to do before adjusting beliefs about a team: check sample size for the signal, apply a park factor, adjust for platoon splits, consider expected starter durability and the times-through-the-order effect, and widen credible intervals for one-off games. Communicate uncertainty clearly to avoid overconfident claims Park Adjustments
When reporting to non-technical audiences, use plain language like "Moderate confidence: wide range expected due to venue and lineup changes" and avoid definitive statements after small samples. That phrasing helps keep expectations calibrated and reduces the tendency to chase short-term noise Stabilization of Statistics and Sample Size
Conclusion: sensible takeaways and next steps
Baseball’s low-scoring nature, combined with park-specific environments, pitcher usage patterns, and platoon matchups, explains much of the high day-to-day variance in single games. Modelers who combine park, platoon, TTOP, and stabilization approaches will set more realistic uncertainty bands and avoid overreacting to short runs Park Adjustments
Next steps for readers: review the referenced methodological pages for implementation details, practice conservative priors in structured evaluation settings, and monitor updated park and weather inputs before tightening single-game forecasts. Continued learning and disciplined testing are the most reliable routes to better calibrated predictions Stabilization of Statistics and Sample Size
Further reading and references
The primary sources used here include overviews of the times-through-the-order penalty, park adjustments, the MLB humidor rollout and recent park-factor leaderboards, platoon split explanations, and sample-size stabilization guides; each provides methodological detail for modelers wanting to dig deeper Times Through the Order Penalty (TTOP)
Open questions remain, such as refining how weather and humidor effects interact in real time and measuring the long-term effect of evolving bullpen strategies on game-level variance; readers interested in methodology should consult the listed sources and recent leaderboards for updates Park Factors Leaderboard (2024)
Stabilization times vary by metric, but most analysts apply conservative thresholds and shrink short-window rates until a larger sample of plate appearances or innings accumulates.
The humidor reduced some ball-carry variability, but significant park-to-park differences remain and should be accounted for with current park-factor tables.
Announced lineups are useful context for daily adjustments but should be combined with park, weather, and pitcher durability information before changing long-term beliefs.
References
- https://library.fangraphs.com/principles/sample-size/
- https://library.fangraphs.com/principles/park-adjustments/
- https://www.mlb.com/news/mlb-to-use-humidors-at-all-parks-in-2022
- https://baseballsavant.mlb.com/leaderboard/park-factors?year=2024
- https://library.fangraphs.com/pitching/times-through-the-order/
- https://www.fundedplays.com/challenges
- https://library.fangraphs.com/principles/splits/
- https://evanalytics.com/mlb/research/park-factors
- https://www.mlb.com/news/park-factors-measured-by-statcast
- https://sabr.org/journal/article/into-thin-air-whats-all-the-fuss-about-coors-field/
- https://www.fundedplays.com/blogs
- https://www.fundedplays.com/blogs/how-fundedplays-evaluations-work
- https://www.fundedplays.com