
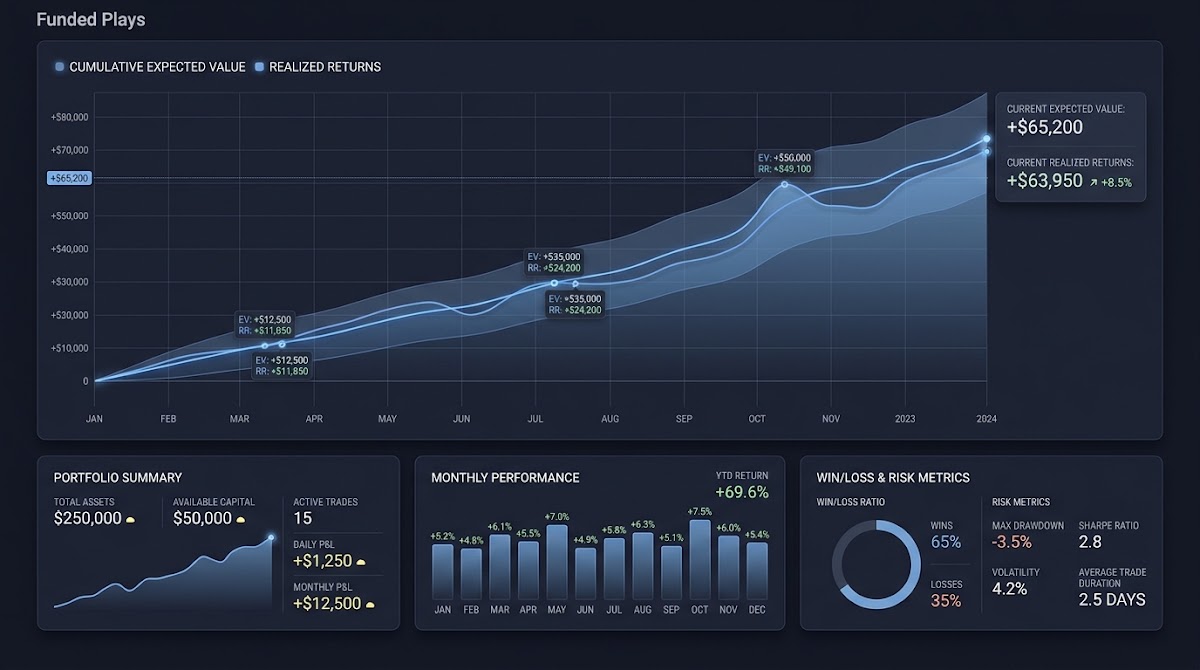
What sports trading variance means and why it matters
A plain-language definition
The phrase "What Is Sports Trading Variance" is about the same idea statisticians call variance: the amount that short- and medium-term results spread out around their expected value. In sports trading, every pick has an expected value based on an estimated probability and the offered odds; variance explains why a player who actually has an edge can see long winning and losing stretches before their long-run results converge toward that expectation, especially when sample sizes are small. This basic definition follows standard explanations of statistical dispersion and helps set expectations for what to track when testing a strategy Investopedia variance definition
For someone building a prediction record or completing a funded challenge, variance matters because short samples can produce large realized swings that do not necessarily disprove a genuine edge. In a simulated or evaluation environment, platform rules often set drawdown limits and other controls that interact with natural variance, so understanding dispersion is necessary to choose stake sizes, monitoring windows, and sensible stop rules Investopedia standard deviation

Think of variance as the noise around your expectation: every selection contributes an expected return and a distribution of possible outcomes. When you combine many selections, the central limit idea means results should tighten with larger samples, but that convergence can take far more events than most participants expect. That gap between expectation and realized returns is why careful forecasters treat short losing runs as information to diagnose model or sizing issues, not as an immediate proof that the method is broken.
Put simply, sports trading variance is the natural random fluctuation in returns around their mean given your probabilities and stakes. It causes streaks and drawdowns in funded accounts and simulated bankrolls even when the strategy has positive expected value, and it scales with wager size and event odds.
compute single-bet Kelly fraction from probability and odds
Use conservative fractional Kelly by multiplying result by less than 1
The practical implication for funded challenge participants is straightforward: strict rules around drawdown and daily limits can interact with normal variance to eliminate traders who are merely unlucky. That is why challenge-style platforms and evaluation programs typically prefer policies that balance skill assessment with realistic variance allowances, and why participants should design sizing rules and timelines that respect expected dispersion. See our guide on how Funded Plays evaluations work. Investopedia variance definition
How to measure variance: expected value, standard deviation and drawdown
Computing expected value per selection
Expected value for a single selection is the starting point for any variance analysis. Compute it by multiplying your estimated probability of success by the net payoff and subtracting the complementary loss. For a simple decimal-odds example: EV = p*(odds - 1) - (1 - p), which reports the average net return per unit staked if the probability p is accurate. Framing every pick this way converts your forecasts into a series of expected returns you can sum over time to form a long-run baseline for comparison. You can also try an expected value and standard deviation calculator to work through examples. expected value and standard deviation calculator
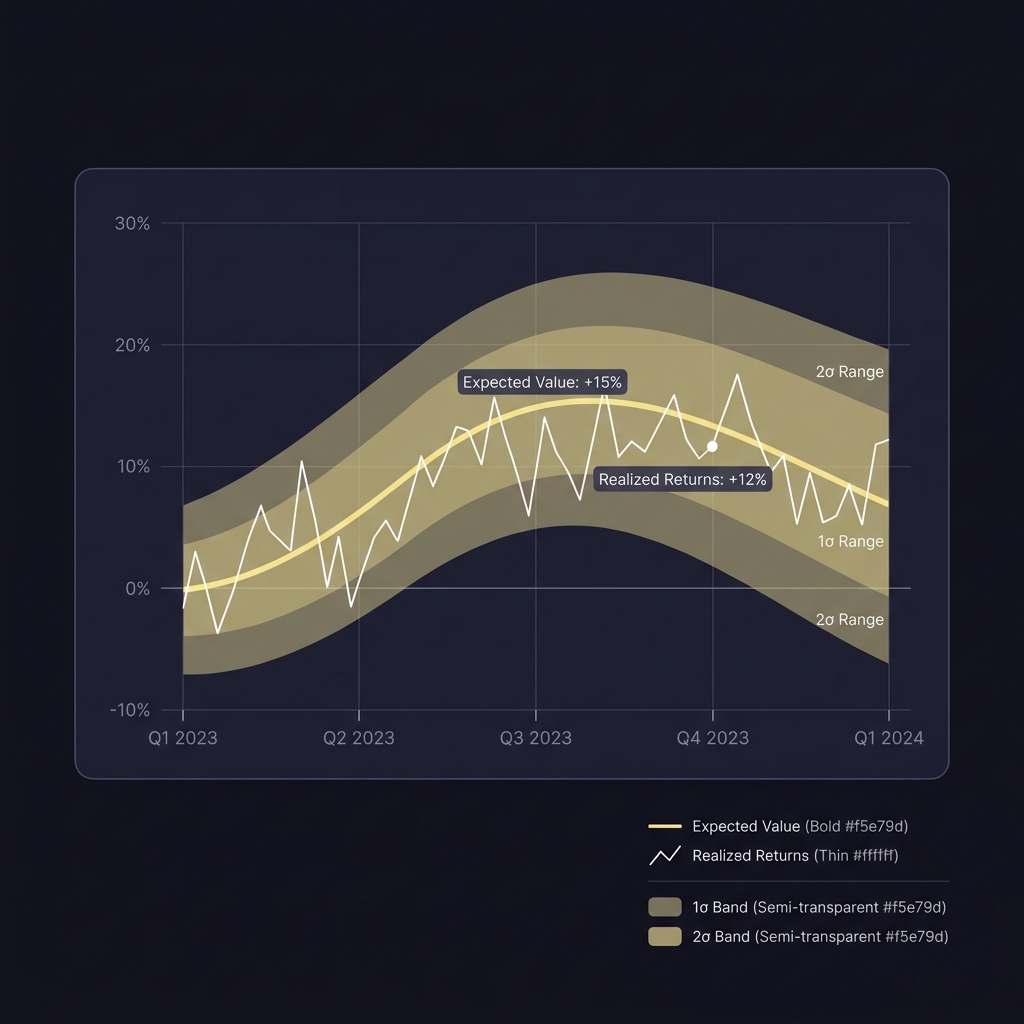
Use the per-pick expected value to create a cumulative expected-return curve across events. That curve is the comparator for your realized cumulative returns; if realized results consistently fall below cumulative expected value beyond plausible random variation, it is a sign to re-examine probability estimates or market conditions.
Standard deviation of returns and rolling-window analysis
Standard deviation quantifies the typical size of swings around the mean and remains the primary metric for measuring how volatile a returns series is. Calculate the standard deviation of individual bet returns or of net returns per unit of bankroll across a sample. For practitioners it is often helpful to compute rolling-window standard deviations (for example, 30- or 90-event windows) to see how volatility changes over time rather than relying on a single global estimate Investopedia standard deviation. Try a standard deviation calculator to check computations. standard deviation calculator
A practical step-by-step approach: 1) convert each selection into a unit-return series using net return per stake; 2) choose a rolling window length that matches your operational rhythm; 3) compute the rolling mean and rolling standard deviation; 4) compare realized rolling outcomes to expected rolling outcomes to detect deviations. This method keeps the comparison time-consistent and helps identify periods where volatility or mean return differs from historical experience.
Tracking drawdowns and peak-to-trough metrics
Drawdown measures the fall from a historical peak in cumulative returns or bankroll to the next trough and is essential for operational risk control. Track both daily drawdowns and cumulative drawdowns versus peak equity. Record max drawdown over rolling windows to understand likely worst-case short- and medium-term declines, and use those numbers to set limits that match your risk tolerance and challenge rules.
Simple practice is to maintain a running peak-of-equity and compute current drawdown as (current equity - peak equity) / peak equity. Monitor the distribution of drawdowns across simulated paths so you can decide what maximum acceptable drawdown aligns with your objectives and the platform’s rules. That discipline lets you distinguish between expected temporary dips and structural issues in forecasting or sizing Investopedia variance definition
The Kelly framework: linking edge, odds and optimal stake size
What the Kelly criterion says and why it matters
The Kelly criterion provides a rule for the fraction of bankroll to wager that maximizes long-run growth when your edge and odds are known. The classical Kelly formula relates your estimated probability and the payoff multiple to an optimal fraction that, under ideal assumptions, produces the highest asymptotic growth of wealth. Understanding Kelly helps translate a numeric edge into a practical stake size rather than leaving sizing arbitrary Kelly Criterion: Definition
While Kelly is attractive mathematically, strict full Kelly stakes can create substantial volatility and large drawdowns in finite samples. That is an important practical caveat: the model assumes precise knowledge of edge and unlimited rebalancing time, conditions that rarely hold perfectly in real-world sports forecasting.
Short-term divergence is primarily due to statistical variance: randomness around expected value that produces streaks and drawdowns even when a strategy has a genuine edge.
Practical limits: fractional Kelly and estimation risk
Because estimated probabilities are noisy, most practitioners use fractional Kelly - staking a portion of the full Kelly suggestion - to reduce variance and the risk of ruin. Fractional Kelly lets you trade some long-run growth for materially lower chance of severe drawdowns, and it provides a buffer against overconfident edge estimates. Fractional sizes also make performance more palatable in evaluation settings where drawdown rules and time-limited tests are enforced The Kelly capital growth discussion
As a reflective prompt: consider how confident you are in your probability estimates and whether you can accept the deeper drawdowns full Kelly may produce. If you are uncertain, a smaller fraction preserves capital and gives you more information to improve your estimates over time.
Comparing realized performance to expected outcomes
Rolling-sample comparisons and hypothesis-style checks
A robust way to judge whether observed variation is normal is to compare cumulative realized returns to cumulative expected value over rolling samples. Compute the expected cumulative curve from per-pick EVs, then overlay realized outcomes and add bands based on rolling standard deviation. If realized outcomes stay within those bands, variance is likely explaining the difference; if outcomes fall persistently outside, it warrants recalibration of probabilities or search for structural model issues Investopedia variance definition
Step-by-step checklist: 1) build the per-pick EV series; 2) sum EV over your rolling window to get expected cumulative EV; 3) compute rolling standard deviation of returns to form confidence bands; 4) compare observed cumulative returns against those bands; 5) when observations repeatedly violate the bands, investigate model drift or market changes rather than assuming pure randomness.
When variation suggests model problems versus normal variance
Normal variance produces random up-and-down movements without a consistent pattern relative to expected value. In contrast, model problems often show systematic deviations such as persistent bias in one direction, unusual correlations across events, or changes in hit rate inconsistent with prior calibration. When you observe systematic gaps beyond what your confidence bands predict, treat the finding as a model-validation signal and update probability estimates or model inputs accordingly Kelly literature and model calibration
Remember that markets change. Even well-calibrated historical models can become less accurate if event conditions shift. Regular recalibration, out-of-sample testing, and conservative sizing reduce the chance that environment changes will surprise you with larger-than-expected variance.
Practical controls to manage variance and limit drawdowns
Stake sizing rules and fractional Kelly in practice
Fractional Kelly is the single most widely recommended practical control for reducing volatility while retaining a portion of optimal growth. By multiplying the full Kelly fraction by a constant (common choices are one-half or one-third), you reduce stake size, lower standard deviation of returns, and decrease the probability of ruin compared with full Kelly. This trade-off, well-documented in practical guides, makes fractional Kelly a pragmatic compromise for real-world forecasters Kelly Criterion: Definition. For trading applications see a standard deviation in trading guide. standard deviation in trading
Implementation steps: 1) estimate per-bet Kelly using your best probability and odds; 2) choose a conservative fraction (for example 0.25 to 0.5 of full Kelly) based on how strict challenge drawdowns are; 3) cap single-event stakes at a maximum percent of bankroll to avoid concentration; 4) reassess the fraction as your confidence in calibration improves. These steps give a reproducible sizing rule that is easier to audit and adjust than ad-hoc staking.
Behavioral and operational controls: daily limits and exposure caps
Beyond per-bet sizing, set operational limits that prevent clustered losses from overwhelming your account. Common controls include a max daily loss that pauses activity for the rest of the day, a cumulative drawdown threshold that triggers linear de-risking, and per-event exposure caps to avoid too much simultaneous correlated risk. These rules convert statistical risk tolerances into enforceable actions and help preserve capital while you gather more evidence about your edge Risk control guidance from Kelly literature
Practice controlled sizing and limits in simulated challenges
Try these controls first in a simulated environment and treat them as learning tools to refine sizing and drawdown thresholds without risking real capital.
Finally, use simulation to translate your edge and stake rules into realistic expectations for streaks and drawdowns. Running Monte Carlo paths with your hit rate and stake rules shows the distribution of likely outcomes and helps set limits that match your tolerance.
Common mistakes and how they increase variance or ruin chances
Overestimating edge and overbetting
One of the most damaging errors is overestimating your edge and then staking aggressively. Aggressive sizing not only increases average return volatility but also raises the probability of ruin, a clear result from foundational Kelly work. If your edge estimate is biased high, full Kelly will amplify that error and can lead to catastrophic drawdowns in finite samples The Kelly capital growth discussion
A practical fix is to explicitly document how you estimate edge, run backtests that measure calibration, and reduce stake fractions when out-of-sample evidence is weaker. Conservatism in sizing protects your ability to learn from more data.
Ignoring sample-size noise and chasing losses
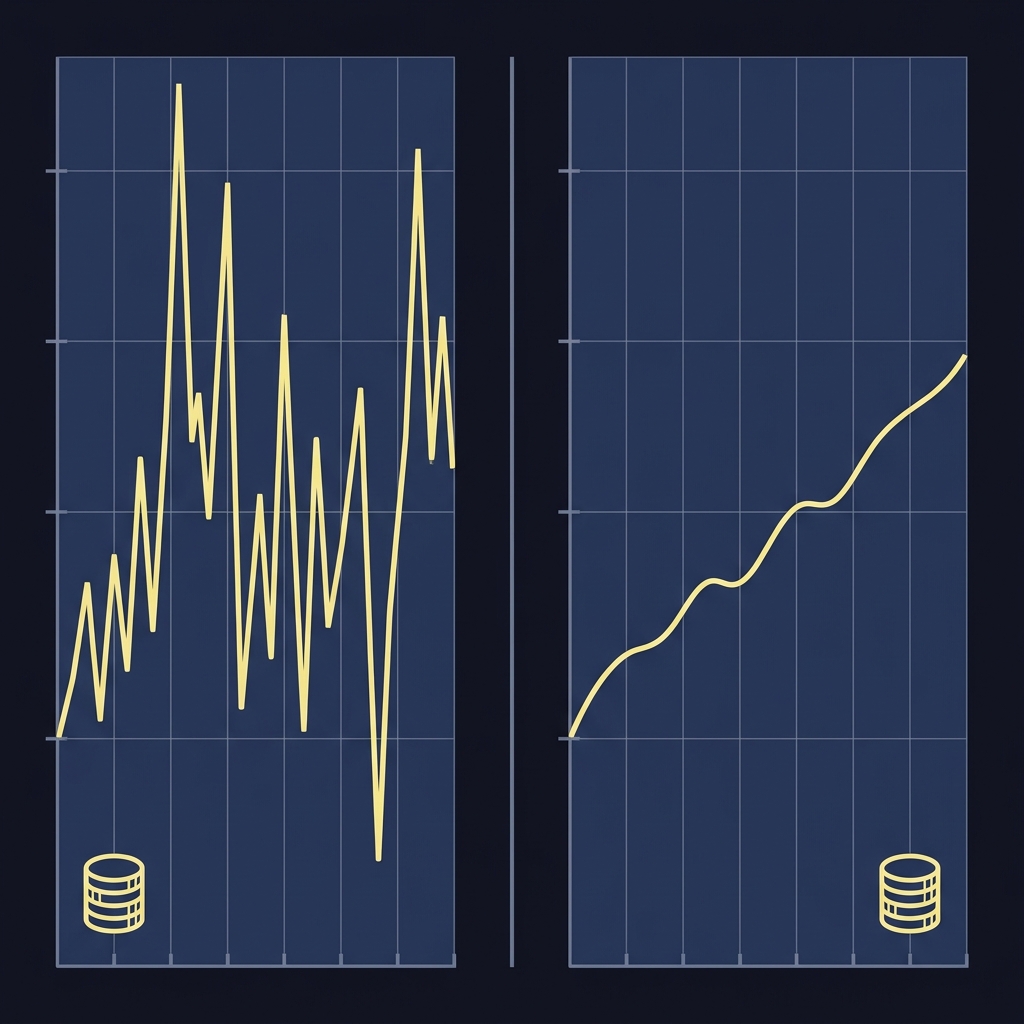
Confusing short-run loss with lack of edge is a behavioral trap. Chasing losses by increasing stakes after a drawdown typically amplifies variance and accelerates ruin. Instead, follow pre-defined rules for de-risking or pausing after significant losses and use those pauses to review whether the losing sequence is consistent with expected variance or indicative of a deeper problem Investopedia gambler's ruin
Maintain a disciplined journal and ruleset so emotional reactions do not drive staking changes. Routine checks and a documented decision process reduce the chance that psychological responses increase your long-term variance.
Not using simulations or limits
Neglecting simulation means you have poor intuition about streak lengths and worst-case drawdowns. Simulations reveal that even modest positive edges can generate long losing runs, and they quantify how different staking rules change drawdown profiles. Use scenario analysis to set realistic expectations and to choose rules that keep you inside allowable drawdown bands for your evaluation or funded challenge.
As a rule of thumb, small-sample noise should make you cautious about over-interpreting short losing runs. Instead, expand the evaluation window, reduce stake size to limit drawdown risk, and use simulation to estimate how many events you need before your expected edge manifests reliably under your chosen staking rule.
A staking scenario: full Kelly versus fractional Kelly comparison
Compare two paths starting from the same bankroll and edge: full Kelly stakes will produce higher average geometric growth over extremely long horizons if the edge estimate is exact, but they will also show deeper drawdowns and much greater short-term volatility. Fractional Kelly will grow more slowly in the theoretical limit but will typically avoid extreme drawdowns and give more stable performance in the finite-sample reality most forecasters face. That trade-off is why fractional Kelly is common in operational settings Kelly Criterion: Definition
Operationally, many practitioners use a conservative fraction and add caps on single-event exposure to limit concentration. Together these rules reduce variance relative to full Kelly while still using edge-based logic to size positions.

Using simulation to set realistic drawdown expectations
To run a simple simulation: specify your hit rate, average payout per win, stake rule, and number of trials; then simulate thousands of paths to estimate the distribution of peak-to-trough drawdowns and endpoint returns. The output shows typical, optimistic, and pessimistic outcomes and helps you set a max drawdown consistent with your tolerance and any platform rules.
Using simulations this way converts abstract risk measures into operational thresholds you can apply to funded evaluations or practice accounts. Simulations do not remove uncertainty, but they provide a clearer map of what outcomes are plausible under your assumptions and sizing rule.
Key takeaways and next steps
Summarize core concepts
Variance is the expected dispersion around an expected value and explains why short-run performance can diverge widely from a forecaster's true edge. Measure it with per-pick expected value, rolling-window standard deviation, and drawdown tracking so you can compare realized outcomes to reasonable confidence bands rather than reacting to every losing streak Investopedia variance definition
Practical next steps for disciplined forecasting
Next steps: 1) compute per-bet EV and maintain a cumulative EV curve; 2) calculate rolling standard deviations and create confidence bands; 3) adopt fractional Kelly sizing and per-event caps; 4) set max daily and cumulative drawdown limits; 5) run simulations to translate assumptions into likely streaks and drawdowns. These steps emphasize disciplined sizing, routine calibration, and realistic expectations rather than promises of consistent short-term profit Kelly Criterion: Definition
Remember that no approach eliminates variance. The goal of these controls is to manage volatility and preserve the ability to continue gathering evidence about your edge so you can learn and improve over time. Maintaining a documented process and conservative sizing increases your chance of demonstrating skill within structured evaluation programs and funded plays.
There is no fixed timeline; convergence depends on sample size, stake sizing, and variance. Use simulations and rolling checks to estimate how many events are likely needed for your strategy.
No. Full Kelly maximizes long-run growth under perfect knowledge but can cause large drawdowns; fractional Kelly is usually safer in practice.
No. Simulations cannot remove randomness but they quantify plausible streaks and drawdowns so you can set informed limits and expectations.
References
- https://www.investopedia.com/terms/v/variance.asp
- https://www.investopedia.com/terms/s/standarddeviation.asp
- https://stats.libretexts.org/Learning_Objects/02%3A_Interactive_Statistics/10%3A_Expected_Value_and_Standard_Deviation_Calculator
- https://www.calculator.net/standard-deviation-calculator.html
- https://blog.quantinsti.com/standard-deviation/
- https://link.springer.com/book/10.1007/978-3-642-27428-7
- https://www.investopedia.com/terms/k/kellycriterion.asp
- https://www.investopedia.com/terms/g/gamblers-ruin.asp
- https://www.fundedplays.com/challenges
- https://www.fundedplays.com/blogs/how-fundedplays-evaluations-work
- https://www.fundedplays.com/blogs
- https://www.fundedplays.com