
Why a weekly review matters for sports traders
Weekly Review Template for Sports Traders
A weekly review is a short, scheduled examination of your prior seven days of sports prediction activity that highlights outcomes, sizing, and process adherence. For sports traders and analytics users it is a tool to convert raw results into actionable changes rather than a promise of better returns.
Done consistently, a weekly review enforces record keeping and budgeting discipline and helps you spot recurring behavior patterns that cause losses. Those practices are closely linked to recommended personal finance and spending tracking, which are useful for keeping discretionary prediction activity within planned limits, and they support clear decisions during evaluation weeks Consumer Financial Protection Bureau guidance on tracking spending.
Think of the review as a routine: summarize performance, check core metrics, flag process deviations, and set a short list of experiments to try next week. It does not guarantee profits or remove variance, but it reduces variance-driven mistakes by making biases and rule breaks visible rather than letting them accumulate unnoticed.
To set expectations, this template focuses on a compact set of metrics you can compute from your trade log, practical sizing checks, and short action items. Use the review to improve discipline, maintain budget limits, and build a performance log you can examine monthly or quarterly to distinguish genuine edge from short-term luck.
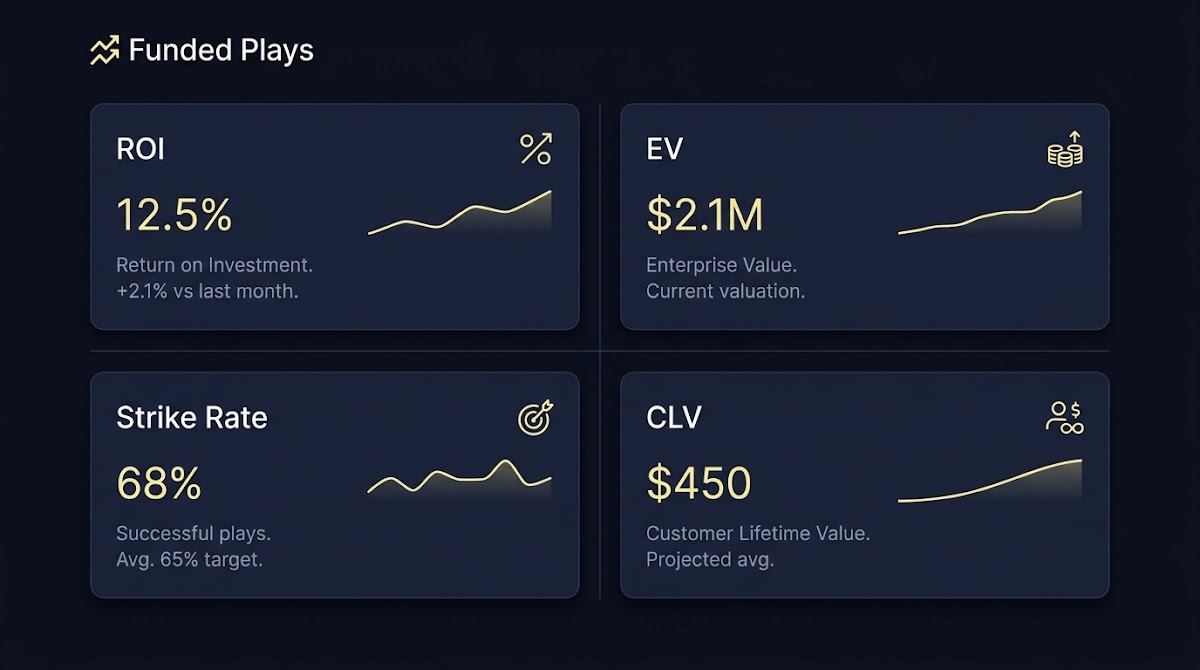
Core weekly metrics to include in your template
1) ROI, or return on investment, as the efficiency benchmark: net profit divided by total staked, useful for comparing how effectively you convert stakes into net returns. Include a clean definition of which stakes count and exclude voided or reversed events for consistency Investopedia on ROI.
2) Expected value (EV): a forward-looking aggregate of outcome payoffs weighted by your probability estimates, used to track whether your assessments imply a positive edge over the market Investopedia on expected value.
3) Strike rate, or win rate: the fraction of settled predictions that finished profitable. Strike rate alone can be noisy; it should be evaluated against binomial variance and rolling windows so you know when changes are meaningful NIST notes on the binomial distribution.

4) Closing Line Value (CLV): how often your placed prices beat the market closing price, which acts as a market-based proxy for pricing skill when collected consistently Pinnacle explanation of CLV.
5) Bankroll exposure and drawdown: simple stats that track peak-to-trough declines in your simulated or allocated funds and the share of bankroll at risk each day. Keep these in the same sheet as ROI so position effects are visible.
6) Process and compliance checks: checklist items such as whether you followed stake rules, applied pause rules, logged estimated probabilities, and aligned timestamps for CLV capture. These non-performance checks reduce behavioral drift and ensure your numbers remain meaningful.
Try the FundedPlays challenges page to learn about structured evaluation programs and how they use defined rules for consistent decision making
Copy this checklist into a weekly sheet, then run the computations listed below to generate the numbers you will discuss during the review.
Together these metrics show different facets of performance: ROI summarizes realized efficiency, EV captures your forecasted edge, strike rate and CLV give signal about your process and market pricing skill, and bankroll stats keep risk in view. Record each as a weekly snapshot so you can trace directional changes over time.
How to calculate and interpret ROI and EV
ROI is simple to define and important to compute consistently. Use these steps to calculate a reliable weekly ROI:
- Collect net results for all settled events during the review week, making sure to mark voids or refunded stakes separately.
- Compute net profit as the sum of all outcomes after fees and adjustments.
- Compute total staked as the sum of monetary amounts placed on settled events during the same period.
- Calculate ROI as net profit divided by total staked, expressed as a decimal or percentage.
A consistent ROI definition matters because including or excluding certain stakes changes the denominator and can mislead comparisons across weeks or strategies; keep a simple rule and apply it every review Investopedia on ROI.
Expected value (EV) complements ROI by focusing on whether your probability estimates plus stakes imply a positive long-term expectation. Compute weekly EV for your settled set like this:
- For each selection, record your estimated probability and the available payout odds or multiplier.
- Compute the payoff for each outcome if it wins and the loss if it loses.
- Multiply each outcome payoff by your estimated probability for that outcome, then sum those weighted payoffs across selections to get the aggregate EV.
Use EV to judge whether your process is correctly identifying opportunities even when realized outcomes are unfavorable. A positive EV with negative ROI suggests either variance is at work or that your probability estimates are optimistic; use confidence checks and further logs rather than changing sizing immediately Investopedia on expected value. See a framework for breaking down expected value here. See RebelBetting's explanation of expected value and variance here.
Evaluating strike rate with binomial variance and confidence intervals
Modeling wins and losses as a binomial process gives you a simple, testable framework for asking whether a measured strike rate is likely due to skill or just sampling noise. The binomial model treats each selection as an independent trial with probability p of success; variance follows the p(1-p)/n pattern and shrinks as sample size grows NIST on binomial variance.
A short weekly routine enforces consistent record keeping, forces you to compute core metrics, and converts observations into small, testable actions. By using metrics that account for variance and combining them with conservative sizing rules, the routine reduces reactive overtrading and helps separate noise from signal.
To test a weekly strike rate, compute the standard error as the square root of p(1-p)/n, where p is the observed strike rate and n is the number of settled bets. Form a simple confidence interval around the strike rate by adding and subtracting 1.96 times the standard error for an approximate 95 percent interval.
Interpretation guidance: if your observed strike rate falls well within the expected interval given prior performance and sample size, treat the result as likely noise. If it is consistently outside the interval over several weeks, that suggests a statistically notable shift worth investigating.

Practical actions depend on the test outcome. When weekly variation is within expected bounds, focus on process improvements rather than sizing changes. When results fall outside expected variation, review model inputs, market conditions, and execution timing to find a plausible cause before altering stake rules.
Position sizing and risk: applying Kelly and fractional Kelly
The Kelly criterion is a formula that indicates the theoretically optimal fraction of a bankroll to risk on a positive EV bet given the odds and your edge. It is a useful theoretical guide for translating an estimated edge into a stake-size suggestion Thorp discussion of the Kelly criterion.
Full Kelly maximizes long-term growth but amplifies volatility and drawdowns. For most sports traders, fractional Kelly is a practical compromise: apply a fraction of the Kelly suggestion, such as one quarter or one half, to reduce volatility while preserving the directional sizing benefit of edge-based staking.
Keep these caveats in mind. The Kelly fraction is highly sensitive to errors in your estimated probabilities and in quoted odds; overestimating edge produces overweighted stakes. Combine any Kelly-derived stake guidance with conservative stop rules, fixed bankroll limits, and an explicit maximum-per-event cap to control risk.
When you run your weekly review, include a sizing compliance check: compare realized stakes against the fractional Kelly guidance and flag deviations. If you find frequent over-risks relative to suggested sizing, treat that as a process failure and set a corrective action for the coming week.
Closing Line Value and how to use it as a skill proxy
Closing Line Value, or CLV, measures whether your placed prices beat the market closing price. Consistently posting better prices than the close is interpreted as a sign you are finding value relative to the market, and it works as a complementary indicator alongside ROI and EV Pinnacle on CLV. See a method to analyze bet quality using expected ROI here.
Record the price you placed and the market closing price in your log. Weekly CLV can be summarized as the fraction of selections where your placed price was superior to the close, plus a small average margin statistic when you beat it.

Limitations matter: CLV depends on market liquidity, timing of placement, and whether markets shift for reasons unrelated to your process. Treat CLV as a corroborating signal, not a standalone proof of skill, and check for systematic timing biases if your CLV swings dramatically week to week. Learn about how Funded Plays evaluations work here.
A step-by-step weekly review workflow and checklist
Prepare your data before you start the timed review. Cleanse your log by removing or marking voided events, align timestamps to a single timezone for CLV capture, and ensure estimated probabilities are present for each settled selection.
Suggested 30 to 60 minute reproducible checklist to run every week:
- Snapshot totals: total staked, number of settled events, net P&L, running ROI.
- Compute weekly EV and aggregate the sum of individual expected payoffs.
- Run strike-rate checks with binomial standard error and note whether the weekly strike rate is within expected bounds.
- Summarize CLV: count of selections that beat the close and average margin of beats.
- Check sizing compliance against your fractional Kelly rule and note any over-risks.
- Update bankroll drawdown and exposure statistics for the week.
- Log process deviations and tag probable causes, such as late entries, mismatched odds, or rule breaches.
- Create 2 to 3 action items for the coming week: e.g., reduce max stake by X percent, run a probability calibration exercise, or pause new strategy trials while focusing on existing setups.
For data hygiene and spending context, routine tracking is closely related to general budgeting practices. Keeping a running log and brief weekly notes makes it easier to spot creeping stake inflation or hobby spending that exceeds your planned limits Consumer Financial Protection Bureau guidance on tracking spending.
When you complete the checklist, record two simple outcomes: one procedural change and one measurable metric goal for next week, for example a maximum stake cap or a target range for weekly ROI volatility.
Tools, templates and the single spreadsheet layout to speed analysis
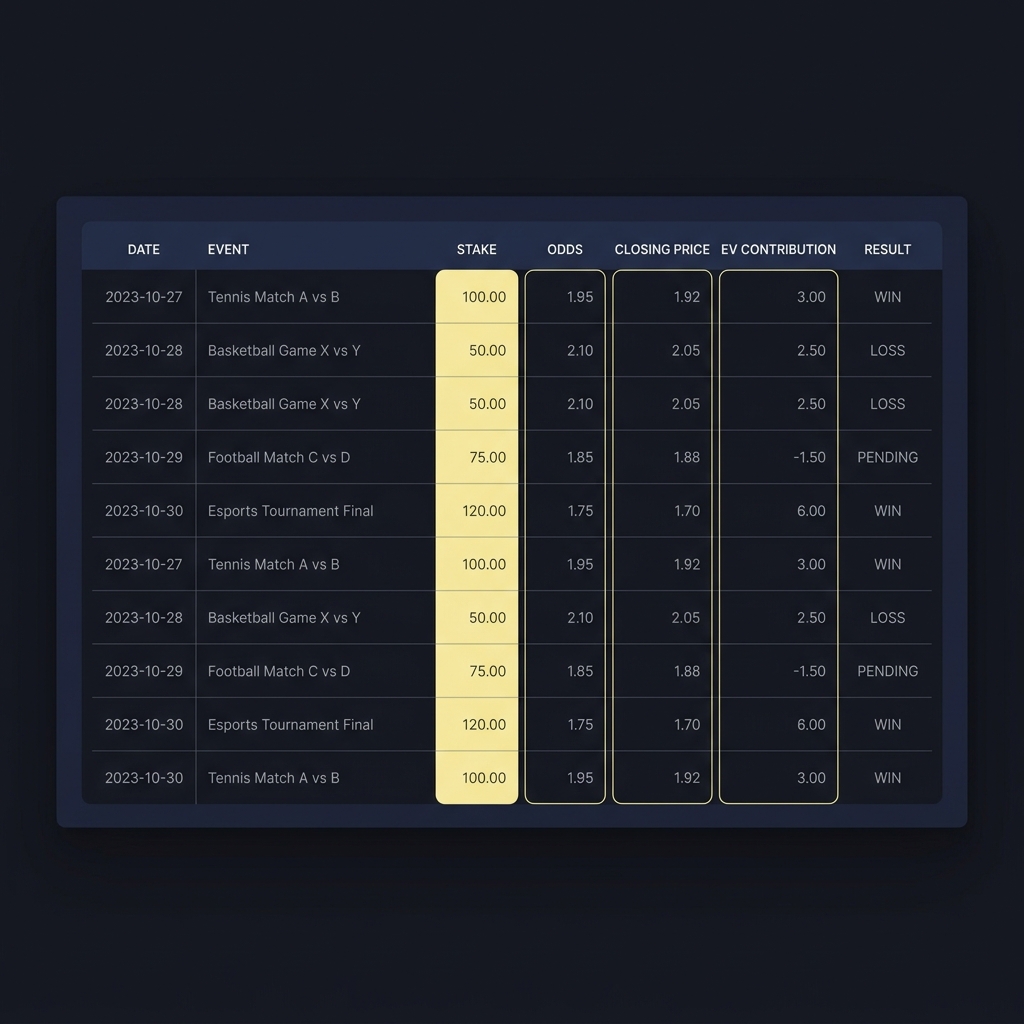
A single-sheet layout can store raw events plus derived fields that let you run the weekly computations quickly. Recommended columns include event id, date/time, market, stake, odds, placed price, closing price, result, net P&L, estimated probability, EV contribution, and running ROI.
Derived fields to add: cumulative ROI, weekly EV totals, strike-rate rolling windows, standard error and the 95 percent confidence interval, CLV beat flag, and peak-to-trough drawdown. These allow one-click snapshots for each weekly review and make your logs export-friendly for monthly summaries. See our blog.
weekly review single-sheet layout
keep timestamps consistent
Automation tips: timestamp settled results automatically where possible, use formulas for standard error and EV contribution, and export a weekly CSV snapshot to a dated folder for long-term trend analysis. Simple scripts or spreadsheet macros can generate the weekly snapshot in under a minute once the sheet is maintained.
Common mistakes and how to avoid them
Overreacting to a single-week sample is one of the most frequent errors. Given binomial variance and small samples, weekly strike-rate swings are often noise; guard against habitually changing sizing or strategy based on one-week outcomes NIST on interpreting binomial variation.
Another mistake is using full Kelly without accounting for estimation error. Because the Kelly suggestion scales with your perceived edge, overconfidence in probability estimates can create oversized stakes and unacceptable drawdowns; fractional Kelly reduces that sensitivity and smooths the ride Thorp on Kelly tradeoffs.
Relying on a single metric such as ROI or CLV is risky. Each metric reveals part of the picture: ROI shows past efficiency, EV and CLV show process and market signals, and strike-rate tests indicate sample stability. Combine them to reduce the chance of misreading a transient result Pinnacle on CLV limitations.
Putting it together: a simple weekly review plan and next steps
Each week, compute the core numbers, run the binomial strike-rate check, review CLV and sizing compliance, and write three concise notes: what went well, what went wrong, and one experiment or rule change to try next week. This reproducible plan converts review findings into concrete actions. Visit the Funded Plays homepage.
Track trends monthly and quarterly to separate skill from variance. Weekly signals are valuable for process corrections, but use aggregated trend lines and rolling averages to decide on major sizing or strategy shifts.
Finally, remember to keep participation responsible. The template helps you limit exposure, enforce bankroll rules, and document behavior. Outcomes depend on your process, probability estimates, and adherence to rules, so use the weekly review to strengthen those elements rather than to chase short-term wins.
Run the review every seven days on a consistent day and time; consistency makes comparisons reliable and highlights process drift.
There is no fixed sample size; use binomial standard error and confidence intervals to judge whether observed changes exceed expected variance.
Full Kelly can be extremely volatile; most traders use a fractional Kelly to reduce drawdowns and sensitivity to estimation errors.
References
- https://www.consumerfinance.gov/consumer-tools/budgeting/track-your-spending/
- https://www.investopedia.com/terms/r/returnoninvestment.asp
- https://www.investopedia.com/terms/e/expectedvalue.asp
- https://www.itl.nist.gov/div898/handbook/eda/section3/eda366h.htm
- https://www.pinnacle.com/en/betting-articles/educational/closing-line-value/8JE2J7ZH6FSR2K37
- https://papers.ssrn.com/sol3/papers.cfm?abstract_id=913259
- https://www.fundedplays.com/challenges
- https://plusevanalytics.wordpress.com/2021/07/19/how-winners-win-a-framework-for-breaking-down-expected-value/
- https://rebelbetting.com/faq/expected-value-and-variance
- https://unabated.com/articles/beyond-clv-analyze-bet-quality-using-expected-roi
- https://www.fundedplays.com
- https://www.fundedplays.com/blogs
- https://www.fundedplays.com/blogs/how-fundedplays-evaluations-work