
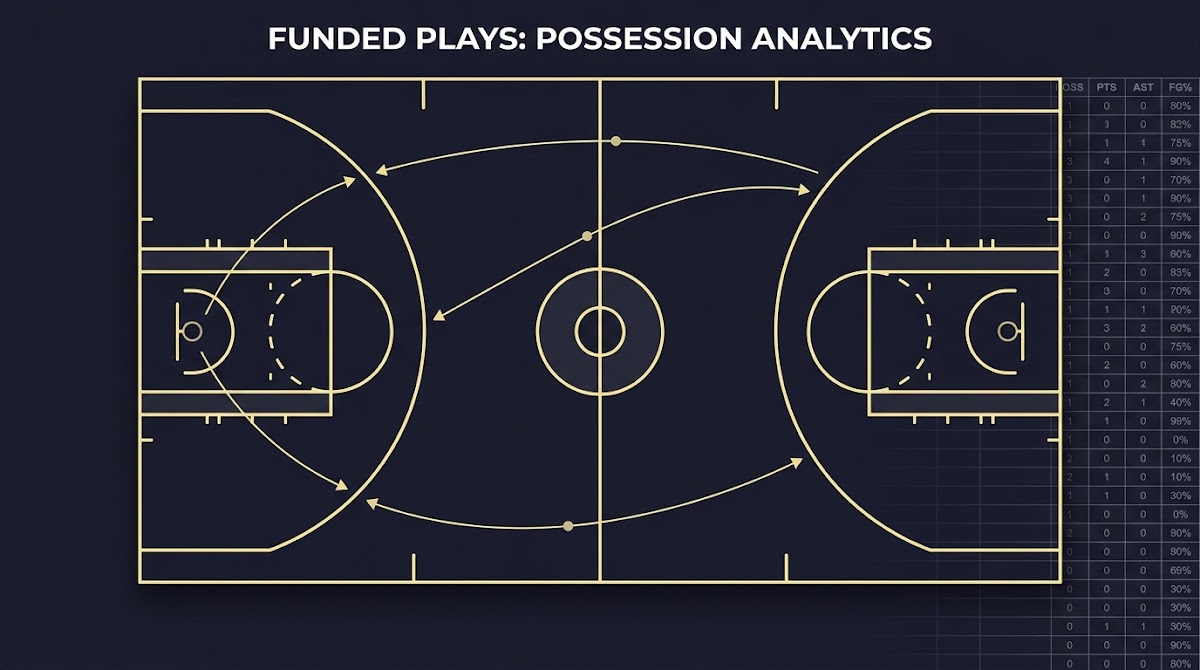
Quick summary and how to use this guide
What this article will teach you
Using Usage Rate in Basketball Props is a practical approach for translating a player's share of offensive responsibility into actionable pregame and live prop decisions. This section explains the guide structure, what you will learn, and how to use the worked examples to form repeatable rules.
The guide focuses on three things: how to compute usage from box-score inputs, how to adjust that number for context such as pace and lineup changes, and how to fold usage into a simple decision process that includes efficiency and minutes. It also points to quick checks you can run before game time and live signals to monitor during the contest.
Try structured challenge testing for disciplined strategy validation
If you want occasional practical notes and example checks sent to your inbox, sign up for a short newsletter that shares screening templates and decision checklists.
How to read the worked examples
Each worked example follows a consistent format: pregame inputs, adjusted usage calculation, projected counting stat, and a final decision with stake guidance. Read the example numbers and follow the short checklist to see how a single change in minutes or lineup can flip a pass into a bet.
Where to find the markers and tools
Markers appear in these sections: the calculator tool is embedded in the model section, the empty question marker indicates a common reader doubt in the calculation section, and the product example is placed in the context-adjustment section to illustrate testing in a challenge environment. The product link to the platform challenges page is included only once in the product marker block.
What player usage is and why it matters for props
Definition in plain language
Usage summarizes how often a player finishes offensive possessions while on the floor. It captures shots, turnovers, and trips to the free-throw line that end possessions, giving a sense of how many opportunities a player has to compile counting stats such as points, assists, and rebounds.
How usage summarizes offensive role
A higher usage percentage generally means a player is a primary option when their team has the ball, which often correlates with more shot attempts or assist opportunities. For prop categories tied to counting stats, usage is a direct signal of opportunity even before you consider whether the player is efficient when they receive those chances.
Limitations of usage as a single metric
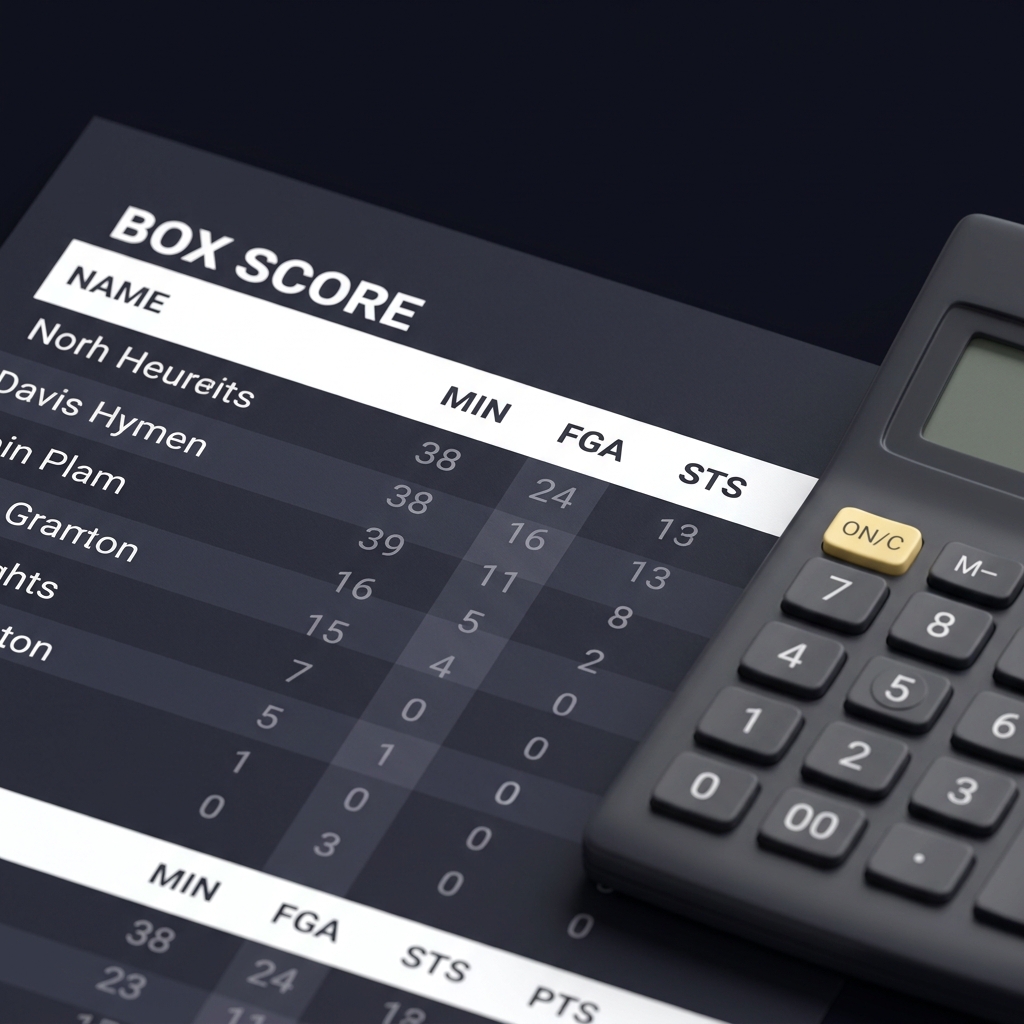
Usage does not measure efficiency or defensive value, and it does not capture changes in role driven by matchups or coaching plans. Treat usage as an opportunity gauge rather than a projection of output; you must combine it with minutes and efficiency measures to form a reliable forecast.
How to calculate a player's usage percentage
The formula and its components
The standard usage formula converts a player's counting stats into a percentage of team possessions while they are on court. It incorporates the player's field goal attempts, free-throw attempts adjusted for team free throws, turnovers, and the team's total possessions. When you run the formula, pay attention to minutes played as the denominator context.
Quick worked calculation
For a quick worked example, take a player with 18 field goal attempts, 6 free-throw attempts, and 3 turnovers in 32 minutes on a team that tallied 90 possessions while this player was on court. Plugging those counting stats into the usage expression gives you a usage percentage that represents that player's share of finishing possessions.
Usage rate changes evaluation by shifting focus from raw talent or reputation to opportunity; it quantifies how often a player finishes possessions, which helps forecast counting stats when combined with minutes and efficiency.
Where to source the inputs
Reliable public sources for the inputs include official box scores, league stat pages, and reputable stats aggregators that report possessions and player minute splits. Keep a short list of go-to sources so you can compute usage quickly in the pregame window.
Translating usage into player prop decisions
When high usage points to prop value
High usage often signals value for scoring and shot-attempt props because it implies volume. If a player's usage is meaningfully above their season baseline and minutes appear stable, it can be a reason to consider a points or shot attempts prop, provided the efficiency and matchup do not contradict the read.
When to distrust usage-driven signals
Don't trust usage alone when efficiency is poor, minutes are uncertain, or the elevated usage comes from a single anomaly such as garbage-time scoring. A spike in usage that coincides with low true shooting efficiency should raise a red flag rather than trigger an automatic bet.
Combining usage with efficiency
Pair usage with an efficiency measure like a shooting percentage or a simple true shooting proxy to convert opportunity into expected output. A high-usage, high-efficiency combination is the strongest signal for placing a larger stake on a scoring prop.

Adjusting usage for game context: pace, teammates, matchup
Why raw usage can mislead
Raw usage is tied to the number of possessions a team runs. A fast-paced opponent or sudden minutes changes can inflate counting stats even when a player's share stays constant. Adjust usage for expected pace and lineup compositions to avoid overestimating probable outcomes.
Adjusting for expected pace
To adjust for pace, scale your usage-based projection by expected team possessions rather than season averages if a matchup or injury news indicates a faster or slower game. This gives a clearer view of the likely counting stat volume for a player in that specific contest.
How teammate injuries or rotations change usage
When a starter is out or a rotation shifts, usage often moves to whoever fills the offensive role. Track injury reports and rotation notes pregame, and raise projected usage for likely role beneficiaries. Conduct quick checks on minutes trends to validate the expected bump.

In-game trends and minute-level usage signals
Live indicators to track
In live settings, watch substitution patterns, foul trouble, and whether a player is getting early shots in the shot clock. These signals indicate short-term shifts in usage that can make or break a live prop decision.
How to use substitution patterns
Substitution patterns tell you who the likely finishing options are for a given lineup. If a primary ball-handler sits for a ten-minute stretch, the usage of his immediate replacement will typically rise. Convert those minutes into a revised usage share for the remainder of the game to update your projection.
When to update your estimate during the game
Update projections after clear structural shifts: a starter leaves with an injury, a bench run extends because of favorable matchup, or a player enters foul trouble. Small swings in minutes in a close game can materially change counting-stat expectations.
Simple model: combining usage with efficiency and minutes
Weighting usage, minutes, and efficiency
Use a compact scoring model that weights three inputs: usage, projected minutes, and an efficiency proxy. Weighting will depend on how confident you are in minute projections, but a simple approach gives usage 50 percent, minutes 30 percent, and efficiency 20 percent for a screening score.
A minimal checklist model
The minimal checklist model screens candidates by three pass-fail items: is usage above baseline by a threshold, are projected minutes within a defined range, and is efficiency acceptable for the prop type. Use the model to rank opportunities before applying stake rules.
Quick screening score for player props using usage, minutes, efficiency
For screening only
Limitations of tiny models
Small models are good at screening but not for final stake sizing. They ignore opponent defensive adjustments, late-breaking rotation changes, and variance. Treat the output as a priority rank rather than a definitive forecast.
Decision criteria: when to act on usage signals
Minimum requirements before placing a prop
Require a few hard checks before betting: a usage delta above your threshold, a projected minutes floor, and no negative efficiency trend that contradicts the opportunity. If any of those checks fail, pass or reduce exposure.
Sizing and stake rules based on confidence
Use discrete confidence bands to size stakes: low-confidence screens get small trial stakes, medium-confidence opportunities receive moderate sizing, and high-confidence, multi-check passes merit larger but still controlled stakes. The exact amounts should match your bankroll rules.
Record keeping and testing
Track every decision with a short log: inputs, adjustment rationale, final stake, and outcome. This record is essential for iterating and finding which usage thresholds and checks actually predict profitable outcomes over time.
Common mistakes and how to avoid them
Over-reliance on single-game anomalies
A common error is reacting to one high-usage game as if it were the new normal. Guard against this by comparing recent usage to season baselines and requiring confirmation from minutes or lineups before acting.
Ignoring minutes and substitution patterns
Usage without minutes is incomplete. You may see a usage spike in a short stint that will not persist for a full game. Always cross-check projected minutes and substitution tendencies before sizing up a bet.
Misreading small sample efficiency
Small samples distort shooting percentages and other efficiency measures. When deciding, prefer multi-game trends for efficiency and treat single-game outliers with skepticism.
Practical scenarios and worked examples
Scenario: starter injured and role expands
Pregame, a starter is listed as out and the backup is projected to see an extra 10 to 15 minutes. Start with the backup's season usage and scale it up to the new minutes. If the adjusted usage crosses your scoring prop threshold and efficiency remains reasonable, treat this as a medium-confidence bet with modest stake size.
Example numbers: baseline usage 18, projected minutes +12, adjusted usage 22 after scaling for minutes. If your prop line is conservative versus this projection and matchup pace favors more possessions, place a trial stake and log the decision for follow-up analysis.
Scenario: star rests and bench usage spikes
If a star rests, bench players who fill scoring and ball-handling roles often see usage spikes. Check which bench player receives starter minutes and who handles final shots in late game simulations. Increase projected usage for those players and re-evaluate prop lines for shot attempts and points.
Example numbers: a bench guard with baseline usage 14 gets an estimated 8 additional minutes; if adjusted usage rises above 18 and team pace is steady, this can justify a targeted bet on over for shot attempts if efficiency is acceptable.
Scenario: high pace mismatch
Against a pace-heavy opponent, a stable usage share leads to more counting-stat opportunities simply because possessions increase. Scale your projections by expected team possessions for the matchup. If a player's usage is unchanged but possessions jump 10 percent, expected counting stats should increase accordingly and may expose value in volume-driven props.
One practical step is to compute the projected counting stat both on per-36-minute assumptions and on adjusted pace to see if both lines support a bet. If both align, the case strengthens.
How to fold usage analysis into bankroll and challenge-based testing
Setting limits and trial sizes
Set strict limits for early experiments: small fixed bet sizes, a limited number of trials per week, and a maximum bankroll percentage allocated to usage-driven tests. This prevents emotional overreach and preserves capital while you validate the approach.
Tracking outcomes for repeatable improvement
Log each trial with inputs and outcomes, then analyze results after a defined sample. Focus on identifying which checks (minutes, efficiency thresholds, pace adjustments) improved hit rates and where the model failed.
Using simulation or virtual funded challenges
Simulated or challenge-style accounts let you test over samples without risking real funds. These environments are useful for refining thresholds and improving decision discipline before scaling your stakes under live conditions.
Integrating usage analysis with market lines and odds
How markets price usage-driven opportunity
Lines move when public and professional money updates expectations about minutes and opportunity. A usage read validated by market movement can confirm your projection, while a contrary move should prompt a review of your inputs.
When market moves confirm or reject your read
If the market shortens a line after news you already accounted for, that often confirms the adjustment. If the market moves against you without apparent new information, respect the market signal and re-check minutes and matchup assumptions before committing to a stake.
Simple market checks before placing a bet
Quick checks include recent line movement, whether alternative books show similar pricing, and whether sharps are publicly discussed on trusted channels. Use these checks as tie-breakers, not as primary inputs, unless they directly address minutes or role changes. For a quick tool reference, see the BettingPros prop analyzer.
Pregame and live checklist to apply quickly
Top pregame checks
Five pregame checks: confirm projected minutes, verify injury and rotation news, calculate adjusted usage for the matchup, check efficiency trends, and compare your projection to the market line.
Live-game quick updates
Three live checks: substitution patterns, foul trouble, and early shot-clock usage. If any trigger a significant usage shift, update your projection and adjust exposure accordingly.
Recording your decision
Use a short log template: player, date, inputs, adjustments, stake, outcome, and brief notes. Review logs periodically to refine thresholds and stop repeating avoidable mistakes.
Conclusion: disciplined, contextual use of player usage
Key takeaways
Usage is a useful gauge of opportunity but not a standalone forecast. Combine usage with minutes and efficiency, adjust for pace and lineup context, and use structured checks to decide and size props.
Next steps for readers
Start with a small batch of simulated trials, record your decisions, and iterate on thresholds. Over time you will learn which adjustments matter most for your prop focus.
Encouragement to test and track
Disciplined testing, rigorous record keeping, and modest early stakes give you the best chance to learn whether usage-informed rules help your decision-making. No metric guarantees outcomes, but a repeatable process does improve clarity.
Update usage projections as soon as rotation reports and projected minutes are confirmed; act conservatively until a pattern of minutes is established.
No, usage signals opportunity but not efficiency; always pair usage with recent efficiency trends before sizing a stake.
Yes, simulated testing helps validate thresholds and decision rules without risking funds, and it improves discipline and record keeping.