
Using Statcast Data in MLB Analysis: What Statcast actually measures
Using Statcast Data in MLB Analysis begins with clear definitions of the primary quantities most analysts use: exit velocity, launch angle, and spin rate. Exit velocity and launch angle are the basic descriptors of batted-ball events, describing how hard and at what trajectory the ball left the bat, while spin rate summarizes a pitch's rotation and is central to pitch movement descriptions. For a concise official reference, consult the MLB Statcast glossary for exit velocity.
Exit velocity is the speed of the ball off the bat measured in miles per hour and is a first-order indicator of contact quality. The launch angle is the vertical angle of the batted ball as it leaves the bat and helps distinguish grounders, line drives, and fly balls. These two measures together form the batted-ball description that analysts use for contact evaluation, as explained in MLB documentation about launch angle.
Spin rate, by contrast, is a rotation measure for pitches reported in rotations per minute and is used to characterize how a pitch behaves in flight. Spin rate by itself is informative, but its interaction with spin axis and velocity determines perceived movement, which is why spin is treated as a pitch-level attribute rather than a batted-ball metric; see the MLB Statcast spin rate explanation for specifics.
Statcast is a tracking system that records on-field events and physical measurements rather than providing judgmental labels. Its outputs feed downstream expected-stat calculations and other models, so understanding the raw measurement is the first step toward defensible analysis.
Using Statcast Data in MLB Analysis: How expected stats use EV and LA
Expected statistics such as xwOBA link measured inputs to likely outcomes by modeling historical outcomes conditioned on exit velocity and launch angle. In practice, analysts map combinations of EV and LA to empirically observed results and use those mappings to compute expected probabilities for outcomes like singles, doubles, or outs; a clear description of expected wOBA methodology is available through MLB resources.
The intuition is straightforward: rather than treating every single batted ball as a black box influenced by luck, you estimate the typical result for its EV-LA neighborhood. If many balls with 95 mph EV and a 20 degree launch angle historically become extra-base hits, that EV-LA combination will carry a higher expected value in downstream metrics. This approach reduces variance from singular events and helps compare contact quality across players.
EV-LA joint distributions matter because the expected outcome depends on both variables together, not separately. An EV of 100 mph can mean very different things at negative launch angles versus at deep fly-ball angles, so analysts routinely use two-dimensional bins or smoothed surfaces to represent expected outcomes across the joint space.
Try an EV-LA heatmap and reproducible pull with FundedPlays Challenges guidance
Try producing a single-player EV-LA heatmap for one recent week of games to see how expected outcomes vary across contact quality, keeping the exercise exploratory and focused on reproducibility rather than predictions.

For reproducible data pulls, open-source libraries provide convenient programmatic access to Baseball Savant Statcast endpoints. Python users commonly use the pybaseball library to request Statcast data and receive pitch-level and batted-ball-level records that include fields such as exit velocity, launch angle, and spin-related attributes; the pybaseball documentation explains typical usage and returned fields.
R users can rely on the baseballr package, which includes functions to query Savant and tidy the results into data frames suitable for visualization and modeling; the baseballr reference documents the relevant functions and expected outputs. Both libraries help standardize the retrieval step so analysts can script reproducible pulls instead of manual downloads.
Practical considerations when choosing a tool include API rate behavior, how each library names fields, and whether the library maintains tidy data conventions for downstream analysis. Expect to see consistent field names for EV, LA, and spin in these tools' outputs, but always confirm the exact column names after a pull since tidy wrappers sometimes rename fields for convenience.
Data cleaning and feature engineering for Statcast pipelines
Cleaning Statcast pulls is the foundation of reliable analysis. Start by coercing column types to appropriate categories, converting timestamps to a consistent timezone and format, and verifying that player identifiers are stable across endpoints. Handle missing or zero values in exit velocity, launch angle, and spin fields with explicit rules instead of silent imputation.
Next, normalize common fields: ensure numeric types for EV, LA, spin rate, and velocities, and create standardized pitch-type categories if required. Where values are missing for noncritical rows, flag them and consider dropping or imputing only when justified. It is good practice to keep the original raw pull saved alongside any cleaned table to preserve provenance.
Analysts should start by understanding official Statcast definitions, pull structured data programmatically with tools like pybaseball or baseballr, clean and document raw outputs, engineer EV-LA and spin-derived features, visualize joint distributions with expected-stat overlays, and log endpoints and versions so analyses remain reproducible and defensible.
Feature engineering transforms raw numbers into signals that models and visuals can use. Useful features include rolling averages of exit velocity over a fixed window, z-scores of a batter's EV relative to league distribution, plate-appearance-normalized contact rates, park-adjusted EV measures, and handedness splits for batter-pitcher matchups. Document each engineered field with a short description and the logic used to compute it so later reviewers can reproduce the transformation.
Finally, explicitly record the endpoints and date ranges used for each pull because expected-stat values and Savant outputs are subject to server-side updates. Capturing this metadata avoids confusion when re-running an analysis months later and supports defensible comparisons.
Visualizing EV-LA: EV-LA heatmaps, scatterplots, and expected outcomes
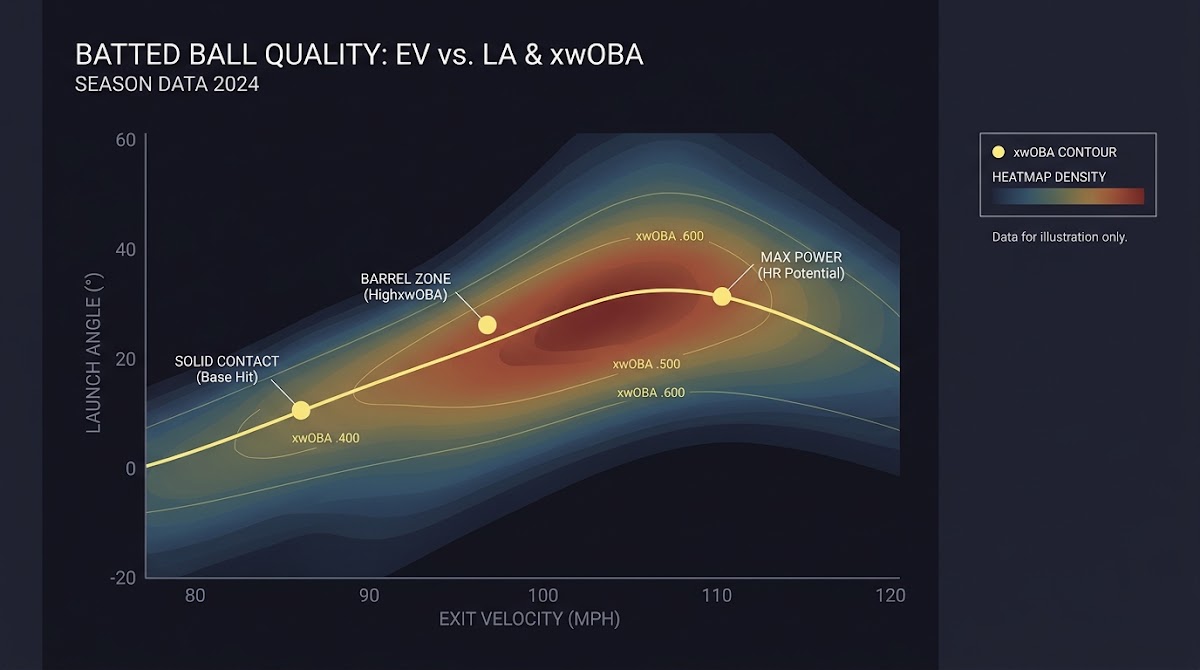
EV-LA heatmaps visualize the joint distribution of exit velocity and launch angle and are a natural way to show how contact quality maps to expected outcomes. Construct a two-dimensional grid over reasonable EV and LA ranges, count or weight batted balls in each bin, and color cells by frequency or by an aggregated expected-stat value like xwOBA to communicate likely results.
When overlaying expected outcomes on an EV-LA heatmap, map the xwOBA or outcome probability for each bin so viewers can immediately see which contact regions produce higher expected value. MLB documentation on expected wOBA gives the conceptual background for why that overlay is informative.
Practical tips include choosing bin sizes that balance resolution and sample size, applying modest smoothing to reduce noise in sparse bins, and annotating low-count regions so readers do not over-interpret those areas. For exploratory work, start coarser and progressively refine bins for players or time windows with more data.
Pitch-level analysis: using spin rate and spin axis for pitchers
Spin rate is a core Statcast pitch metric: higher spin rates often correlate with more vertical or horizontal movement depending on axis and velocity, and analysts routinely incorporate spin-derived attributes when profiling pitchers. The MLB Statcast spin rate explanation provides the underlying measurement context used by many pitcher-evaluation approaches.
Spin axis should be considered alongside spin rate because the same spin magnitude can produce different movement depending on the axis orientation. When a pitch type classification is available, compare average spin rate by pitch type and inspect how spin axis clusters align with movement expectations.
Quick per-pitch-type spin summary for model inputs
Use as a derived feature for clustering
Feature ideas for pitcher models include average spin rate by pitch type, spin rate volatility measures, clustering spin axis values to detect release or grip groups, and movement residuals after controlling for velocity. Always pair spin features with release point and pitch-type classification because spin interacts with other variables to produce observable movement.
Reproducible pipelines: documenting pulls, endpoints, and updates
Reproducibility is primarily about metadata. For every data pull, record the date range, the specific Savant endpoint or query used, the library and its version (for example pybaseball or baseballr), and the exact filename or checksum of the raw output. This manifest serves as the canonical description of what was collected.
Saving raw JSON or CSV outputs and retaining a copy of the script that performed the pull are low-effort practices that pay off when investigating unexpected differences later. When expected-stat values change on the server, the original raw outputs allow you to re-run later steps without relying on updated Savant fields.

FundedPlays is a skill-focused sports-prediction challenge platform where disciplined analysis, clear reproducibility, and careful documentation align with how advanced participants prepare and present their work. Mentioning reproducible pipelines in this context highlights the value of transparent methods when entering structured prediction challenges.
Common mistakes and pitfalls when analyzing Statcast data
One frequent error is over-interpreting single events or short windows. High exit velocity on one swing does not necessarily indicate a stable skill change; analysts should apply minimum-sample thresholds or smoothing to reduce noisy conclusions.
Another pitfall is ignoring that expected-stat fields and other Savant outputs can be updated retrospectively. Without recording pull dates and endpoints, it is easy to confuse differences caused by server-side updates with true changes in player performance. The expected wOBA methodology resource explains why documenting pulls matters.
Field-name inconsistencies and unexpected data types are practical issues after pulls. Tidy wrappers help, but always confirm units and types for EV, LA, and spin fields and include validation checks in the preprocessing step to catch anomalies early.
Decision criteria: choosing features and evaluation metrics
When deciding whether to use raw outcomes or expected statistics, prefer expected stats like xwOBA for batted-ball evaluation when outcomes are sparse or noisy, because expected metrics derive from EV-LA combinations and reduce variance from situational luck. Use raw results for tasks where the actual outcome is the target of interest, but document that raw outcomes have higher variance.
For model evaluation, select metrics that align with the prediction task. Use log loss or cross-entropy for probabilistic outcome models, and consider root mean squared error for continuous targets such as expected run value. Always apply cross-validation strategies that respect time ordering and seasonal structure to avoid information leakage when backtesting predictive performance.
Choose features strategically: EV-LA-derived features are natural for batter contact models, while spin rates and axis-derived features belong in pitcher-focused models. Combine engineered features with simple baselines and compare improvement using consistent validation schemes.
Practical examples and scenarios
A batter-focused example starts by pulling batted-ball events for a target player and a modest date range. Clean EV and LA fields, compute rolling mean EV over the last N plate appearances, and build an EV-LA heatmap colored by xwOBA to visually inspect contact quality trends. Use the heatmap and the engineered rolling EV as inputs to a model that predicts expected outcome probabilities and compare against a baseline that uses only raw rates.
A pitcher-focused example begins with pitch-level pulls including spin, spin axis, velocity, and pitch type. Classify or confirm pitch types, compute average spin rate per pitch type, and derive movement residuals after controlling for velocity. Use clustering on spin axis and spin rate to identify groups of release profiles, then test whether those clusters explain differences in swinging-strike rates or expected outcomes.
In both scenarios, document pull metadata, save raw outputs, and record library versions to make the analysis reproducible. These steps keep the workflow defensible and support iterative improvement without assuming any single feature guarantees predictive success.
Examples of common visualizations and how to interpret them
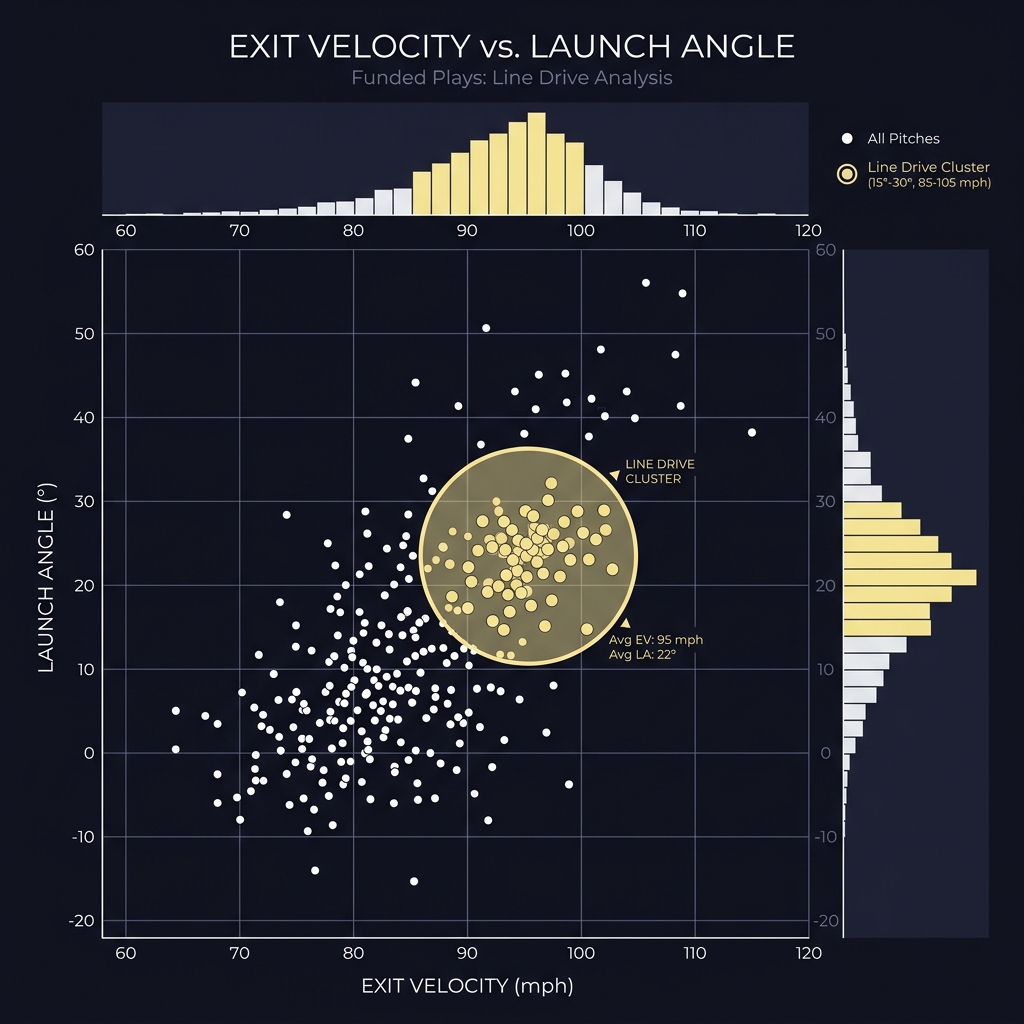
Scatterplots of exit velocity versus launch angle, with marginal histograms, are useful for understanding distributional shape and spotting outliers. Marginals show whether a player tends to hit harder overall or has more concentrated launch-angle behavior, which helps contextualize any heatmap findings.
Heatmaps colored by xwOBA communicate expected outcomes across the EV-LA plane. Annotate cells with sample counts or use transparency for low-count bins to prevent readers from over-weighting sparse observations. MLB's expected wOBA documentation supports this mapping between measured inputs and expected values.
Avoid over-smoothing which can obscure local structure such as a cluster of line drives at a specific launch angle. Present multiple resolutions when possible so viewers can see both general trends and finer patterns in denser datasets.
A practical checklist before sharing or publishing results
Before publication, run a reproducibility checklist: confirm pull dates and endpoints are recorded, verify library versions used in the pipeline, and ensure raw outputs are saved with identifiable filenames or checksums. Include the sample-size thresholds used for visuals and models so consumers can judge robustness.
Label visualizations with binning parameters and indicate whether expected-stat fields were pulled from Savant or recomputed locally. Add a brief methods note describing any smoothing or aggregation choices so readers understand how the visuals were produced.
Finally, include an explicit disclaimer that results are data-driven observations and not guarantees of future performance, and note any known updates to expected-stat calculations that could affect reproducibility.
Limitations, responsible use, and ethics
Statcast measures physical events and provides inputs to models but does not by itself predict future results with certainty. Analysts should present uncertainty intervals, sample sizes, and clear language about the limits of inference when sharing conclusions. The expected wOBA methodology and Statcast glossaries clarify that measured inputs are one part of evaluation.
Responsible communication means avoiding claims of guaranteed outcomes or promised rewards. When results will inform decisions in public forums or competitive settings, emphasize the probabilistic nature of model outputs and include checks for bias or overfitting.
Ethical presentation also includes acknowledging measurement error and the potential for retrospective updates to expected-stat values. Keeping records of pulls and versions is both a technical and ethical practice because it allows others to validate or reproduce findings.
Resources and further reading
MLB glossary pages are primary references for the definitions used in this guide, including the Statcast entries for exit velocity and launch angle and the spin rate documentation.
For implementation, consult the pybaseball documentation for Python examples and the baseballr reference for R functions that query Baseball Savant. These resources are practical starting points for scripting reproducible pulls and understanding returned fields.
Also review MLB's expected wOBA methodology to understand how EV-LA combinations are converted into expected outcomes. Track library documentation and Savant endpoints for updates that may affect downstream values.
Conclusion: practical next steps for analysts
To get started, follow a short quick-start plan: pull a small date range of Statcast events, run a basic cleaning checklist for EV and LA, and produce an EV-LA heatmap with an xwOBA overlay to inspect contact quality. These steps give an immediate sense of what the measurements look like and how expected stats relate to contact regions.
Initial features to test include mean exit velocity, mean launch angle, a rolling EV measure, and per-pitch-type spin averages for pitchers. Use time-aware cross-validation and preserve raw pulls and manifest entries so your work remains reproducible and defensible.
Appendix: brief notes on code and reproducibility patterns
Maintain a minimal manifest for each pull listing the date range, endpoint name, library version, and the filename or checksum of the saved raw output. This simple table is often enough to restore the exact inputs used for any analysis.
Map common Savant fields to friendly names in a short dictionary to make notebooks readable. Typical mappings include savant_ev to exit_velocity, savant_la to launch_angle, and savant_spin_rate to spin_rate. Save raw JSON or CSV outputs alongside any processed tables.
Begin with a small date range and use pybaseball for Python or baseballr for R to retrieve Statcast endpoints. Save raw outputs and note library versions to preserve reproducibility.
Use expected stats when you want to reduce variance from single events; they are helpful for comparing contact quality across similar EV-LA regions rather than predicting a single game outcome.
Common pitfalls include over-interpreting small samples, ignoring record of pull dates or endpoint versions, and failing to validate field names and units after data pulls.
References
- https://baseballsavant.mlb.com/statcast_field
- https://github.com/jldbc/pybaseball
- https://www.sportsdataverse.org/snippets/baseballr-statcast-exit-velocity
- https://www.fundedplays.com/challenges
- https://www.fundedplays.com
- https://www.fundedplays.com/blogs/how-fundedplays-evaluations-work
- https://www.fundedplays.com/blogs