

What save percentage actually measures
Formal definition and how SV% is calculated - Using Save Percentage Without Overreacting
Save percentage, commonly written SV%, is the share of shots on goal that a goaltender stops; it is calculated as saves divided by shots on goal and is a simple rate-stat summary of outcomes rather than a full performance measure. For a formal definition and glossary entry, see the NHL Stats Glossary which lists SV% as the standard rate used in box score reporting NHL Stats Glossary.
Put plainly, if a goalie faces 25 shots and allows 2 goals, the SV% is 23 saves divided by 25 shots, or 0.920. That basic arithmetic makes SV% easy to compare across games, but it also hides what happened before the shot was taken, such as pass sequences or the shot location that affect how difficult each stop was. Natural Stat Trick and similar methodology pages highlight that SV% is useful as a quick snapshot but does not incorporate pre-shot or modelled shot quality adjustments Natural Stat Trick Glossary and Methodology.
SV% is therefore best framed as a starting point in goalie evaluation. It answers a narrow question: given the shots that reached the net, how many were stopped. It does not answer how many of those shots were likely to be goals before the shot occurred, or how much of the result comes from team defense and game context. For a more complete view, expected-goals based metrics are the usual complements to SV% in modern analysis Goaltender metrics primer.
Try a structured challenge for disciplined evaluation
For a disciplined approach to assessing goalie performance, consider frameworks that combine simple rate stats like SV% with expected-goals context and clear sample-size rules; these approaches reduce knee-jerk reactions and encourage reproducible evaluation.
Why SV% can mislead: shot quality, game state, and randomness
Shot quality and pre-shot information
Raw SV% treats every shot that reaches the goal as equal in the arithmetic, but shots vary dramatically in their chance of scoring depending on location, angle, shot type, and the events that led to the shot. Modern expected-goals models explicitly encode these pre-shot features so that the same SV% can be produced by very different underlying shot profiles, a key reason analysts avoid interpreting SV% alone Goaltender metrics primer.
Use rolling SV% windows with binomial confidence intervals and cross-checks from expected-goals metrics like xGA and GSAx; require agreement across those signals before changing evaluations.
Game state, special teams, and defensive systems
Team context alters both the quantity and quality of shots a goalie faces. For example, strong puck possession, an effective neutral zone trap, or a disciplined penalty kill reduce high danger opportunities and change the mix of shots that count in SV%. Natural Stat Trick documentation and methodology pages discuss how team-level factors and special teams influence raw shot totals and therefore the interpretation of SV% Natural Stat Trick Glossary and Methodology.
Randomness and short-run volatility
Because SV% is a rate calculated over discrete shot events, short stretches like a single game or a handful of starts can show large swings that are primarily noise. Classical statistical work on interval estimation clarifies why small samples produce wide uncertainty bands, so most early-season or short-run SV% deviations should be treated cautiously unless additional evidence supports a real change Interval Estimation for a Binomial Proportion.
Expected goals and GSAx: the context you need
What xG and xGA measure and common model inputs
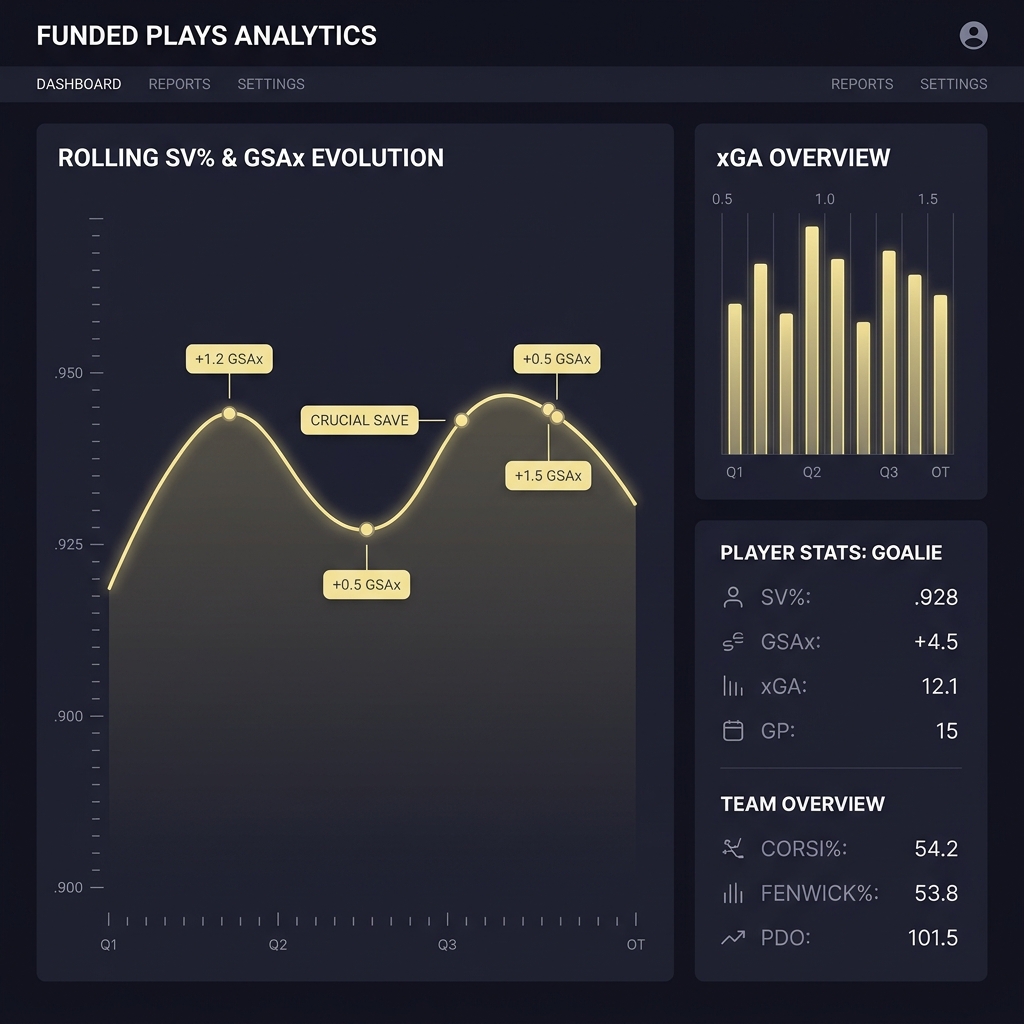
Expected-goals models assign a pre-shot probability that a given shot will score by using features such as distance, angle, shot type, and preceding passes or rebounds. Those features let xG and xGA separate changes in shot frequency from changes in shot quality, so they are a standard way to contextualize raw SV% when evaluating goaltenders About MoneyPuck's expected goals model.
Goals saved above expected (GSAx) and why it helps
Goals saved above expected, often abbreviated GSAx, compares the actual goals allowed to the sum of expected goals against for the same shots. A positive GSAx suggests a goalie stopped more shots than the modeled expectation, while a negative value indicates the opposite. Using GSAx alongside SV% helps distinguish strong stop rates that reflect true shot prevention from favorable shot mixes or good team defense Goaltender metrics primer.
Statistics 101: SV% as a binomial proportion and confidence intervals
Why SV% follows a binomial model
Each shot on goal can be modeled as a Bernoulli trial with two outcomes: goal or save. Aggregating those shots yields a binomial proportion, which is the statistical basis for standard error and interval calculations. This framing explains why randomness plays a strong role over small sample sizes and why point estimates of SV% are not precise early on Interval Estimation for a Binomial Proportion. For an applied example of confidence-interval work on save percentage see a recent analysis from CMU Examining the Decline of Save Percentage in the NHL.
How to compute and interpret confidence intervals
Confidence intervals for a binomial proportion provide a range that plausibly contains the true save probability given the observed data. In practice, conservative interval methods help avoid overinterpreting short-term swings; when the interval around a goalie's recent SV% overlaps their longer-term baseline, the data do not justify strong conclusions. Statistical primers describe several interval approaches and why wider intervals are more appropriate with small shot counts Interval Estimation for a Binomial Proportion.

Practical implications for early-season readings
Research on when hockey statistics stabilize shows that goaltender SV% typically needs larger samples than many skater metrics to become predictive, so early-season spikes or slumps are often temporary. That historical stabilization work supports using multi-game windows and caution before changing evaluations based on short stretches When do hockey statistics stabilize. Additional historical analyses of goaltending performance are available, for example at Hockey Graphs Save Percentage vs the Experts.
Practical framework: rolling averages, confidence bands, and cross-checks
Setting window lengths and smoothing SV%
Rolling averages or moving-window SV% smooth volatility by aggregating outcomes over recent starts or shots. Choosing the window length is a tradeoff: longer windows reduce noise but respond slowly to true changes, while shorter windows react faster but amplify random swings. Historical stabilization analysis informs typical window choices, and practitioners often report results for multiple windows to show robustness When do hockey statistics stabilize.

Combining rolling SV% with xGA and GSAx
A practical rule is to view a rolling SV% trend alongside an xGA-based expected baseline and GSAx. If rolling SV% moves outside a binomial confidence band and GSAx shows a similar divergence, the combination is stronger evidence of a true change than either metric alone. Evolving-Hockey's primer and public xG outputs are commonly used sources for this kind of cross-check Goaltender metrics primer. See the Funded Plays evaluations for an applied approach to combining checks: Funded Plays evaluations.
When smoothing can hide real change
Smoothing trades immediacy for stability, so a sudden switch in defensive deployment or an injury can produce a real change that a long rolling average will mask. To manage this, run both short and long windows and annotate any operational events like injuries or lineup shifts so you can interpret divergence between windows with context rather than assuming the long average is always correct Natural Stat Trick Glossary and Methodology.
Decision rules: when to change your evaluation of a goalie
Threshold-based checks using CI and xGA
Turn the framework into concrete rules: require a rolling SV% to lie outside its binomial confidence band for a pre-specified window length and verify that GSAx or xGA-based comparisons point in the same direction before adjusting a starter decision or roster rank. Using both the interval test and an expected-goals cross-check reduces false positives from random runs Interval Estimation for a Binomial Proportion.
Weighting recent performance versus long-term baseline
Assign weights to recent form based on sample size. For example, treat a six-start rolling SV% with narrow confidence bands as more persuasive than a two-start spike, and default to a longer baseline if sample-size safeguards are not met. Historical studies show that goalie metrics stabilize slowly, so give long-term baseline more influence unless the short-term evidence is supported by xGA-based divergence When do hockey statistics stabilize.

Contextual exceptions to standard rules
Certain operational events justify faster re-evaluation: known injuries that affect butterfly mechanics, a major change in defensive personnel, or a quick shift to a heavily different special-teams environment. Even then, document the event and seek corroborating model evidence before overreacting, because isolated context notes can still coincide with normal variance Natural Stat Trick Glossary and Methodology.
Common mistakes and how to avoid overreacting
Cherry-picking short streaks
A frequent error is basing judgments on a tiny subset of starts that looks extreme by chance. Because binomial variability is substantial in small samples, cherry-picking short streaks inflates false signals and undermines reproducibility. Rely on pre-defined windows and avoid post-hoc selection when possible Interval Estimation for a Binomial Proportion.
Ignoring shot quality or model differences
Mixing metrics from different expected-goals models without checking definitions and calibration is another common mistake. Different public models vary in features and tuning, so contrasting a GSAx from one source with an xGA from another can produce misleading conclusions unless you check that both use comparable inputs About MoneyPuck's expected goals model.
Overweighting single-game performances
Single-game SV% swings are noisy; even a very good or bad game rarely changes longer-term inference unless it is consistent with modelled shot-quality divergence and repeated over a window that meets your sample-size rule When do hockey statistics stabilize.
Overlay rolling SV% with binomial confidence bands and xGA checks
Keep model definitions consistent
Putting it together: example scenarios and next steps
Three short scenarios applying the framework
Scenario 1, stability: a goalie posts a slightly below-average SV% over ten starts but the rolling SV% confidence band overlaps the season baseline and GSAx shows near-zero divergence; the sensible action is to monitor without roster changes. This outcome follows directly from comparing rolling averages to binomial intervals and expected-goals cross-checks Goaltender metrics primer. See the Funded Plays homepage for related operational notes.
Scenario 2, supported decline: a goalie has a persistent roll of low SV% that falls outside the binomial confidence band for an agreed window and GSAx is negative across the same period. That combination signals stronger evidence that performance has weakened and can justify a lineup change or closer monitoring for mechanical issues. Using both checks reduces the chance of acting on simple variance Interval Estimation for a Binomial Proportion.
Scenario 3, model disagreement: a short SV% slump appears alarming but xGA-based GSAx from two public models diverge, with one showing no significant negative deviation. In that case, pause and run sensitivity checks across model outputs before changing evaluation; cross-model disagreement is a cue to withhold judgment until more data accumulate About MoneyPuck's expected goals model.
Checklist for in-game and roster decisions
Before adjusting a starter decision or changing roster priority, run this checklist: 1) Does the rolling SV% lie outside the binomial confidence band for your pre-set window? 2) Does GSAx from at least one model support the direction of the change? 3) Are there contextual triggers such as injury or lineup change that explain rapid movement? 4) Have you checked for cross-model agreement or large model definition differences? If the answers line up, changing evaluation is reasonable; if not, hold steady and continue monitoring Natural Stat Trick Glossary and Methodology.
Where to go for reproducible model outputs and further reading
For public, reproducible expected-goals outputs and methodology, practitioners commonly use Evolving-Hockey, MoneyPuck, and Natural Stat Trick. Those sources publish model descriptions and datasets that let analysts reproduce cross-checks, compare calibrations, and avoid model-mixing errors when evaluating goalies Goaltender metrics primer. Also see the Funded Plays blog for related discussion: Funded Plays blog.
Expected goals adjust for shot quality, so comparing SV% to xGA or GSAx shows whether a goalie is outperforming or underperforming given the shots faced.
There is no single cutoff, but goalie SV% stabilizes slowly; use rolling windows and binomial confidence checks rather than relying on very small samples.
No, a single game is usually insufficient; look for sustained evidence across windows and confirm with expected-goals cross-checks.
References
- https://www.nhl.com/stats/glossary
- https://www.naturalstattrick.com/glossary.php
- https://evolving-hockey.com/blog/goaltender-metrics-primer-expected-goals-and-gsax-2024-update/
- https://www.tandfonline.com/doi/abs/10.1198/016214501753209003
- https://moneypuck.com/about.htm
- https://www.stat.cmu.edu/cmsac/sure/2023/showcase/hockey_saves/report.html
- https://www.broadstreethockey.com/2013/8/21/4642614/when-do-hockey-statistics-stabilize
- https://hockey-graphs.com/2014/01/20/2013-2014-goaltending-performance-save-percentage-correlation/
- https://www.fundedplays.com/challenges
- https://www.fundedplays.com/blogs/how-fundedplays-evaluations-work
- https://www.fundedplays.com/blogs
- https://www.fundedplays.com
- https://scholar.smu.edu/cgi/viewcontent.cgi?article=1026&context=datasciencereview