
Using Rolling Averages Without Overreacting: what it means
Using Rolling Averages Without Overreacting starts with a simple point: moving averages smooth short term variability but they add lag, and the balance between noise reduction and responsiveness is controlled by the window or weighting you choose. The basic definition of a simple moving average and its smoothing effect is a useful baseline for monitoring because it makes clear why small fluctuations are less visible after averaging Eurostat moving average glossary. See a practical guide: the comprehensive guide to moving averages.
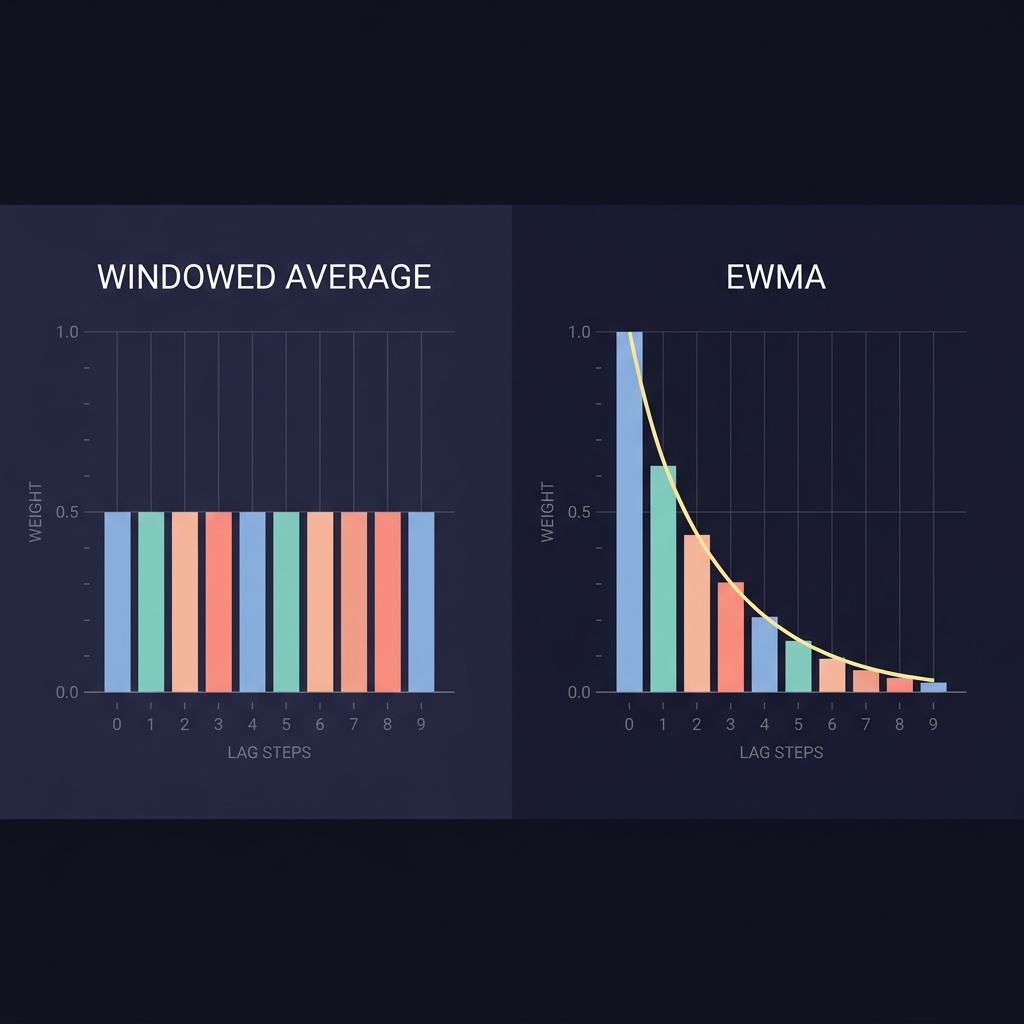
A weighted alternative to a simple moving average gives older observations less influence, and exponential weighting makes that tradeoff tunable through a smoothing parameter. That tuning is the practical lever teams use when they need faster response but still want to damp short spikes NIST EWMA control charts.
Frame the detection objective, estimate false-alarm costs, choose a window or alpha for an acceptable lag, require confirmation before action, and validate with out-of-sample tests.
A common operational example is daily public dashboards that display 7-day averages to reduce day-of-week reporting effects. Showing a 7-day average makes weekly patterns less likely to drive a reaction to a single busy or slow day CDC Respiratory Virus Dashboard technical notes.
When a fixed-window rolling average makes sense
Fixed-window moving averages are straightforward to compute and explain, so they are well suited for regular reporting where stakeholders expect a consistent method. Longer windows produce more smoothing but also more lag, so teams that publish routine summaries or weekly reports often prefer a fixed window to keep the method stable over time Eurostat moving average glossary.
One caution is that fixed windows suffer from end-point bias, and estimates near the series end are often revised as new data arrive. Official seasonal-adjustment systems use asymmetric filters at the ends of a series to reduce real-time distortion and to document expected revisions Census X-13ARIMA-SEATS seasonal adjustment program.

Using Rolling Averages Without Overreacting: tuning responsiveness with EWMA
For many monitoring workflows an EWMA style smoother gives a clean control: alpha or lambda sets how quickly past observations decay, and smaller values increase smoothing but also increase lag. That lets teams choose a point on the continuum between noisy raw counts and a sluggish trend line rather than being limited to discrete window lengths NIST EWMA control charts. Investopedia provides a practical comparison of common moving average variants.
Apply the checklist to your next monitoring review
Try the decision framework in the checklist section in your next monitoring review to map an acceptable lag to a smoothing choice and to set confirmation rules before taking operational action.
Operational weighting schemes such as the EPA NowCast show how adaptive or weighted averages can be tuned to downweight older data while remaining responsive enough for near real-time decisions. Those practical examples help convert abstract alpha values into actionable guidance when spike damping is the priority EPA NowCast guidance.
Confirming signals: avoid reacting to single noisy points
Statistical process control practice emphasizes reacting only to confirmed signals rather than a single outlier. Systems that require sustained patterns or multiple-rule triggers reduce false alarms and make operational responses more reliable NHS England SPC guidance.
Concrete confirmation rules include requiring two or three consecutive points beyond a threshold, using run rules that detect shifts in center or dispersion, and combining magnitude and duration tests so that brief spikes do not force immediate action. Those patterns help teams avoid knee-jerk changes to monitoring thresholds or incident protocols.
One caution is that fixed windows suffer from end-point bias, and estimates near the series end are often revised as new data arrive. Official seasonal-adjustment systems use asymmetric filters at the ends of a series to reduce real-time distortion and to document expected revisions Census X-13ARIMA-SEATS seasonal adjustment program.
Managing end points and real-time revisions
Estimates at the end of a series move as new data come in. Fixed-window estimates are commonly revised and can show misleading short-term change until the series settles; official seasonal adjustment frameworks handle this with asymmetric end filters to make provisional estimates explicit Census X-13ARIMA-SEATS documentation.
Practical tactics include flagging the most recent values as provisional, reporting revision bands so stakeholders see likely re-estimation ranges, and avoiding operational decisions based solely on the latest point. These steps reduce the chance that an initial blip leads to a costly or unnecessary response.

As a factual example of a structured evaluation platform, some virtual-challenge systems publish provisional progress and use rules-based reviews rather than treating last-minute changes as final outcomes. That approach mirrors the principle of treating end points with caution and explicitly communicating provisional status.
Weighted and adaptive approaches in practice: the NowCast example
NowCast-style methods weight recent observations more heavily so that a short-lived spike is damped while persistent increases still show through quickly. This practical balance between responsiveness and robustness is why adaptive weights are common in environmental monitoring EPA NowCast guidance.
Use adaptive weighting when the environment produces irregular, short spikes that should not trigger the same response as sustained changes. The tradeoffs are parameter complexity, interpretability for stakeholders, and the need to document provisional values and parameter choices clearly.
Decision rules: choosing window length, confirmation thresholds and cooldowns
Start a decision framework with an explicit objective: define what change you must detect, how quickly, and what a false alarm costs. That framing ties window, weight, and confirmation choices back to operational impact rather than intuition Eurostat moving average glossary.
Next, set a confirmation strategy that uses multiple checks: for example require N consecutive breaches, use run rules for sustained shifts, and apply a cooldown period after a confirmed action so that the system stabilizes before the next response. SPC guidance has these patterns and explains why single-point reactions inflate false-alarm rates NHS England SPC guidance.
convert EWMA alpha to an effective memory estimate
gives a simple reference for alpha interpretation
A simple checklist to make the frame operational is: state objective, estimate false-alarm cost, pick initial window or alpha from desired lag, require confirmation, and validate. That checklist moves discussion from opinion to repeatable configuration before deployment.
Common mistakes that lead to overreaction
Choosing too-short windows is a frequent error because short windows look responsive but amplify noise into apparent change. That mistake often causes teams to chase random variation rather than meaningful trends Eurostat moving average glossary.
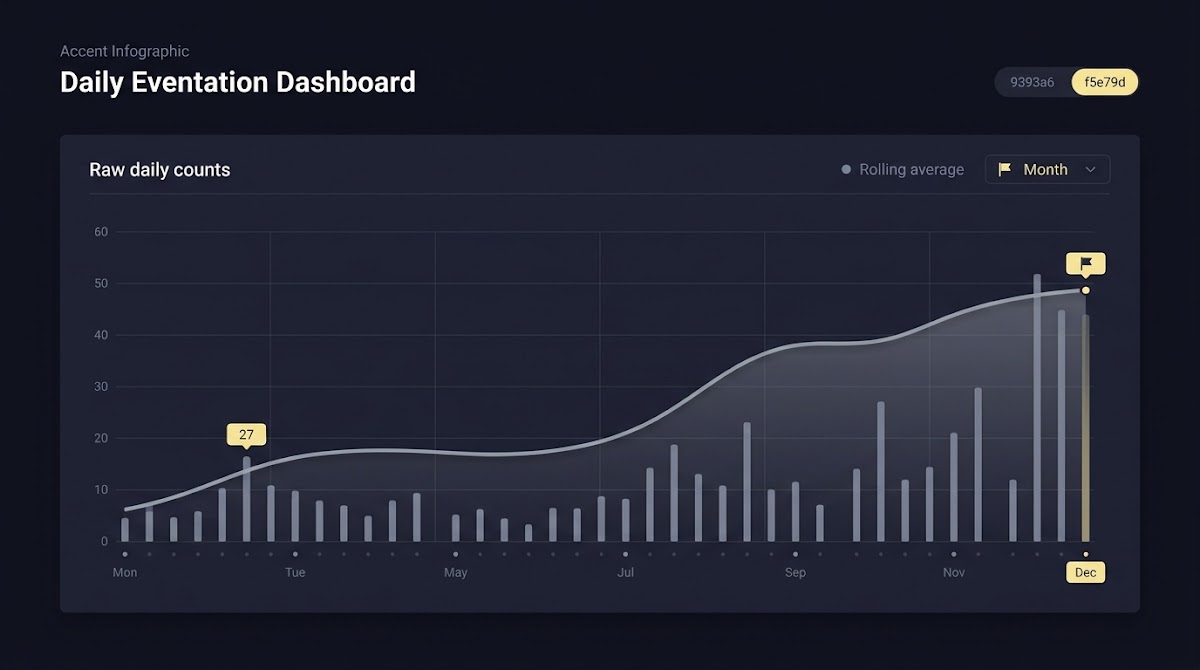
Another common pitfall is ignoring day-of-week effects or known seasonality, which makes normal cycles appear as anomalies. Dashboards that display raw daily counts without a 7-day smoothing baseline often trigger unnecessary alerts on predictable patterns CDC Respiratory Virus Dashboard technical notes.
Finally, acting on single endpoint spikes without provisional flags or revision awareness invites premature operational changes. Fixed-window and adjustment systems both document revisions and explain why initial values may not be final Census X-13ARIMA-SEATS documentation.
Practical scenarios and ready-made templates
Public health dashboard: using a 7-day average responsibly
Template steps: show raw counts alongside a 7-day rolling average, add a confirmation rule such as two consecutive days where the 7-day average increases by a defined percentile, and label recent values as provisional. Dashboards use 7-day smoothing precisely to avoid reacting to weekday reporting cycles CDC Respiratory Virus Dashboard technical notes.
Caveat: choose the confirmation threshold based on intervention cost and communication impact, and validate the template against historical revisions.
Environmental monitoring: using NowCast to avoid spike-driven changes
Template steps: compute a weighted NowCast that downweights older observations, set a maximum one-time response to a single-hour spike, and require a follow-up window before escalating actions. NowCast is designed to damp brief spikes while keeping near real-time usefulness EPA NowCast guidance.
Caveat: document the parameters and show how the weighted average would have reacted to past spikes so stakeholders understand the smoothing behavior.
Operational control: SPC confirmation templates
Template steps: select control limits based on historical process dispersion, require two consecutive out-of-control points before pausing automation, and use cooldown periods after manual interventions. SPC practice emphasizes multi-rule confirmation to reduce false alarms NHS England SPC guidance.
Caveat: ensure teams know the cost of delayed detection versus false alarms for each control decision.
How to test smoothing choices: validation and false-alarm costs
Validation uses out-of-sample tests and simulation to estimate detection delay and false-alarm rate. Split historical data into training and validation windows, tune parameters on training, and measure how often the tuned rule triggers on validation data in quiet periods versus true shift periods.
Quantify the cost of false alarms relative to detection delay by assigning operational impact values. For example, estimate cost per false intervention and cost per missed hour of detection, then choose the parameter set that minimizes expected operational loss. Simulations that inject synthetic shifts can make these tradeoffs visible and comparable across fixed windows, EWMA, and adaptive weights.
Implementing rolling averages: quick recipes
Simple moving average formula for a window of size N is the mean of the last N observations. EWMA pseudocode is equally compact: at each step update smoothed = alpha * latest + (1 - alpha) * previous_smoothed. These compact recipes make implementing smoothing straightforward in dashboards and pipelines NIST EWMA control charts.
Practical tips for production include handling missing data by forward-filling or using weighted adjustments, aligning timestamps so comparisons are consistent, and flagging provisional values near the series end. Also log revisions and display revision bands so end users see how estimates can change EPA NowCast guidance.
Interpreting and communicating uncertainty around smoothed values
Show raw counts alongside the smoothed series and use clear provisional labels for recent values so audiences understand what is final and what is subject to revision. Official seasonal adjustment practice documents expected revisions and advises transparent labeling for end users Census X-13ARIMA-SEATS documentation.
When reporting, describe expected lag plainly: say how many days or periods the smoothing effectively averages over, give examples of how long a real signal would take to show, and provide short language templates so non-technical stakeholders get consistent messages.
Summary checklist: disciplined smoothing to avoid overreaction
One-page checklist: define detection objective, estimate false-alarm cost, choose window or alpha to match acceptable lag, set confirmation rules and cooldowns, validate with out-of-sample tests, and document provisional values and revision behavior Eurostat moving average glossary.
Next steps: run the checklist on a representative historical period, simulate injected shifts to confirm behavior, and train the team on how to interpret provisional values. Treat smoothed metrics as one input among several and avoid using a single threshold as an absolute trigger.
Use a fixed window for simple, repeatable reporting when stability matters; use EWMA when you need a tunable tradeoff between smoothing and responsiveness and can interpret the smoothing parameter.
A common rule is to require two or three consecutive breaches of a threshold or a combined magnitude-duration test, plus a short cooldown before further action.
Show raw counts alongside the smoothed series, label recent values as provisional, and include a short note on expected revisions and lag.
References
- https://ec.europa.eu/eurostat/statistics-explained/index.php?title=Glossary:Moving_average
- https://medium.com/data-science/the-comprehensive-guide-to-moving-averages-in-time-series-analysis-3fb2baa749a
- https://www.itl.nist.gov/div898/handbook/pmc/section3/pmc324.htm
- https://www.cdc.gov/respiratory-viruses/dashboard/technical-notes.html
- https://www.census.gov/data/software/x13as.html
- https://www.airnow.gov/aqi/aqi-basics/using-nowcast-for-ozone-and-pm/
- https://www.england.nhs.uk/ourwork/tsd/making-data-count/
- https://www.fundedplays.com/challenges
- https://www.fundedplays.com/blogs/how-fundedplays-evaluations-work
- https://en.wikipedia.org/wiki/Moving_average
- https://www.investopedia.com/ask/answers/071414/whats-difference-between-moving-average-and-weighted-moving-average.asp
- https://www.fundedplays.com
- https://www.fundedplays.com/blogs