

Introduction: Why using player-level data matters for team projections
Using Player-Level Data in Team Projections is the practical route from individual forecasts to team outcome distributions, and it matters because modern public pipelines combine player forecasts with role and playing-time assumptions and use Monte Carlo simulation to express uncertainty rather than single numbers. A clear, reproducible pipeline helps teams of analysts, independent researchers, and advanced fans run scenario tests and explain how assumptions drive results FanGraphs playoff odds explainer
Normalize player forecasts to per-minute or per-possession rates, encode role and minute uncertainty with a depth chart or probabilistic sampler, aggregate contributions with Monte Carlo draws while modeling correlations and injury scenarios, and validate the probabilistic outputs with proper scoring rules and calibration diagnostics.
The value of a player-centered pipeline is that it turns modular inputs into interpretable outputs: you can ask what happens if a rookie earns starter minutes, or if a rotation change concentrates usage on one wing, and the system will return a probability distribution rather than a single expected value. That distributional output improves decision making for forecasting, scenario testing, and communicating uncertainty to stakeholders.
Definition and context: What does Using Player-Level Data in Team Projections mean
At its core, a player-level forecast is a per-game or per-minute estimate of contribution for an individual, combined with assumptions about role and expected minutes to convert that estimate into a team-level impact. Public projection efforts use depth charts to map projected minutes into lineups and then aggregate those lineup impacts across possessions or minutes to form team distributions; this mapping is central to reproducible pipelines and public documentation of projection systems 2025 ZiPS projections announcement
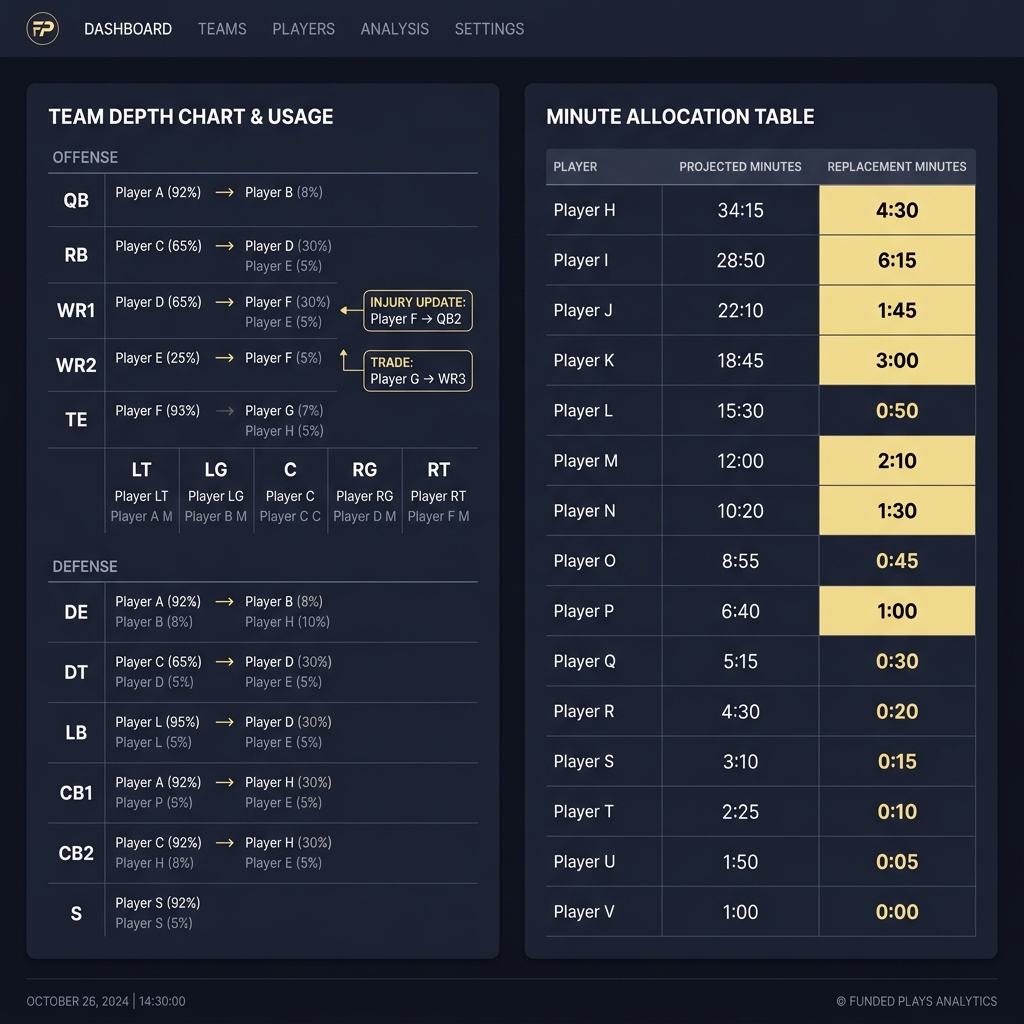
Depth charts act as the translation layer: they encode who is expected to play which minutes, who is a starter versus bench contributor, and how to allocate replacement minutes for injuries or rest. Public-facing models emphasize distributional forecasts over point estimates so users can see ranges and probabilities, which helps with interpreting risk and the impact of roster volatility.

Inputs vary by sport and intended fidelity: traditional box scores capture outcomes aggregated over a game, tracking and event-data record locations and actions at the possession level, and scouting or manually curated metrics add role context or qualitative adjustments. Event and tracking data are commonly used in public practitioner writeups to build fine-grained forecasting features and to measure per-possession impact Opta Analyst methodology overview
Choosing between public and licensed sources is a trade-off: public datasets enable reproducibility and external validation while licensed feeds often provide higher coverage and cleaner event linking. Before feeding data into a projection pipeline, run simple quality checks: check for missing minutes in season logs, validate that player role tags are consistent over time, and inspect time-series for abrupt, unexplained jumps that indicate ingestion or parsing errors.
Get the example dataset and notebook aligned with the FundedPlays Challenges workflow
Download a sample CSV and a minimal notebook example to follow these checks and reproduce the early pipeline steps.
Normalizing player contributions: per-minute and per-possession rates
Per-minute or per-possession normalization is standard practice to remove pace effects and make contributions comparable across teams and eras; converting raw totals into rates is the first step in moving from player forecasts to lineup and team projections, especially in basketball-style evaluations where possessions and minutes vary widely between teams NET rankings explained
Practically, convert box stats to per-minute rates by dividing counting stats by minutes and to per-possession rates by dividing by possessions estimated from play-by-play or team-level pace metrics. For small-sample players, apply shrinkage or hierarchical pooling to avoid inflated variance; simple empirical Bayes or regularized regression approaches reduce noise while preserving signal for medium- to large-sample players.
Assigning roles and expected playing time: depth charts and rotation assumptions
Allocating minutes is where forecasts meet roster structure: common approaches are fixed depth-chart minutes, probabilistic minute distributions that allow role volatility, or usage-driven forecasts that assign minutes based on historical usage and team context. Depth-chart assumptions materially alter team projections because models update lineup-level expectations when projected roles shift, and treating minutes probabilistically helps represent rotation risk FanGraphs playoff odds explainer
sample expected minutes for three role buckets
Use to generate probabilistic minute draws
Encode rookie progression, returning-from-injury uncertainty, or coaching-led rotation changes by inflating or deflating the defaults and by specifying probability mass for replacement minutes. A simple rule is to set baseline starter minutes from the previous season, shrink them toward team-average minutes for roles that are uncertain, and explicitly model scenarios where minutes are redistributed if a starter is unavailable.
To avoid overfitting to a current rotation, prefer conservative adjustments and validate minute allocations with out-of-sample checks. Document assumptions in a machine-readable depth-chart table so downstream aggregation and Monte Carlo samplers can read the same source of truth for reproducibility 2025 ZiPS projections announcement
Aggregating contributions: from players to lineups and team distributions with Monte Carlo simulation
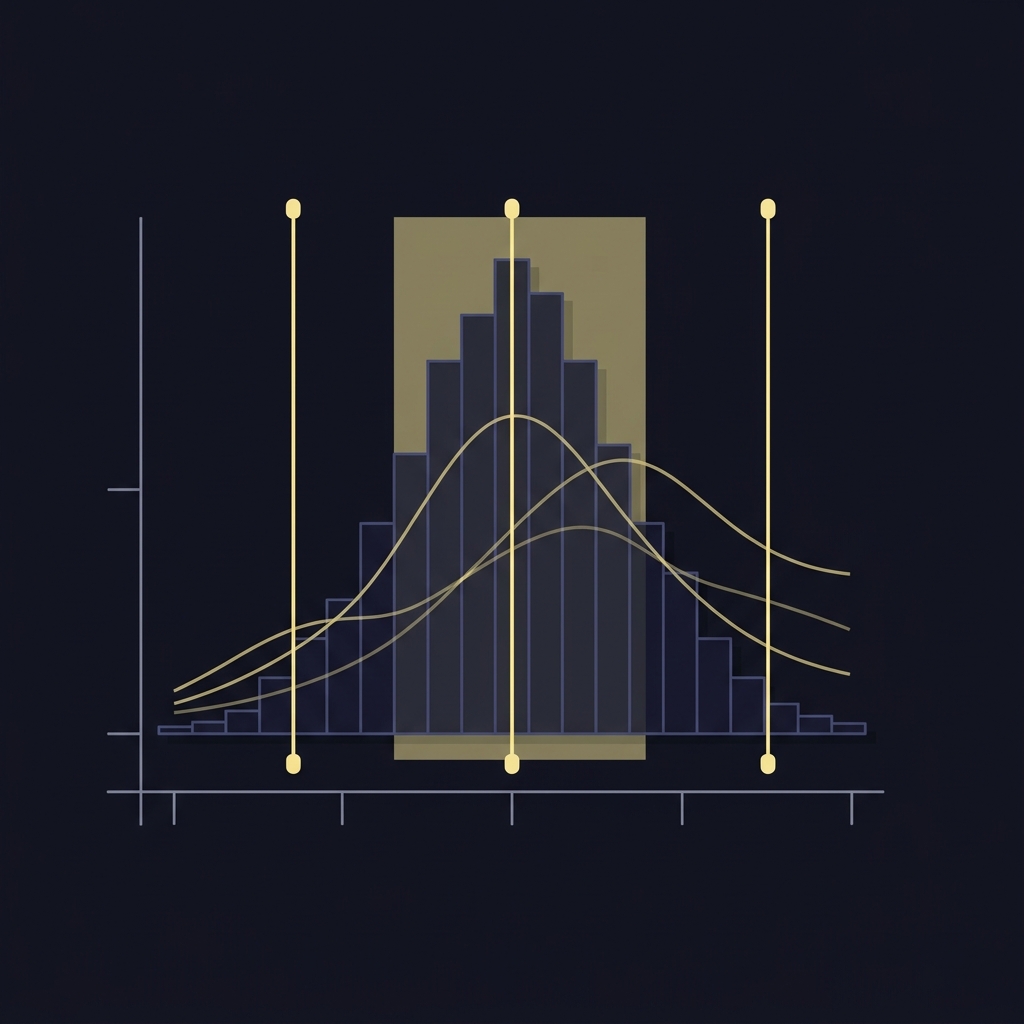
Monte Carlo simulation is the practical glue: for each draw, sample minutes or role assignments for every player according to the minute allocation model, convert per-minute or per-possession forecasts into contribution for the sampled minutes, and sum contributions across the on-court lineup to produce that draw's team outcome. Repeating this thousands of times produces a distribution of possible team outcomes rather than one point estimate, which supports probability statements and quantile summaries FanGraphs playoff odds explainer and is consistent with recent Monte Carlo simulation studies that examine simulation frameworks
Implement the sampler to record not only means but quantiles, the full empirical distribution, and scenario-specific tallies such as fraction of draws where a team exceeds a threshold. Decide on the number of draws by testing convergence of summary statistics; common practical choices range from a few thousand to tens of thousands depending on computational budget and the tail accuracy you need.
Model correlation between players explicitly where appropriate: correlated outcomes include shared team effects, correlated injuries, and lineup chemistry that affects per-possession impacts. You can model correlations via multivariate draws on residuals, copulas, or scenario-based coupling of minutes and outcomes. Include explicit injury or absence scenarios in the sampler by conditioning some draws on a player being unavailable and redistributing minutes to replacements according to the depth chart.
Possession- and action-value models: translating individual impact into possession value
Action-value and On-Ball Value frameworks quantify how individual events change expected possession value, allowing you to translate event data into a per-possession impact that can be summed across players and possessions. These frameworks provide a bridge between granular event streams and lineup-level possession outcomes when calibrated on observed outcomes StatsBomb On-Ball Value description

To integrate action-value outputs into a Monte Carlo aggregation, convert per-possession event-value contributions into expected points or expected goal values per possession and multiply by sampled team possessions or minutes. Watch for non-linear effects: doubling the number of possessions where a player handles the ball may not double their marginal value if usage shifts teammates' roles or defensive attention changes. Mitigate mapping uncertainty by incorporating model error into the per-possession metric and by running sensitivity tests that reweight event contributions. See how Funded Plays evaluations handle related integration steps how Funded Plays evaluations work
Season simulations and communicating uncertainty: producing ranges and probabilities
Season simulations propagate input uncertainty across games and schedule variability: embed the game-level Monte Carlo draws within a season-level loop that samples injuries, rest patterns, and schedule-driven matchups. Public models emphasize probabilities and ranges over point forecasts because season outcomes depend on many random draws and structural uncertainties Opta Analyst methodology overview and related projection examples using Monte Carlo for enrollment projections
Present outputs as probability tables, confidence intervals for season outcomes, and narrative scenario summaries. For example, report the chance a team finishes above a threshold, the interquartile range for expected wins, and a few named scenarios such as a key starter missing 20 percent of minutes. Clear presentation helps stakeholders interpret where actionable differences arise from assumptions rather than from statistical noise. See our blog for examples and templates Funded Plays blog
Validation: backtesting with proper scoring rules and calibration diagnostics
Validation requires strictly proper scoring rules to judge probabilistic forecasts: use scores such as Brier score or log loss to measure calibration and sharpness in a principled way, and report both because sharp but poorly calibrated forecasts are misleading while well-calibrated but overly broad forecasts can be unhelpful Journal of the American Statistical Association on scoring rules
Construct a backtesting workflow with holdout periods, rolling-window tests, and strict out-of-sample evaluation. Use calibration plots, reliability diagrams, and rank histograms to check whether predicted probabilities match observed frequencies, and compare model variants on both mean scores and calibration diagnostics to choose improvements that genuinely lift predictive performance FanGraphs playoff odds explainer
A frequent error is aggregating naive totals without accounting for how minutes and roles are allocated: summing per-player expected contributions disregards that two players cannot simultaneously occupy the same minutes and ignores substitution patterns that change marginal impacts. That mistake inflates certainty and produces misleading point forecasts rather than realistic distributions FanGraphs playoff odds explainer
Other pitfalls include ignoring correlation in minutes and outcomes, failing to model injuries explicitly, and overconfidence in single-point outputs. Mitigate these risks with probabilistic minute models, shrinkage for small-sample forecasts, and routine sensitivity analyses that show which assumptions drive your results Journal of the American Statistical Association on scoring rules
Practical examples and scenarios: stress-testing rotations and producing team forecasts
Example 1, new starter: start with player forecasts normalized to per-minute rates, set a baseline depth chart, and create a minute-allocation sampler that increases a candidate starter's expected minutes by a set distribution. Run Monte Carlo aggregation to see how the starter shift affects team-level means and tail probabilities, and summarize the output as the probability the team wins a given number of games or exceeds a points threshold; this step-by-step approach follows the public pipeline pattern for converting player forecasts into team distributions FanGraphs playoff odds explainer
Example 2, injury replacement: model injury as a Bernoulli trial with a specified probability and condition a fraction of Monte Carlo draws on that event. In draws where the injured player is absent, redistribute minutes according to the depth chart and resample per-minute contributions for replacements. Compare distributions with and without the injury to quantify impact and present results as probability differences and narrative risk statements.
For stakeholders, translate outputs into probability tables and a short narrative: report expected ranges, the most likely scenarios, and sensitivity notes that describe which assumptions would change the takeaway. Keep tables simple and attached reproducible code so readers can check assumptions themselves.
Conclusion: best practices and next steps for reproducible team projections
Best practices are straightforward: normalize inputs, encode minutes and role uncertainty explicitly, aggregate with Monte Carlo, and validate with proper scoring rules and calibration diagnostics. Emphasize reproducibility by keeping depth charts, samplers, and data pipelines in version control and by publishing backtests so others can verify claims FanGraphs playoff odds explainer
Next steps for practitioners are to implement the sampler and validation workflow described here, run sensitivity analyses on minutes and correlation assumptions, and iterate with held-out tests to build confidence in the pipeline. Reproducible documentation and routine backtesting are the most reliable ways to move from plausible forecasts to well-calibrated, actionable team projections. Visit Funded Plays for more resources.
Player-level uncertainty propagates through minute allocations and lineup aggregation, widening team outcome distributions and changing probabilities for season outcomes.
Use out-of-sample backtests with strictly proper scoring rules like Brier score or log loss and check calibration plots to ensure predicted probabilities match observed frequencies.
Normalization is recommended, and per-possession rates are preferred when pace varies; choose per-minute or per-possession based on data availability and the sport's structure.
References
- https://blogs.fangraphs.com/how-our-playoff-odds-work/
- https://blogs.fangraphs.com/2025-zips-projections-are-live/
- https://theanalyst.com/na/2024/08/how-the-opta-supercomputer-makes-predictions/
- https://www.ncaa.com/news/basketball-men/article/2024-11-18/net-rankings-explained
- https://statsbomb.com/articles/soccer/introducing-on-ball-value-2-0/
- https://www.fundedplays.com/challenges
- https://doi.org/10.1198/016214506000001437
- https://journals.sagepub.com/doi/10.1177/22150218251410737
- https://ipar.ecu.edu/wp-content/pv-uploads/sites/130/Enrollment-Projection-with-Monte-Carlo-Simulation-Franklin-Zhou.pdf
- https://andrewparker.medium.com/monte-carlo-simulation-of-sales-pipeline-projected-yield-2ce496179e52
- https://www.fundedplays.com
- https://www.fundedplays.com/blogs
- https://www.fundedplays.com/blogs/how-fundedplays-evaluations-work