
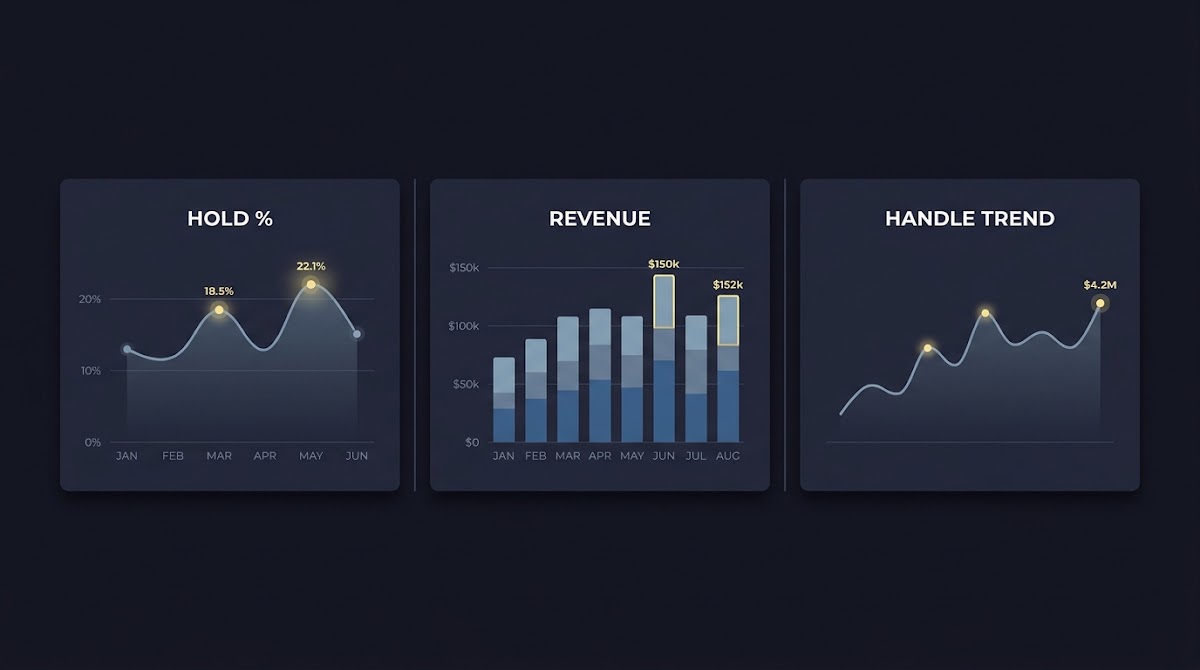
What hold and break percentages mean
Definitions at a glance: Using Hold and Break Percentages
The term hold percentage describes the share of total handle that bookmakers keep as gross revenue, calculated as gross sports betting revenue divided by total handle; this ratio is routinely published or derivable from official regulator reports, which makes the number auditable in practice American Gaming Association revenue tracker. Official jurisdiction statistics
Break, or break-even percentage, is the implied probability embedded in the odds that a bettor needs to achieve to neither lose nor gain money in the long run. For American odds the formula is straightforward: for negative odds use magnitude divided by magnitude plus 100, and for positive odds use 100 divided by odds plus 100. A common example is -110 implying 52.38 percent and +150 implying 40.0 percent, which gives a clear benchmark for comparing a bettor's hit rate against market pricing Investopedia implied probability overview.
Book margin, also called overround, is the amount by which the sum of implied probabilities for all mutually exclusive outcomes exceeds 100 percent. That excess represents the theoretical edge the book embeds in its prices and is the origin of why bettors must clear a higher-than-50 percent raw win rate to be profitable against standard vig structures Pinnacle explanation of betting margins.
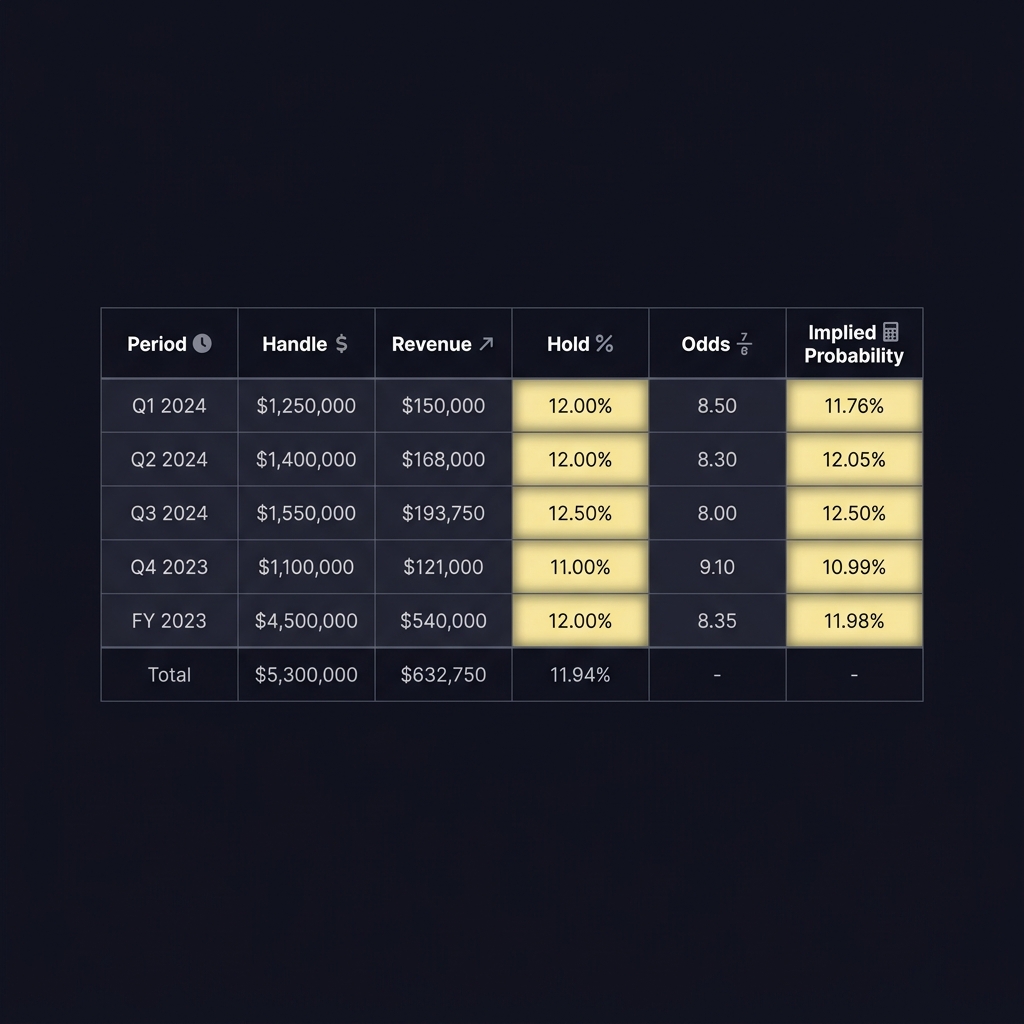
These terms are useful because they let analysts convert published jurisdiction numbers or market prices into comparable metrics. Hold and overround make it possible to compare different books, different states, and different time periods on the same, auditable basis.
Quick formulas and a simple calculator you can build
Formula for hold
At its simplest, hold equals gross revenue divided by handle. In a spreadsheet that means one cell for revenue and one for handle, and a third cell with the formula =Revenue/Handle to produce hold as a decimal or percentage. This direct computation is the same definition used in public reporting and yields an auditable number when the underlying revenue and handle come from regulator tables Nevada Gaming Control Board reports.
Converting American odds to implied probability with examples
For American odds the implied probability formulas are:
- Negative odds: implied probability = magnitude / (magnitude + 100). Example: at -110, implied probability = 110 / 210 = 52.38 percent.
- Positive odds: implied probability = 100 / (odds + 100). Example: at +150, implied probability = 100 / 250 = 40.0 percent.

Those two worked examples are the exact conversions many bettors use to check whether their historical hit rate clears the market threshold for long-run profitability Investopedia implied probability overview.
Quick spreadsheet calculator to compute hold and implied probability
Enter monthly handle and revenue then Odds as American odds
To build a simple calculator copy three cells for Handle, Revenue, and Odds, then add one formula cell for implied probability and one for hold. Use the example defaults as a check that your formulas convert values correctly before you feed real regulator numbers or your own results into the sheet. See our spreadsheet example.
Where to get reliable data: regulator reports and industry trackers
State regulator reports you can use
State-level regulators publish the core inputs needed to compute hold because they report handle and gross gaming revenue with regular periodicity; for example Nevada offers monthly tables with handle and revenue that let you compute jurisdiction-level hold directly from the published numbers Nevada Gaming Control Board reports. State monthly reports
New York and Massachusetts publish similar reports, often with weekly or monthly breakdowns, so you can download period tables, sum handle and revenue where needed, and compute hold for specific windows or sport mixes to compare against national snapshots New York State Gaming Commission sports wagering weekly reports. You can also consult other jurisdiction tables such as monthly sports wagering revenue reports for additional samples.

National trackers like the commercial gaming revenue summaries published by industry groups provide snapshots that are useful for high level comparisons, but they are best used together with regulator tables when you need auditable jurisdiction-level hold calculations American Gaming Association revenue tracker. See industry summaries such as aggregated statistics.
When you download regulator spreadsheets watch for how each report defines gross revenue and whether the tables apply any adjustments for promotional credits, since those definitions affect whether you should calculate hold from the reported gross revenue or apply a different reconciliation step.
Step by step: compute hold and compare it to your hit rate
A reproducible workflow
Start by collecting three columns in a spreadsheet: period label, handle, and gross revenue. Use the period granularity that matches your decision horizon, for example monthly if you want to track changes tied to seasonal sport mix or promotions. Compute hold with =Revenue/Handle in a new column and format the result as a percentage. If you compute implied probability for the market price, add a column that converts American odds to implied probability using the formulas shown earlier Investopedia implied probability overview.
Next compute your own historical hit rate using the same period selection and event definition. For a simple check, tally number of wins divided by number of bets for the same sample and compare that hit rate to the market break-even implied probability for the average offered price in that sample. This direct comparison shows whether your observed accuracy currently exceeds the market threshold implied by prices Pinnacle on betting margins.
Compute market break-even from posted odds and compare it to your historical hit rate on a matched sample, adjust for sample size and promotions, and only act when the advantage persists across robust splits and time periods.
Finally, interpret the result conservatively. If your hit rate is above the break-even implied probability by a small margin, ask whether sample size, changes in sport mix, or promotions could explain the gap before concluding you have a durable edge. Keep timestamped copies of regulator downloads and your calculation sheet so you can replicate any later audits of the numbers.
How book margins and overround affect long run profitability
Market margin explained
Market margin, or overround, arises because a book’s prices convert to implied probabilities that sum to more than 100 percent across mutually exclusive outcomes; the excess is the theoretical house edge embedded in price and is the same mathematical phenomenon as the hold derived from aggregate revenue and handle Pinnacle explanation of betting margins.
That embedded edge means bettors who simply win at 50 percent of wagers will typically face a loss on straight prices that include a standard vig, because the market break-even is larger than 50 percent for many common price formats. Understanding overround helps you translate price structure into the precise hit rate you need for long-term breakeven or profitability.
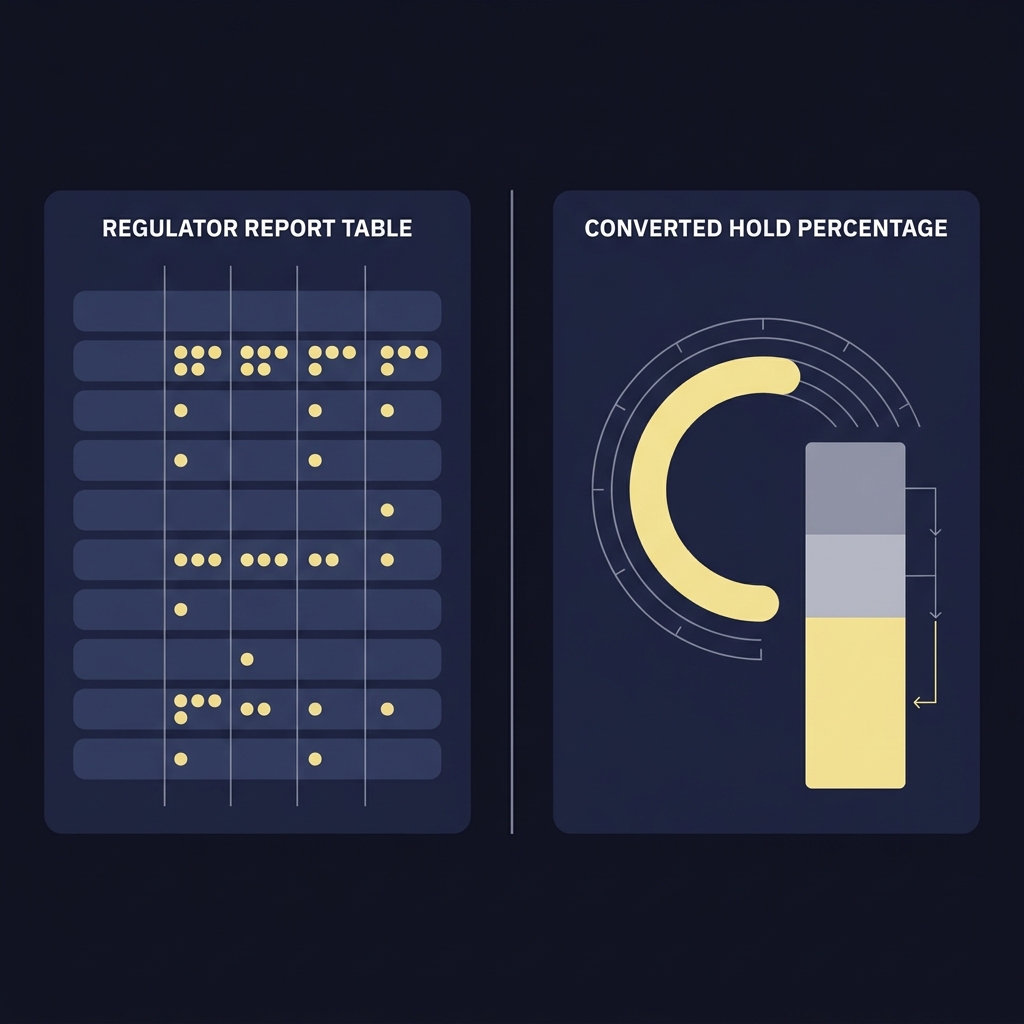
Analysts therefore often track both the theoretical market margin computed from posted prices and the realized hold computed from reported revenue and handle so they can see if promotional activity or product mix creates divergence between the two measures.
Common mistakes and pitfalls to avoid
Calculation errors
A frequent mistake is using net revenue instead of gross revenue when computing hold, or not recognizing that a regulator report may present adjusted figures; always check the report definition and use gross sports betting revenue for a direct hold calculation unless the jurisdiction explicitly defines revenue differently Massachusetts Gaming Commission sports wagering revenue reports.
Another error is summing different event types or time periods without adjusting for sport mix or promotions. Because hold can vary significantly by sport and by promotional intensity, create separate sheets or pivot tables to isolate those effects before drawing conclusions about which markets are more favorable.
Test the spreadsheet checklist and track regulator releases
If you want to test the spreadsheet checklist in this article, download the template and sign up for update alerts so you can track regulator releases and improve your workflow over time.
Behavioral traps
On the behavioral side, avoid over-interpreting short samples and chasing perceived edges after a few winning days. Discipline and consistent recording of timestamps, prices, and outcomes are often the difference between a repeatable method and a spurious result.
Practical checks include cross-checking regulator numbers against industry trackers and running your formulas on the worked examples in this guide to confirm the sheet behaves as expected before using it for decision making.
Practical examples and scenarios you can replicate
Example 1: compute a jurisdiction hold
Suppose a regulator table reports monthly handle of 1,000,000 and gross revenue of 85,000 for a single month. Using the hold formula, hold = 85,000 / 1,000,000 = 0.085, or 8.5 percent. That is the exact calculation you will perform on published regulator tables to produce an auditable jurisdiction hold value Nevada Gaming Control Board reports.
When you run this calculation across multiple months and sports you can build a dashboard that shows how hold changes with sport mix or promotional campaigns, and you can flag months where the realized hold diverges from the theoretical margin you compute from prices.
Example 2: compare a bettor record to market break-even
Take a hypothetical bettor who in a sample of 1,000 single bets wins 540 times, so the observed hit rate is 54.0 percent. If the average market price in the same sample converts to an implied probability of 52.0 percent, the bettor is ahead of the break-even threshold by 2 percentage points. Before declaring a sustainable edge, check sample variance, whether the average price reflects the true distribution of prices taken, and whether promotions affected realized value during the sample period Pinnacle on margins and pricing.
Sensitivity checks are useful: re-run the comparison excluding parlay bets, or segment by sport, and see if the advantage persists. If it does, expand the sample and continue to collect timestamped evidence to support any decision to allocate more attention to that market.
Putting it together: make better decisions with hold and break
Decision criteria and next steps
Use a simple decision checklist: 1) compute jurisdiction or market hold from regulator numbers, 2) compute market break-even from offered odds, 3) compute your historical hit rate on a matched sample, and 4) test for sample robustness and promotion effects before acting. This process turns raw numbers into a repeatable decision framework for allocating effort across markets. Learn more on our blog.
Revisit assumptions when you observe changes in sport mix, encounter new product types like same-game parlays, or when regulator releases indicate a sustained shift in realized hold. Periodically update your spreadsheet with fresh regulator tables and re-run the comparisons to detect regime shifts in pricing or promotions. You can also check resources on Funded Plays.
When to revisit your assumptions
As a practical rule, update your analysis when a regulator posts a major quarterly or annual change, or when industry trackers publish a new snapshot that suggests national hold patterns have shifted. Keep in mind that short-term promotions can move realized hold substantially for a period, so treat promotion windows as separate experiments rather than as baseline market conditions American Gaming Association revenue tracker.
Hold is gross sports betting revenue divided by total handle, usually computed from regulator reports that list revenue and handle for a period.
Break percentage is the implied probability of the offered odds and indicates the hit rate required to break even against those odds in the long run.
Yes, promotions and bonus credits can reduce realized hold relative to theoretical margins, so treat promotional periods separately when analyzing profitability.
References
- https://www.americangaming.org/resources/commercial-gaming-revenue-tracker/
- https://rg.org/statistics/us
- https://www.investopedia.com/terms/i/implied-probability.asp
- https://www.pinnacle.com/en/betting-resources/educational/how-to-calculate-betting-margin
- https://gaming.nv.gov/index.aspx?page=149
- https://www.fundedplays.com/blogs/how-fundedplays-evaluations-work
- https://sbg.colorado.gov/sports-betting-monthly-reports
- https://gaming.ny.gov/gaming/sports_wagering_weekly_reports.php
- https://www.njoag.gov/about/divisions-and-offices/division-of-gaming-enforcement-home/financial-and-statistical-information/monthly-sports-wagering-revenue-reports/
- https://www.fundedplays.com/challenges
- https://massgaming.com/news-events/sports-wagering-revenue-reports/
- https://www.fundedplays.com/blogs
- https://www.fundedplays.com