
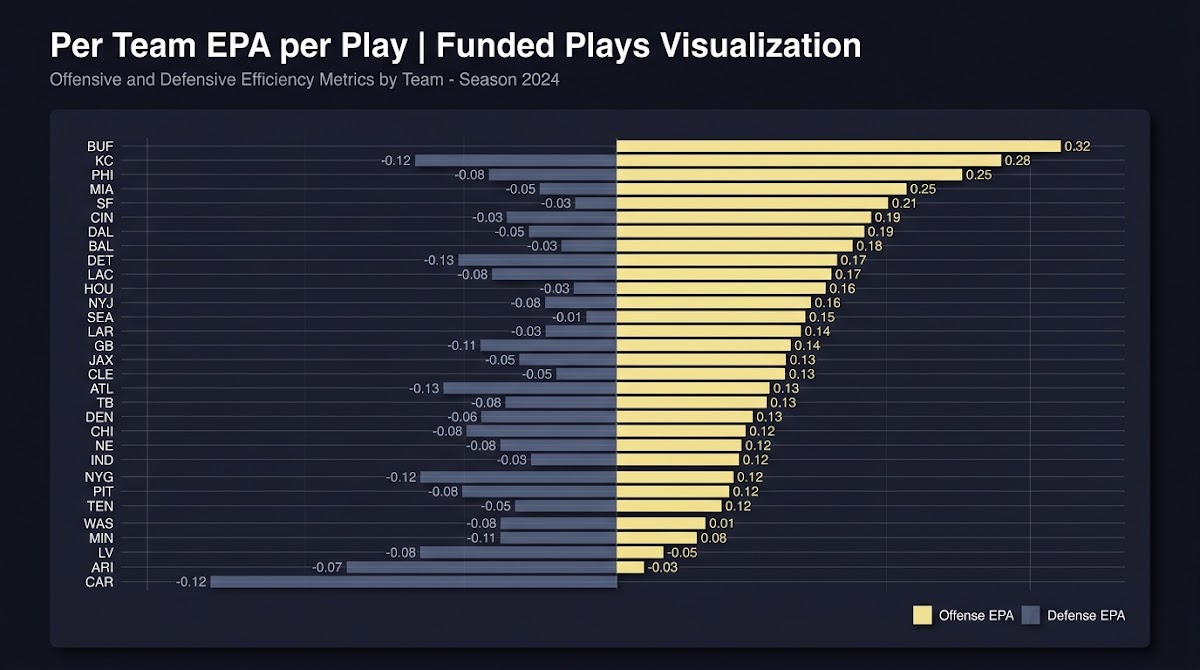
Using EPA to Evaluate NFL Teams
Expected Points Added is a core efficiency metric that measures the change in expected points from before to after a play, and it is widely used to evaluate team offense and defense; practitioners often build on open play-by-play data to compute these values for each team, season, and split nflfastR expected points article and nflfastR GitHub.
Team-level EPA per play and common splits, such as offense versus defense or pass versus run, are available from public analytics tables and dashboards, which makes it feasible for analysts to reproduce many published rankings using source play-by-play data Pro-Football-Reference 2024 advanced stats.
Practice EPA-based analysis with structured challenges
Read on for step-by-step workflows you can run with open data and reproducible code examples below.
This guide is written for sports analysts, advanced fans, and data-minded players who want practical recipes for computing and interpreting EPA. It emphasizes reproducibility and clear documentation of filters, model choices, and opponent adjustments.
What is Expected Points Added (EPA)?
Formally, Expected Points Added for a play is EPA = EP_end minus EP_start, where EP is the expected points value of the possession state; that arithmetic is the foundation of the metric and underlies how play outcomes are valued nflfastR expected points article.
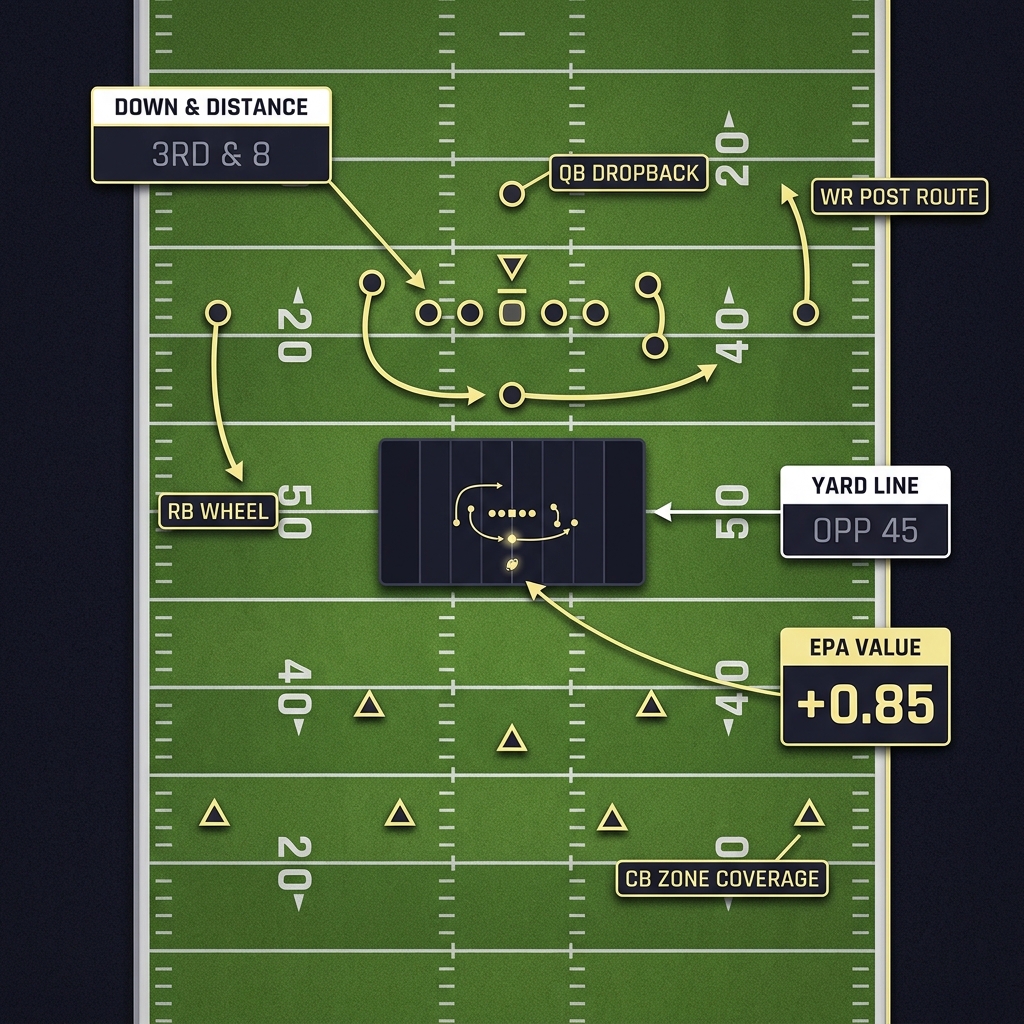
EPA captures many events that change the scoring expectation: touchdowns and field goals move EP sharply up for the scoring team, turnovers transfer expected points to the opponent, and non-scoring events such as sacks or penalties can shift EP by changing field position or downs; glossaries and method notes summarize these outcome types and typical directional impacts Sports Info Solutions glossary.
How EP models are built: features and modeling choices
Open-source EP models typically include contextual inputs like down, distance, yard line, time remaining, timeouts, and score differential; these features capture the possession state needed to estimate expected points for a play nflfastR expected points article and package documentation README.
Practitioners use a range of model families from generalized additive models to tree-based or gradient boosting approaches, trading interpretability and smoothness against flexibility and predictive accuracy; community writeups discuss these practical tradeoffs and reproducibility considerations RBSDM methodology notes and nflfastR model notes.
Inspect open-source EP implementations for reproducibility
Document choices and save code
When choosing a model form, document why specific variables are included and how special teams or penalty plays are handled; transparent documentation makes reproducing EPA-based rankings straightforward and defensible nflfastR expected points article.
Calculating EPA per play and aggregating to team metrics
At play level the arithmetic is simple: EPA_play equals EP_end minus EP_start, and the same EP model is used to compute both values for a possession state so that each play has a signed EPA value that reflects the play outcome nflfastR expected points article.
To create team-level metrics, compute the mean EPA over a teams offensive snaps for offensive EPA per play and average the EPA values opponents generate on the teams defensive snaps for defensive EPA per play; many dashboards publish these per-play aggregates alongside per-game totals for benchmarking Pro-Football-Reference 2024 advanced stats.
Analysts should be explicit about aggregation choices, for example whether metrics are weighted by snap counts or presented as unweighted per-play means, because these choices affect comparability across teams with different usage patterns RBSDM interactive stats dashboard.
Filtering garbage time and accounting for game script
Garbage time denotes low-leverage game periods where the score makes outcomes largely deterministic and those plays can bias EPA if left unfiltered; unfiltered play sets sometimes inflate or deflate team efficiency depending on how late-game drives play out RBSDM methodology notes.
Common filters remove plays when the score differential exceeds a chosen threshold or when the remaining time and score imply low leverage; practitioners document the exact thresholds they use because different cutoffs change rankings and interpretation RBSDM methodology notes.
Use open play-by-play data, adopt a clear EP model or load a published EP table, apply documented filters and opponent adjustments, compute per-play aggregates, and validate your results against public dashboards while recording all choices for reproducibility.
When you apply garbage-time filters, rerun your team aggregations and note which teams move the most in the standings; documenting those sensitivity checks is standard practice in open analyses RBSDM interactive stats dashboard.
Opponent-adjusted EPA and schedule-strength context
Raw EPA metrics are sensitive to strength of competition, so analysts commonly produce opponent-adjusted EPA to contextualize team performance against the quality of opponents faced; public dashboards provide both raw and adjusted leaderboards for comparison RBSDM interactive stats dashboard.
Simple adjustment approaches include averaging opponent defensive EPA against a team or fitting a regression to remove schedule effects, while more sophisticated pipelines use iterative adjustment or hierarchical models; the main point is to be explicit about the chosen approach when presenting an adjusted ranking Journal of Quantitative Analysis in Sports paper.
Interpreting EPA: decision criteria and benchmarks
EPA per play is a scale that lets you compare team-level efficiency across offenses and defenses, but effect sizes should be interpreted with care and in context; cross-checking with published leaderboards helps ground your reading of the metric Pro-Football-Reference 2024 advanced stats.

When deciding whether a difference in EPA per play is meaningful, consider sample size, the role of opponent adjustments, and the filters you applied; use season aggregates for high-level ranking and per-play splits for matchup-specific insights RBSDM interactive stats dashboard.
Common errors and pitfalls when using EPA
A frequent mistake is using unfiltered play sets that include obvious garbage-time sequences or mis-tagged special teams plays; these issues produce biased team estimates unless addressed in preprocessing RBSDM methodology notes.
Modeling pitfalls include omitting contextual variables like timeouts or score differential, or selecting a model family without validating accuracy and calibration; always validate EP models on held-out data and spot-check plays for plausible EP values nflfastR expected points article.
Interpretive traps include overfitting to small sample splits and treating EPA ranks as guarantees; EPA is an estimated efficiency metric and should be presented with uncertainty and sensitivity checks Journal of Quantitative Analysis in Sports paper.
Practical example workflows and scenarios
Example 1 sketch to reproduce a public ranking: export play-by-play data for the season, compute EP values with a chosen open model or load a published EP table, calculate EPA per play, aggregate by team for offense and defense, then compare your rank order to a public dashboard for validation nflfastR expected points article.
Example 2 sketch for a sensitivity check: fit two EP models with different families or alter your garbage-time threshold, recompute team EPA per play for each variant, and report which teams move significantly; document the exact code and parameters you used RBSDM interactive stats dashboard.
Case study outline: building a reproducible team ranking
Data sources to use include open play-by-play feeds and published team EPA tables; cross-check your aggregates against public dashboards to confirm you are in the right range before deeper analysis Pro-Football-Reference 2024 advanced stats.
Validation steps should include spot-checking raw plays for implausible EP values, confirming your sample definitions and filters match those used in your benchmark, and versioning code so results can be reproduced later RBSDM interactive stats dashboard.
Advanced topics: model selection, opponent adjustment methods, and sensitivity
Interpretable models like GAMs make it easier to explain how EP changes with yard line or time remaining, while flexible models such as gradient boosting may improve predictive performance at the cost of transparency; document your rationale for the chosen approach RBSDM methodology notes.
Recommended sensitivity tests include alternate garbage-time thresholds, different opponent-adjustment specifications, and bootstrapped uncertainty estimates to show how stable your rankings are across plausible choices Journal of Quantitative Analysis in Sports paper.
How to cross-check published team EPA rankings
Sanity checks include verifying play filters and sample definitions, confirming your EP model inputs match community practice, and checking special teams and penalty handling to explain any large discrepancies Pro-Football-Reference 2024 advanced stats.
If your reproduced ranking diverges from a published dashboard, report the differences and iterate on filters and model choices rather than discarding your results; transparency about methods helps reconcile discrepancies RBSDM interactive stats dashboard.
Ethics, limitations, and communicating uncertainty
EPA is an estimated quantity that depends on modeling and filtering choices, so avoid overclaiming and clearly list assumptions when sharing results with stakeholders Journal of Quantitative Analysis in Sports paper.
For platforms that host skill-based challenges, it is appropriate to cite EPA-based analyses as educational inputs while making no promises about earnings; Funded Plays can serve as an example of a platform where participants practice prediction skills in structured challenges Sports Info Solutions glossary.
Checklist and next steps for readers
Reproducibility checklist highlights: choose and record your EP model, define and document garbage-time filters, decide on opponent-adjustment method, compute per-play aggregates and cross-check with public dashboards, and version your code and data for later review nflfastR expected points article, and see our blog for related posts.

Recommended small experiments to run: reproduce a published team EPA per play ranking, test two garbage-time thresholds to see ranking sensitivity, and compare a GAM to a tree-based model on a held-out season; document the results and the code you used RBSDM interactive stats dashboard.
Recommended small experiments to run: reproduce a published team EPA per play ranking, test two garbage-time thresholds to see ranking sensitivity, and compare a GAM to a tree-based model on a held-out season; document the results and the code you used RBSDM interactive stats dashboard.
Recommended small experiments to run: reproduce a published team EPA per play ranking, test two garbage-time thresholds to see ranking sensitivity, and compare a GAM to a tree-based model on a held-out season; document the results and the code you used how evaluations work.
EPA measures the change in expected points caused by a play and accounts for field position, downs, and game context, while points per game is a raw scoring total without that contextual weighting.
Basic scripting and familiarity with play-by-play data are sufficient to reproduce published EPA tables; more advanced models help improve accuracy but are not required for initial experiments.
Opponent-adjusted EPA is useful for context, especially when teams have faced much stronger or weaker schedules, but report both raw and adjusted metrics and document your method.
References
- https://www.nflfastr.com/articles/expected-points.html
- https://github.com/nflverse/nflfastR
- https://www.pro-football-reference.com/years/2024/advanced.htm
- https://www.sportsinfosolutions.com/glossary/expected-points-added-epa/
- https://rbsdm.com/about/
- https://rbsdm.com/stats/
- https://www.degruyter.com/document/doi/10.1515/jqas-2018-0086/html
- https://www.fundedplays.com/challenges
- https://www.opensourcefootball.com/posts/2020-09-28-nflfastr-ep-wp-and-cp-models/
- https://cran.r-project.org/web/packages/nflfastR/readme/README.html
- https://www.fundedplays.com
- https://www.fundedplays.com/blogs
- https://www.fundedplays.com/blogs/how-fundedplays-evaluations-work