
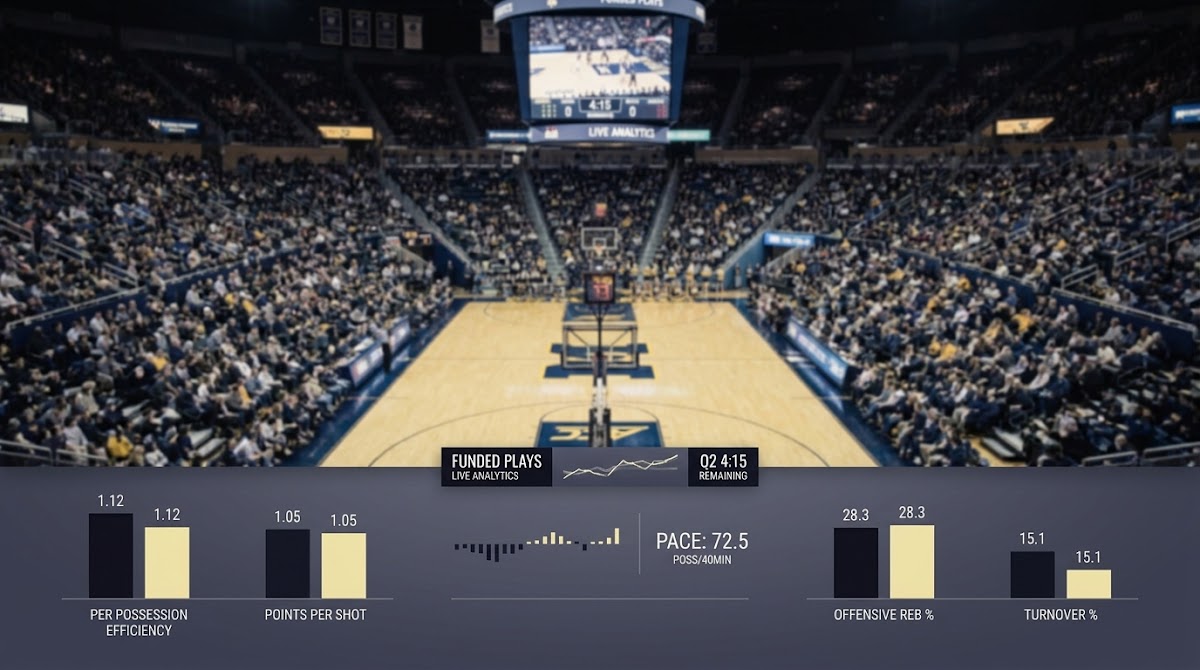
Using Efficiency Ratings in College Basketball: What they are and why they matter
Using Efficiency Ratings in College Basketball are per-possession measures that convert raw box score totals into a common unit so you can compare teams that play at different speeds. In practice, these ratings answer a simple question: how many points does a team score or allow for each possession it uses, instead of how many points it scores in a full game. (Efficiency Ratings Explained)
Think of efficiency as normalizing performance. A team that scores 80 points in 90 possessions looks very different from a team that scores 80 points in 70 possessions. Per-possession figures remove the distortions that pace creates and allow a fairer head-to-head or historical comparison.
Why possessions matter in college basketball. College games vary widely in tempo, and raw counting stats like points, rebounds, or assists can be misleading when teams play at different paces. Measuring output per possession instead of per game gives you tempo-free stats that focus on quality rather than opportunity.

When efficiency metrics add clarity and when they can mislead. Efficiency ratings are most useful for comparing teams against similar competition, for spotting whether a team is truly better on offense or defense, and for adjusting expectations when tempo shifts. They can be less reliable in small samples, when injuries change roles, or when lineup chemistry has not stabilized.
Simple example: Team A averages 1.10 points per possession while Team B averages 1.00, but Team B plays 10 more possessions per game. The per-possession gap shows Team A has the cleaner offense, while raw scoring totals might make Team B look more productive.
Practice a per-possession checklist
Try a short per-possession checklist on the next game you evaluate to see how pace reshapes the comparison and to build better instincts.
How common efficiency metrics are calculated
Basic formulas in words
Offensive efficiency is a plain idea: how many points a team scores for each possession it uses. Defensive efficiency mirrors that, showing how many points a team allows per possession. Net efficiency is the difference between offensive and defensive efficiency and is often the most useful single number for summarizing team strength.
These metrics are not about counting stats directly. They use a possession-based denominator so scoring, turnovers, and rebounds are all evaluated relative to opportunities, not game length.
Possessions: the core unit

A possession is a single opportunity to score that ends in a made field goal, a turnover, or a defensive rebound after a missed shot. Thinking in possessions aligns evaluation across teams that play fast or slow. It is the common currency for tempo-free stats and lets you compare offense to defense on equal footing.
Because possessions are the denominator, small changes in possessions can shift efficiency numbers noticeably. That sensitivity is useful for insight but also a reason to treat early-season or limited-sample values with caution.
What adjusted means in adjusted ratings
Adjusted efficiency attempts to correct raw offensive, defensive, or net numbers for factors like opponent quality, venue, and pace differences. The goal is to estimate how a team would perform on a neutral field against a neutral schedule, which helps in ranking teams from different conferences or with very different schedules. See KenPom's ratings glossary for one popular explanation of adjusted ratings.
Adjusted metrics do not promise perfect answers. They reduce bias from schedule and home-court effects, but they still depend on the underlying data and assumptions used for adjustment, which is why adjustment methods and transparency matter when you compare sources.
Using Efficiency Ratings in College Basketball: Key metrics and what each reveals
Offensive and defensive efficiency
Offensive efficiency signals how effectively a team turns possessions into points. A higher offensive efficiency suggests better shot selection, finishing, and free throw generation relative to opportunity. Defensive efficiency indicates how well a team prevents opponents from scoring per possession, reflecting contesting shots, forcing turnovers, and limiting second chances.
Neither number tells the full story. Use offensive efficiency to flag teams that create clean looks and use defensive efficiency to highlight teams that disrupt opponent rhythm. Consider both together for a full picture.
Efficiency ratings recast performance in per-possession terms so teams that play fast or slow can be compared on the quality of each opportunity rather than on raw totals.
Tempo and possessions
Tempo measures how many possessions teams play per unit time. A high-tempo team may score more points but might also give opponents more opportunities. Efficiency helps separate volume from effectiveness, showing whether a team is scoring more because of more chances or because of better offense per chance. See notes on adjusted tempo for context on pace measurements.
When comparing teams, inspect both pace and per-possession numbers. The combination reveals whether a team is productive because it forces turnovers and scores quickly, or because it grinds possessions into efficient looks.
Adjusted metrics and luck-related indicators
Adjusted efficiency helps account for opponent strength, while luck-related indicators such as effective field goal percentage regression or free throw luck can warn you that a team may not sustain current success. These signals are complementary: efficiency tells you the level, and luck indicators tell you how stable that level might be.
Always treat single-season spikes with caution and use adjusted metrics to temper extreme readings when the schedule is unbalanced or early in the campaign.
Translating efficiency ratings into scouting and game planning
Step 1, prioritize matchups. Compare a team’s offensive efficiency to an opponent’s defensive efficiency to find favorable matchups. An offense that scores well against average defenses but struggles against pressure may be exploitable when matched with a top defensive unit.
Step 2, adjust expectations by style. If a team with a strong offense prefers a slow, halfcourt style and faces a fast opponent, consider whether the game will play to the offense or allow the opponent to dictate tempo. Use tempo-free stats to predict the likely result when styles conflict.
Step 3, balance metrics with film. Numbers point you to themes to check on tape: how a team gets its shots, how rotations respond to defensive pressure, and which players generate or prevent points per possession. Combine the ratings with scouting to make informed decisions.
Actionable checklist for game planning. Rank the opponent’s top four lineup combinations by offensive and defensive efficiency, note which matchups create advantages, and assign a confidence score for whether your team can force the opponent into its less efficient scenarios.
Adjusting ratings for pace, opponent quality, and sample size
Raw efficiency early in the season can be misleading because many teams have only a handful of games and their schedules vary. A team that faces mainly weak opponents will likely show inflated numbers until it meets stronger competition.
Simple adjustments for opponent strength can be pragmatic. One approach is to view a team’s efficiency in the context of the average efficiency of its opponents. If a team has an excellent offensive efficiency but its opponents on average have poor defensive efficiency, treat the team’s number with caution.

Another practical step is to look at five-game and 10-game rolling averages to smooth short-term spikes. When sample size is small, prefer longer windows or wait for clearer signals before making firm conclusions. (See how Funded Plays evaluates rotations: how-fundedplays-evaluations-work)
Be humble with very small samples. Injuries, new rotations, and early-season experimentation can all cause efficiency numbers to move sharply. Make decisions on the basis of trends rather than isolated performances when possible.
Offensive versus defensive efficiency: trade-offs and interpretation
When offense and defense point in opposite directions, think about value and matchup. A team with an elite offense and a weak defense may still be favorable against opponents that struggle to score, while a team with a dominant defense and mediocre offense can frustrate high-scoring units.
Consider lineup depth and bench when weighing trade-offs. A deep bench can sustain intensity on one side of the ball late in games and that often shows up in split efficiency numbers between starters and reserves.
compare offensive and defensive splits in a single view
use short rolling windows for comparison
Practical pairing advice. If a favored offense faces a defense that excels at limiting transition, evaluate whether the offense can still generate high-percentage halfcourt looks. Conversely, when a strong defense meets a low-usage, high-efficiency offense, consider whether the defense can change the usage dynamics through pressure or fouling tactics.
Use opponent-adjusted numbers and bench depth to clarify trade-offs, but avoid overreacting to one game. Look for repeated patterns before you assume a team is fundamentally offensive or defensive in identity.
Using Efficiency Ratings in College Basketball: Player-level efficiency and limitations
Player-level efficiency is usually expressed per 100 possessions to give a common scale. Usage rate measures how often a player ends a team possession by shooting, turning the ball over, or drawing a free throw. Interaction between per-100 metrics and usage matters: a player with high per-100 scoring at very low usage is a different contributor than a high-usage scorer with similar per-100 numbers.
Role and minutes skew simple efficiency numbers. A bench player who posts strong per-100 numbers in limited minutes may not translate those numbers when asked to handle heavier defensive attention. Conversely, starters often look worse per-100 when their usage rises because they face tougher matchups and fatigue.
Complementary checks are essential. Play-by-play data, lineup-based efficiency splits, and adjusted plus-minus measures help validate whether a player’s box-score output reflects true impact or is the result of context such as team system or matchup quirks.
When box-score based player efficiency misleads, it is often because it misses defensive rotations, off-ball impact, or role-specific tasks like screening. Use film and advanced tracking when available to corroborate what per-possession numbers suggest.
Applying efficiency ratings to lineup and rotation decisions
Read lineup efficiency splits to spot high-variance rotations. If a particular five-man group yields a much better net efficiency than the rest of the rotation, investigate whether the difference is driven by matchup advantages, small sample luck, or a genuine chemistry boost.
Bench depth shows up in efficiency splits when the drop-off between starters and reserves is large. That signal can guide rotation adjustments: either shorten the rotation to keep efficiency high or experiment with combinations that protect leads without sacrificing offense.
Use splits by lineup to test hypotheses. If you think a different guard pairing will reduce opponent transition points, measure transition points allowed per possession for the affected lineups in a short window and compare to prior performance.
Warnings about overreacting: lineup splits can swing widely in small samples. Treat a single strong outing as a signal to test further rather than as proof that the new rotation must be permanent.
Common mistakes and pitfalls when using efficiency ratings
Overweighting small samples is the most frequent error. A couple of unusually high or low-efficiency games can create false patterns. Use rolling averages, opponent context, and longer windows to filter noise.
Ignoring context such as injuries or coaching changes leads to bad read. A sudden drop in efficiency may be due to a key player missing time or a coach experimenting with lineups, not a permanent decline in quality.
Confusing correlation and causation is another trap. Efficiency can correlate with winning, but it does not always explain why a team wins. For example, a team may win because of clutch free throws or a single player streak rather than because of systemic efficiency advantages.
Simple safeguards. Always ask what could explain the number outside of team improvement. Check injury reports, roster moves, and whether the sample includes a cluster of weak or strong opponents before acting on efficiency changes.
Practical examples and scenario walkthroughs
Example 1: Spotting a style mismatch
Scenario: Team X plays at a very high pace and relies on quick transition offense. Team Y is a slow, halfcourt defense that excels at preventing easy transition opportunities. Step 1, compare Team X's offensive efficiency to Team Y's defensive efficiency to identify whether Team X can score effectively in the halfcourt. Step 2, consider whether Team Y can impose its tempo and reduce Team X's possessions. Step 3, review lineup matchups to see if Team X has the guards to break the halfcourt pressure.
If Team X has a clear offensive efficiency edge that persists even after opponent adjustment, the matchup favors X. If not, the tempo control may tilt the advantage to Y.
Example 2: Adjusting a prediction after an injury
Scenario: A team loses a primary ball handler and its offensive efficiency falls in the next two games. Step 1, evaluate how much of the drop is due to usage redistribution versus true loss of shot quality. Step 2, inspect lineup splits to see which replacements struggle. Step 3, adjust your projection by reducing the team’s expected offensive efficiency and increasing variance until new roles stabilize.
Signal to reverse the adjustment: if replacement players begin to show consistent per-possession production over a five to ten game window, restore the prior expectation cautiously rather than immediately.
Example 3: Interpreting early-season outliers
Scenario: An early-season outlier posts unusually high offensive efficiency against weak competition. Step 1, compare the opponent-adjusted efficiency to the league median. Step 2, check rolling averages and schedule strength. Step 3, wait for nonconference play to conclude or for conference games to start before making firm ratings-based decisions.
Explicit reversal signals include a clearer schedule-adjusted regression and consistent underperformance against stronger defense over several games.
Building a simple checklist or mini-model using efficiency ratings
Suggested inputs to include: net efficiency, opponent-adjusted net, pace, turnover rate, offensive rebounding, and free throw rate. These inputs balance scoring quality, possession control, and second-chance generation.
How to weight metrics qualitatively. Give net efficiency the largest weight, opponent-adjusted net a medium weight, and pace, turnovers, and rebounding smaller weights. For example, think in tiers: primary signal, secondary context, and tie-breakers.
Validation and refinement. Backtest informally by tracking predictions over a month and noting which inputs correlated with correct outcomes. Iterate by shifting qualitative weights toward inputs that consistently improved decision accuracy.
Simple scoring format you can use now: assign 3 points if a team leads by 3 or more in opponent-adjusted net, 2 points for a 1 to 3 lead, and 0 otherwise. Add or subtract points for extreme turnover or rebounding advantages and treat the total as a confidence measure rather than a final verdict.
Practical next steps, tools, and resources to learn more
Weekly tracking habits to build: monitor net efficiency trends over rolling five and ten game windows, watch for pace shifts, and note opponent strength changes. Keep a short list of teams whose efficiency trends are diverging from expectations and prioritize them for film review. See the Funded Plays blog for related posts.
Types of data to collect: box score per-possession splits, lineup-based efficiency, and play-by-play logs where available. Prioritize the data that directly answers your questions about possession outcomes and lineup interactions. Consider the resources on the Funded Plays site to organize tracking workflows.
Avoiding information overload. Limit the number of metrics you track to those that move decisions. Too many indicators dilute focus and increase the chance of chasing noise instead of actionable trends.
Using Efficiency Ratings in College Basketball: Conclusion and how to use these metrics responsibly
Efficiency metrics measure points per possession and are most valuable when used with context. They help you compare teams across tempos, prioritize matchups, and focus scouting effort. Adjusted efficiency and tempo-free stats reduce bias but do not remove the need for judgement.
Responsible use means combining ratings with film, injury reports, and lineup analysis, and resisting the temptation to treat a single number as decisive. Use the pre-decision checklist below to keep decisions disciplined and transparent.
Pre-decision checklist: confirm opponent adjustment, check rolling averages for stability, verify no key injury or lineup change, and assign a confidence score based on matchups and bench depth.
They become more reliable as sample size grows; rolling averages over five to ten games reduce noise, and conference play usually provides clearer signals than early nonconference games.
They provide a strong baseline for expectations but should be combined with matchup context, injuries, and style differences for single-game forecasts.
Player-level per-possession metrics are useful but must be validated with minutes, role, and lineup splits to avoid misleading conclusions.