

Why Turning Bet History into Actionable Insights matters
Turning Bet History into Actionable Insights starts with the recognition that historical records are not a verdict but a source of measurable signals. A structured bet history helps separate noise from repeatable patterns by encouraging reproducible calculations and documented rules.
Estimates derived from small samples can mislead, while larger samples produce more stable metrics, a point grounded in statistical reasoning and the law of large numbers, which explains why patience and consistent logging matter over time Encyclopaedia Britannica explanation of the law of large numbers.
Keeping a clear ledger also supports safer participation. Public guidance on problem gambling recommends keeping records and setting explicit limits, a practice that aligns directly with maintaining a structured bet log and pre-defined caps on exposure NHS help for problem gambling.
What this article covers
This article gives a practical sequence you can follow: export raw bets, standardize fields, compute EV and ROI, apply conservative staking, and surface findings in dashboards. The aim is disciplined, repeatable review rather than quick fixes.

Who benefits from a structured bet-log workflow
Sports enthusiasts, experienced handicappers, and data-minded hobbyists benefit most because the workflow emphasizes measurement, versioning, and discipline. Those testing new approaches will find the audit trail especially useful for controlled experiments and comparison.
How to export and structure your raw bet history
Most platforms offer simple export options; prioritize flat-file formats like CSV or Excel for portability. Exporting to CSV gives you a row-per-bet layout that is easy to import into spreadsheets, BI tools, or analysis scripts.
As you export, include a stable schema (see example). Useful column names are: timestamp, market, selection, stake, odds, outcome, commission, cashout_amount, strategy_tag, and source_id. Keep the header row consistent across exports so automated imports do not break.
Save a raw copy of each export and add a version tag to the filename and a short changelog entry on what changed between exports. This preserves reproducibility and allows you to trace unexpected shifts to data differences.
Make sure timestamps include a time zone or are recorded in UTC to avoid aggregation errors when you compare bets placed across leagues or during schedule changes.
Start your structured review on the FundedPlays Challenges page
Export your latest bet history now and save an untouched raw copy with a clear filename so you can always revert to the original data.
Common export formats: CSV and Excel
CSV files are lightweight, broadly compatible, and ideal for scripting or loading into Power BI. Excel can be convenient for manual review but prefer CSV for automated pipelines and repeatable imports. (guide to export CSV from Power BI)
Essential fields to include in a flat-file export
Capture stake as a numeric field, record odds consistently as decimal odds if possible, and include a selection identifier that you can join back to event metadata. These simple steps keep downstream metric calculations predictable.
Cleaning and standardizing your bet log for analysis
Begin by normalizing date and time formats to a single standard, for example ISO 8601 in UTC. Next, unify market and selection names by using a mapping table so the same market does not appear under multiple names in analysis.
Standardize stake and odds columns to consistent numeric formats. Convert fractional or American odds into decimal odds early to avoid repeated conversions in your calculations.

Handle partial cashouts by recording both the original stake and the cashout_amount, and compute realized profit or loss on a per-row basis so cancelled or voided bets do not distort aggregated metrics.
Run validation checks after cleaning: compare row counts with the original export, sum stakes and compare totals to platform statements, and spot-check a handful of bets end-to-end to confirm the cleaned row produces the same outcome as the source.
Data normalization and common field mappings
Create a small mapping table that translates vendor market labels into your canonical market names. Keep the mapping separate from raw data so you can update naming rules without touching original exports.
De-duplication, time zones, and handling cancelled or voided bets
Detect duplicates by checking identical timestamps, stakes, selections, and unique transaction IDs if available. Flag voided bets explicitly and exclude them from EV calculations while keeping them in a master ledger for auditing.
Cleaning and standardizing checklist

Keep a short checklist you run after each import: verify row counts, confirm stake totals, check timezone consistency, verify mapping rules, and ensure cashouts are recorded. This lightweight habit prevents silent drift in your dataset.
Core metrics to compute: EV, ROI, hit rate, drawdown and sample considerations
Formulas and plain-language meanings
Expected Value or EV estimates the long-run average outcome of a bet and helps you assess whether a selection carries an edge. Use standard EV formulas when evaluating individual bets and aggregated portfolios to see whether your selections are, on average, positive or negative per unit staked Investopedia on Expected Value.
Build a reproducible pipeline: export raw data, standardize fields, compute EV and ROI, apply conservative staking rules like fractional Kelly, and use dashboards with rolling windows and minimum samples to guide decisions.
Return on Investment or ROI measures net profit relative to the total stake and provides a portfolio-level performance view that is easy to communicate. Compute ROI as net_profit divided by total_staked and express it as a percentage for clarity Investopedia on Return on Investment.
Hit rate is the share of bets that finish profitable, and drawdown measures the peak-to-trough loss in cumulative returns. Together these metrics describe both how often you win and how severe losing stretches are, which matter when sizing exposure.
Why sample size and rolling windows matter
By the law of large numbers, metrics such as ROI and EV become more stable as sample size grows, while short samples can show large swings that do not represent long-term performance Encyclopaedia Britannica explanation of the law of large numbers.
Use rolling windows, for example 100 to 500 bets depending on activity, to track how metrics evolve while smoothing day-to-day noise. Establish a minimum sample threshold before making structural decisions so you avoid overreacting to short runs.
Core metrics quick formulas
EV per selection can be computed as probability_of_win times net_return_if_win plus probability_of_loss times net_return_if_loss. For ROI aggregate net profit and divide by total stakes. Keep computations explicit and reproducible in code or spreadsheet formulas.
Applying staking rules: Kelly Criterion and fractional Kelly
The Kelly Criterion offers a formula for optimal proportional staking when you have a reliable estimated edge, and it expresses the fraction of bankroll to risk to maximize long-term growth under certain assumptions Investopedia on the Kelly Criterion.
Because full Kelly often produces high variance and large drawdowns, many practitioners use fractional Kelly, for example half or quarter Kelly, to temper volatility. Fractional Kelly preserves much of the growth advantage while reducing the likelihood of damaging drawdowns.
Staking rules depend critically on the reliability of your EV estimate. If your edge estimate is noisy or biased, aggressive sizing amplifies mistakes, so treat staking recommendations as conditional on data quality and sample stability.
Kelly formula and practical interpretation
Think of Kelly as a decision rule: it converts a quantified edge into a stake size. In practice calculate a conservative version and cap stakes relative to bankroll rules you define in advance.
Why fractional Kelly is commonly used
Fractional Kelly balances growth potential and psychological survivability. It is a pragmatic compromise that acknowledges model error, parameter uncertainty, and the emotional cost of large drawdowns.
Building dashboards and visualizations to surface trends
Good dashboards let you spot regime changes and rule breaches quickly. Recommended visuals include EV and ROI time-series, cumulative PnL charts, drawdown curves, hit-rate trends, and KPI tiles for current ROI, average EV, and max drawdown. (related posts)
Use filters for strategy_tag, market type, and date ranges so you can compare segments and run controlled comparisons. Small interactive elements help you test hypotheses without rebuilding reports.
Modern BI tools support KPI tiles and time-series visuals that make these monitors practical to implement Microsoft Learn guidance on creating dashboards in Power BI.
dashboard checklist to monitor bet history
start with weekly aggregates
Arrange your report with a top row of KPI tiles showing recent ROI, average EV, and max drawdown, a middle area with time-series charts, and a lower panel for segmented tables and raw rows for audit. This layout keeps summary metrics visible while retaining drilldown access.
KPI tiles, time-series charts and filters to add
Include quick toggles for rolling window length and a selector for the staking rule being evaluated. This makes it straightforward to see how metric behavior changes with different analysis settings.
Example dashboard layout and key interactions
Example interactions include clicking a drawdown region to filter the time-series to that period and selecting a strategy_tag to see whether a single approach drives portfolio performance. Keep each interaction focused and reversible to support experimentation.
Decision criteria: when to change rules, pause a strategy, or reduce exposure
Create objective triggers tied to metrics rather than relying on gut reactions. Examples include pausing a strategy if EV is negative across a minimum sample and ROI has fallen below a defined threshold for a set rolling window.
Combine the statistical caution of the law of large numbers with operational caps. For instance require a minimum sample size before applying a permanent rule change and use temporary exposure reductions while more data is collected Encyclopaedia Britannica explanation of the law of large numbers.
Document every rule change, the rationale, and the evaluation period. Where possible run A-B style comparisons between the incumbent rule and the proposed change so you can measure impact without full commitment.
Trigger thresholds tied to metrics
Sample decision rules: reduce stake sizing by half if drawdown exceeds your max permitted drawdown for the current account, pause new entries for a strategy if hit rate and EV both decline over a defined rolling window, and require at least one minimum sample before re-enabling a paused approach.
Maintaining rules that reduce emotional reactions
Pre-defining thresholds removes much of the stress-induced switching that degrades long-run performance. Discipline in execution is as important as the analytic method you use to detect problems.
Common mistakes and pitfalls when analyzing bet history
Misreading short samples is one of the most frequent errors. Selection bias and small sample sizes produce misleading ROI and EV estimates, so always ask whether the dataset is large enough to support the conclusion you are drawing Encyclopaedia Britannica explanation of the law of large numbers.
Operational mistakes also appear often: forgetting commission or fees, mishandling partial cashouts, and inconsistent stake units can all skew results. Build validation checks to catch these issues early.
Keep responsible-play practices in mind. If you notice patterns of escalating stakes or compulsive behaviour, step back, refer to written limits, and seek support resources as needed NHS help for problem gambling.
Misreading short samples and chasing patterns
Short-term streaks are common. Treat extraordinary short-run outcomes as hypotheses to test with additional data rather than as proof of a permanent shift.
Ignoring fees, cashouts, and data quality issues
Always account for commissions and ensure your net profit column includes every fee. Missing these items will bias ROI upward and give a false sense of an edge.
Practical walkthrough: from raw CSV to a dashboard and a staking decision
Step 1, import the CSV into your chosen environment and run the cleaning checklist: normalize timestamps, convert odds to decimal, ensure numeric stake fields, and map markets to canonical names. Keep the raw export untouched as an audit source.
Step 2, compute EV and ROI columns. EV helps you estimate whether selections have a positive long-term expectation, and ROI summarizes net return across stakes. Present these computed columns in a small table and validate against a handful of known bets to confirm formulas.
Step 3, build a simple Power BI report with KPI tiles and time-series charts to visualize EV and ROI over time, and add filters for strategy tags and date ranges so you can inspect segments. Power BI supports these dashboard features and KPI tiles directly Microsoft Learn guidance on creating dashboards in Power BI. (community thread on exporting visuals)
Step 4, if you see a consistent positive EV over a reliable sample, compute a fractional Kelly stake to size exposure conservatively. Fractional Kelly keeps growth potential while limiting volatility compared to full Kelly Investopedia on the Kelly Criterion.
Step 1: import and clean
Automate the import so you can reproduce the process weekly or monthly. Keep a changelog that records when mapping rules changed so you can interpret metric shifts accurately.
Step 2: compute EV and ROI
Explicitly store formulas used to compute EV and ROI in a separate worksheet or script. This ensures anyone reviewing your work can reproduce the numbers without guessing how you handled cashouts or fees.
Step 3: visualize and decide stake size
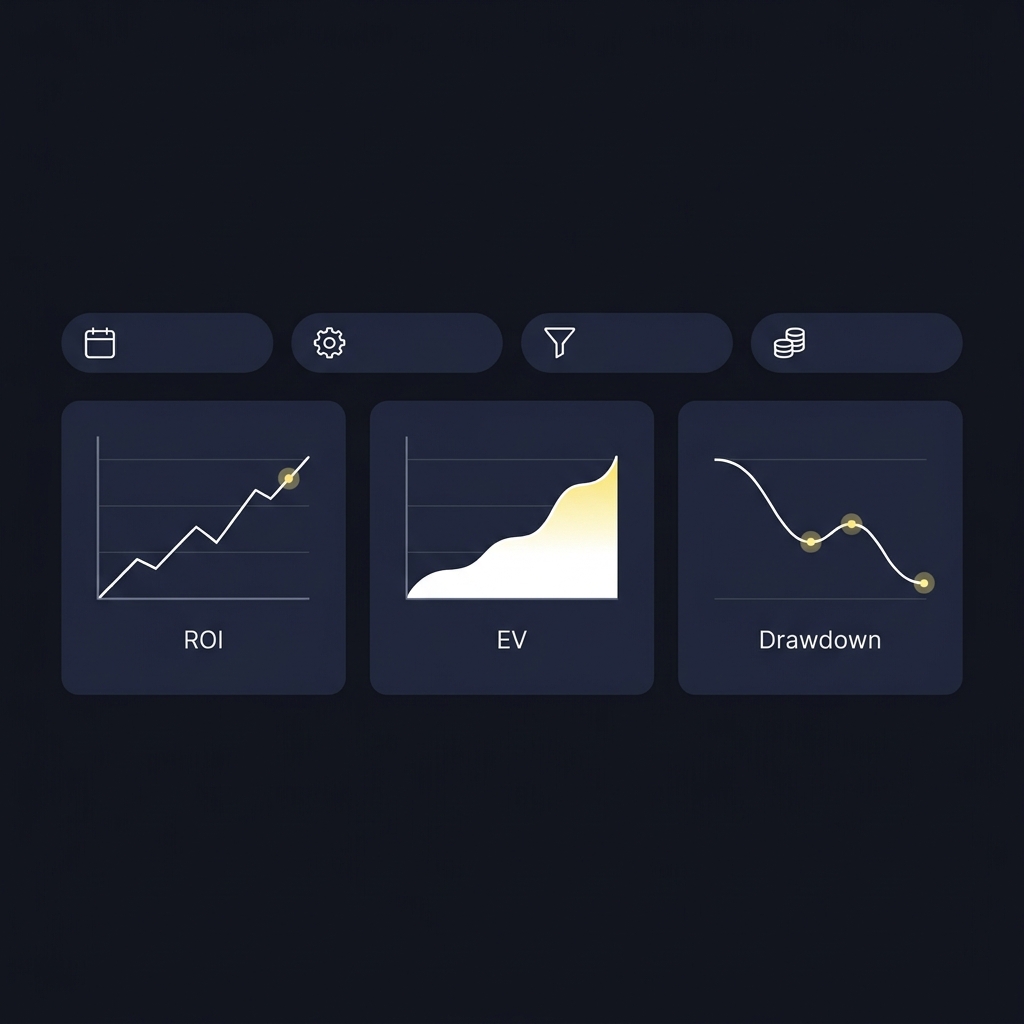
Use the dashboard to assess stability, then apply conservative stake-sizing only when sample thresholds and rolling windows indicate consistent performance. Prefer fractional Kelly scaling and caps tied to bankroll rules.
Next steps: maintaining a review cadence and iterating safely
Set a regular review cadence, for example monthly reviews for tactical adjustments and quarterly reviews for structural changes. Keep every export versioned and note rule changes in a short audit log so you can trace the effect of each decision. (Funded Plays)
Continue relying on rolling windows and minimum sample thresholds to avoid reacting to noise. Stick to documented stake caps and consider reducing exposure during periods of elevated variance regardless of short-term metrics.
If losses become persistent or behavior changes in ways that worry you, revert to pre-defined stake caps and consult support resources. Responsible participation preserves long-term optionality and wellbeing NHS help for problem gambling.
Scheduling reviews and versioning rules
Use a simple naming convention for exports and a short YAML or CSV file to record rule versions. Keep review notes concise and attach them to the corresponding export to keep analysis auditable.
Keeping analysis auditable and focused on long-term improvement
Auditable analysis and strict documentation reduce hindsight bias and make it easier to learn from past decisions. Treat the ledger as a research notebook not as proof of certainty.
Trust grows with sample size. Use rolling windows and a minimum sample threshold before treating metrics as reliable.
Full Kelly is aggressive and increases volatility. Many practitioners prefer fractional Kelly to limit drawdowns.
Keep the raw export, fix the cleaning rules, rerun validation checks, and document the change in your audit log.
References
- https://www.britannica.com/science/law-of-large-numbers
- https://www.nhs.uk/mental-health/conditions/gambling-addiction/
- https://www.investopedia.com/terms/e/expectedvalue.asp
- https://www.investopedia.com/terms/r/returnoninvestment.asp
- https://www.investopedia.com/terms/k/kellycriterion.asp
- https://learn.microsoft.com/en-us/power-bi/create-reports/service-dashboards
- https://www.fundedplays.com/challenges
- https://www.fundedplays.com/blogs/how-fundedplays-evaluations-work
- https://www.fundedplays.com/blogs
- https://www.fundedplays.com
- https://learn.microsoft.com/en-us/power-bi/visuals/power-bi-visualization-export-data
- https://alphavima.com/blog/power-bi-export-to-csv-power-automate/
- https://community.powerbi.com/t5/Power-Query/export-data-from-power-bi-visuals-to-excel-automatically/td-p/2209447