
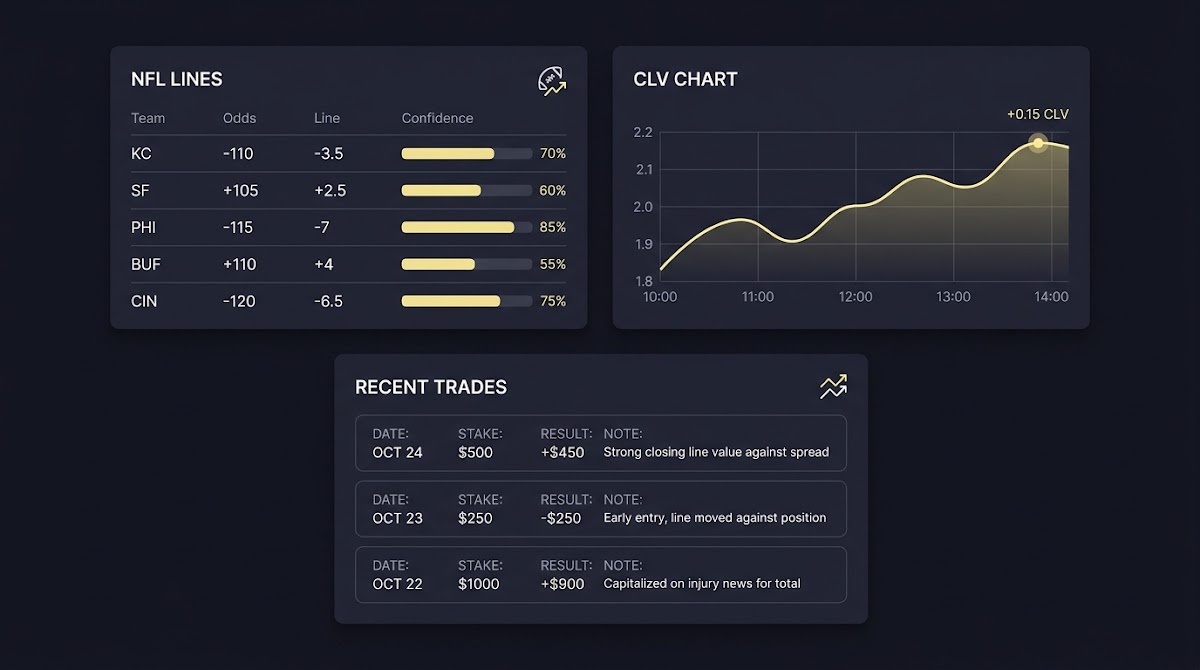
Trading NFL Favorites vs Underdogs: quick overview and what this article covers
Who this guide is for
This guide is for sports forecasters and disciplined prediction traders who want a structured method for Trading NFL Favorites vs Underdogs. It assumes you value process metrics over single results and are interested in diagnosing whether timing, price, or stake sizing drives your long run performance.
The material emphasizes three practical tools you can use immediately: closing line value as a diagnostic, monitoring open to close line movement to judge timing, and sizing with the Kelly principle or a fractional Kelly variant. See Funded Plays for related resources.
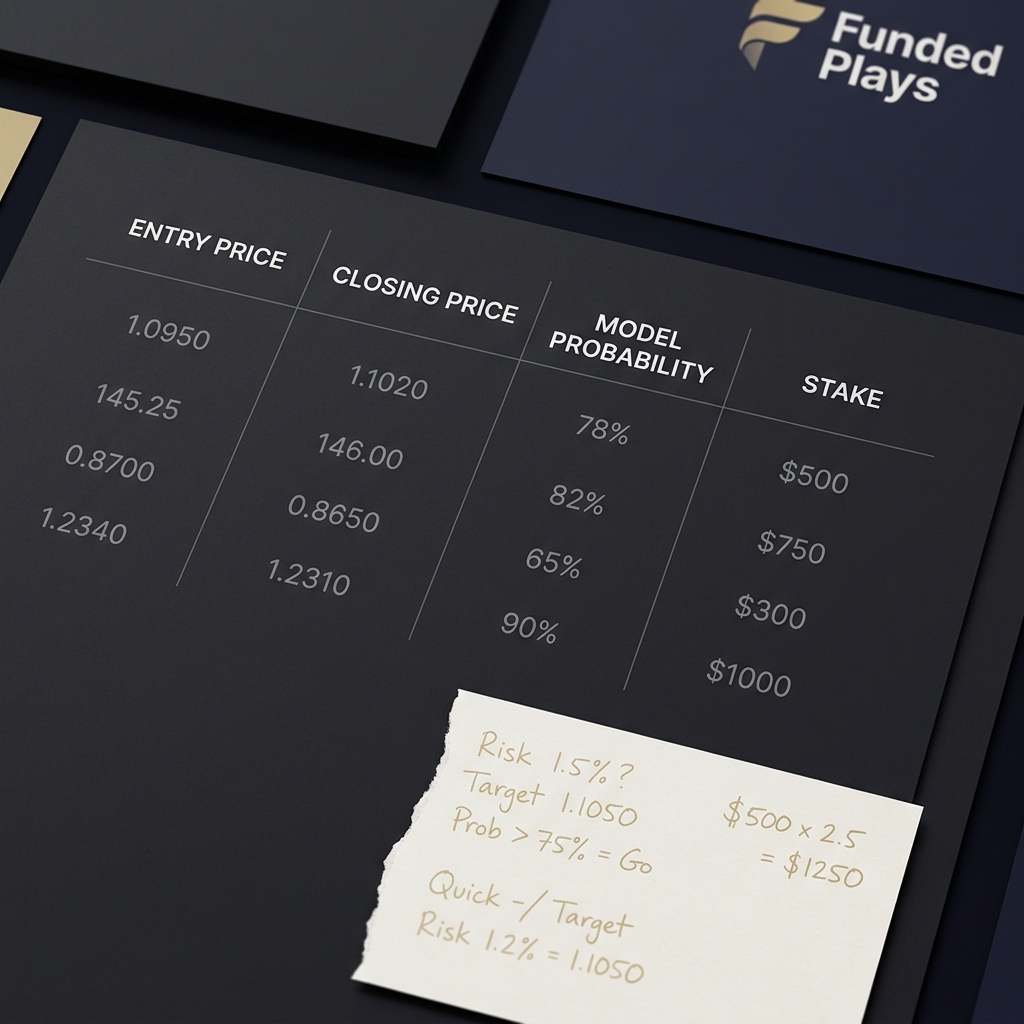
Track entry, close, model probability and stake for each trade
Use one row per selection
What we will not promise
This article will not promise guaranteed profits, easy wins, or a shortcut around sportsbook margins. It is informational and process oriented, focused on how to test and measure edges you believe you have.
Trading NFL Favorites vs Underdogs
Throughout the article we use the phrase Trading NFL Favorites vs Underdogs to describe the process of evaluating whether a price and a timing decision give you an edge versus simply choosing a side. The emphasis is on measuring whether your entries consistently beat the market at kickoff rather than declaring a side always correct.

What market efficiency, sportsbook hold, and ATS data tell us
Why sportsbook hold matters for traders
U.S. sportsbooks maintain a positive hold that makes raw side wins insufficient to claim long term advantage; traders need to overcome the embedded margin to produce positive expected value, so pricing and process matter more than a simple side preference American Gaming Association commercial gaming revenue tracker.
That structural margin means even a system that wins slightly more than half its bets can still lose money if the wins come at worse prices. Understanding bookmaker hold helps explain why focusing on closing line value and market-implied probability is essential rather than reporting only win percentages.
Season level ATS patterns and what they mean
Season data for 2024 show favorites and underdogs finishing close to 50 percent against the spread, which implies there is no simple blanket edge to back one side across the league; edges emerge from price and timing instead of side-only heuristics TeamRankings NFL ATS records 2024.
When you see a reported side win percentage, translate that into a price context: what did the market expect when those bets were offered, and did you beat the closing price consistently? Without that price context, a side win rate can mislead decision making.
Closing line value and line movement: timing your trades
What CLV measures and why it matters
Closing line value, or CLV, compares the price you obtained to the market closing price at kickoff and is an established diagnostic to see if your timing and sizing add value over many bets Pinnacle closing line value explained. See additional analysis at ClevAnalytics.
CLV is a process metric: a single win or loss does not validate a method, but a persistent positive CLV across many selections indicates you beat the market at the most liquid price point.
Open to close line movement and information flow
Pre-game prices typically tighten as kickoff approaches because liquidity increases and more information is incorporated into the market; early mispricings can vanish by the close so tracking open to close movement is central to deciding when to trade Pro-Football-Reference 2024 games and lines, and resources such as OddsJam explain tracking approaches.
Use open-to-close patterns to judge whether your model gains or loses relative to late market consensus. If you consistently lose CLV on entries you believed were edges, the timing or probability calibration needs review rather than the idea alone.
Practice CLV tracking and disciplined staking with a challenge
Download a simple CLV tracking template or start a trial challenge to practice entry and timing in a funded environment.
Favorite longshot bias and where mispricing can appear
What the favourite longshot bias is
The favourite longshot bias describes the empirical tendency for longshots to be overbet and favorites to be underbet in many wagering markets; this pattern is documented in academic reviews and suggests mispricing can concentrate at the extremes of available prices Survey of the favourite longshot bias. Further commentary appears in pieces like Sharp Football Analysis on CLV.
Limits to exploiting the bias in NFL spreads
Even where the bias exists, it does not automatically produce exploitable opportunities in NFL spreads without precise probability and price calibration. The market is competitive and seasonal ATS splits around 50 percent show that broad side bets are unlikely to be a repeatable edge.
Practical opportunities tend to appear when you can show a consistent, model-driven divergence from the closing price in a direction that aligns with an understood market friction, for example extreme public skew or a late information advantage that you can quantify.
Sizing and risk control using Kelly and fractional staking
Kelly criterion basics
The Kelly criterion is a framework that links estimated edge and odds to a recommended stake size, aiming to maximize long run geometric growth when probability estimates are accurate Investopedia Kelly criterion definition.
Kelly requires a credible estimate of edge; overconfident or noisy probability inputs make full Kelly volatile, so most practitioners prefer fractional Kelly to limit drawdowns and protect capital while still scaling with assessed edge.

Why fractional Kelly is common in practice
Fractional Kelly reduces variance and lowers the probability of ruin when your edge estimates include noise. In evaluation or funded-challenge settings, preserving capital matters because drawdown limits are often part of account rules and consistent survival allows you to demonstrate process quality over a defined sample.
Aligning stake size with drawdown constraints and evaluation windows keeps trading consistent with the funded challenge mindset: test strategy, document entries and exits, and protect capital while you measure CLV and outcome distributions.
Decision framework: when to trade favorites or underdogs
Price first not side first
Trade based on a price discrepancy, not a side bias. Start by estimating your model probability for an outcome, convert that to a market-implied probability and only consider a trade when the divergence is material enough to cover sportsbook hold and transaction costs Pinnacle closing line value explained.
A simple rule is: estimate probability, map to fair odds, compare to market odds, and if your implied edge survives a conservative sizing rule you can proceed. This keeps the process focused on value rather than loyalty to favorites or underdogs.
Checklist to evaluate a trade idea
Use a checklist: record entry price, estimate model probability, note expected closing price range, check recent open-to-close movement for that market, and set a fractional Kelly stake. Track the same items consistently so CLV and stake decisions can be audited later TeamRankings NFL ATS records 2024.
Signals that may favor underdogs over favorites include extreme public splits that push a price beyond fair odds, late drift aligned with sharp money, or model confidence that remains robust after sensitivity checks. Conversely, favorites can be attractive when market smoothing hides value and your model identifies persistent underpricing.
Common mistakes and how to avoid them
Mistakes in pricing and timing
A common error is treating raw side win rates as evidence of an edge without considering sportsbook margin and price context; that mistake leads to persistent underperformance if you do not account for hold and closing price dynamics American Gaming Association commercial gaming revenue tracker.
Another frequent misstep is using CLV only as post hoc justification for a single win or loss rather than a process diagnostic. CLV should shape your entry timing and model calibration when observed over many trades Pinnacle closing line value explained.
Trade when a credible probability model shows a material price discrepancy after accounting for sportsbook hold, when timing or public splits create a demonstrable positive CLV, and when your stake sizing rules keep capital protected during the evaluation period.
Behavioral traps and poor risk control
Overbetting relative to your estimated edge or ignoring fractional Kelly principles increases the chance of ruin; sizing errors often explain more long run value destruction than small model biases do Investopedia Kelly criterion definition.
Fixes include a written staking plan, conservative default fractions for Kelly sizing, and precommitment to a logging routine that measures CLV and outcome variance so you avoid emotionally driven adjustments.
Practical trading scenarios and worked examples
Scenario 1: early line versus sharp late move
Imagine you see an early line with perceived value on an underdog. Your checklist records entry price, your model probability, and an expected closing range. If the market drifts toward your entry by close and you record positive CLV over repeated occurrences, that timing signal likely adds value. Use open-to-close patterns to test whether early entries systematically beat the close Pro-Football-Reference 2024 games and lines.
Conversely, if the market routinely moves against your entry and CLV trends negative, the apparent early value may be noise or a misunderstanding of market information flow. Documenting these outcomes in a trade journal lets you separate luck from process.

Scenario 2: extreme underdog pricing and probability check
When an underdog reaches an extreme price due to public skew, run a probability calibration: stress test model inputs, check for news or roster changes, and compare to the closing price you expect based on similar historical cases. If your conservative estimate still shows an edge after accounting for hold and variance, the trade may be reasonable.
Log the following for each scenario: entry price, closing price, model probability, stake size, and outcome. Over time you will compute CLV per scenario type and judge which situations reliably created positive CLV rather than relying on anecdotes.
Putting it together: checklist and next steps
Short checklist for a repeatable process
Compact checklist: estimate probability, compare to market-implied probability, check recent CLV history for similar setups, apply fractional Kelly stake, log the trade and review CLV after close Pinnacle closing line value explained.
Decide on evaluation windows before you start-track outcomes across a defined sample size and adjust models or staking only after the sample gives a meaningful signal. See how evaluations work at how our evaluations work.
Keep the process disciplined and iterative: if CLV drifts negative across a strategy, pause, review inputs, and refine probability calibration rather than increasing stake to chase a fix.
Closing line value compares your entry price to the market price at kickoff; tracking it across many bets shows whether your timing and pricing consistently beat the market.
Season-level ATS data do not show a simple advantage for underdogs over favorites; successful trading depends on price, timing, and covering sportsbook hold rather than side alone.
Use a sizing framework tied to estimated edge such as the Kelly criterion, typically applied fractionally, to reduce variance and protect capital during evaluation windows.