
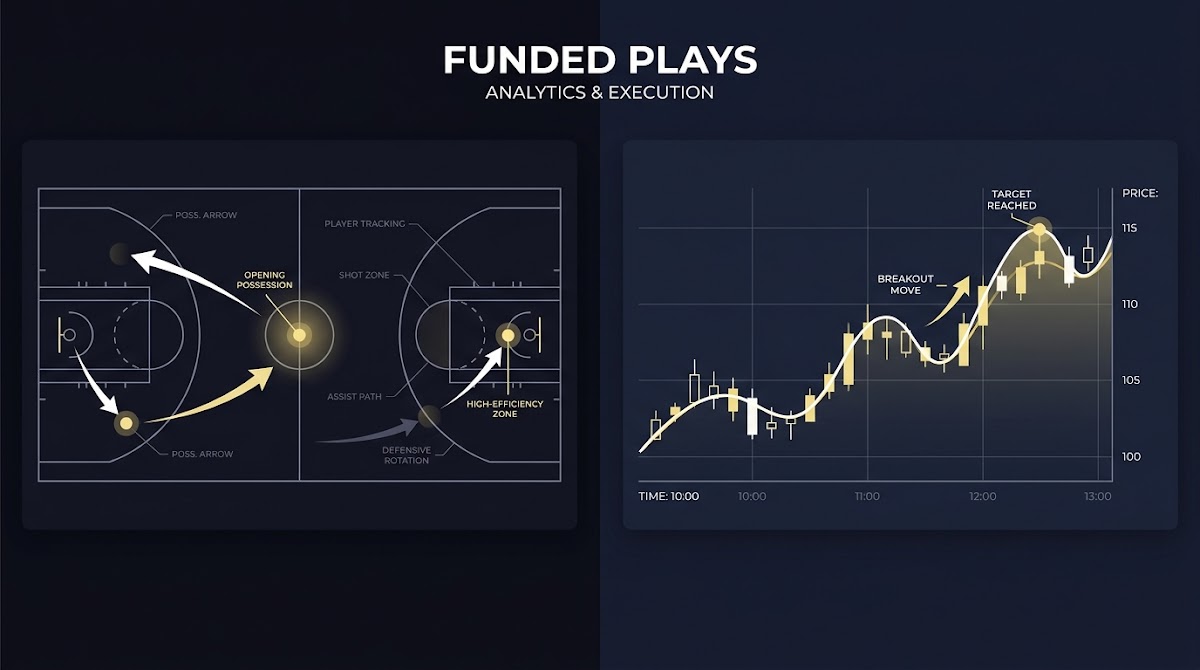
What trading favorites versus underdogs means in top basketball markets, Trading NBA Favorites vs Underdogs
Core terms: favorite, underdog, line, juice
Trading in sports markets refers to taking positions that capture differences between a model's fair price and the market price, then managing those positions with deliberate stakes and exits. In basketball this often means siding with a favorite or underdog in a pregame market or placing short lived live trades that react to possession level information, rather than placing bets purely for entertainment or single event payouts.
Favorites and underdogs are best described as market prices converted into implied probabilities, not just team reputation or hype. Converting a moneyline or spread to an implied probability focuses discussion on market odds and liquidity, and helps separate sentiment from where the market has actually priced an outcome.
logging trades and key price points for CLV analysis
Use one row per trade
Why trading differs from simple betting
Trading emphasizes edge measurement, execution quality, and risk control over single event returns. A trader evaluates whether their model or read consistently improves on the market close, rather than celebrating isolated wins that could be noise.

That distinction matters because pregame markets in top tier basketball are relatively liquid, and durable edges are rare; trade discipline, record keeping, and clear evaluation criteria separate repeatable approaches from recreational plays. For guidance on using closing line value as a validation tool, see the Pinnacle explanation of closing line value Pinnacle article on closing line value.
How market structure prices favorites and underdogs
How prices normally form in NBA markets
Lines in NBA markets emerge from a blend of public money, sharp accounts, and market makers who set and adjust quotes according to incoming bets and information. Liquidity and the flow of sharp versus recreational money determine how quickly a price moves and how close it stays to a model fair price.
When thinking about where an edge might appear, consider that tight order flow and active sharps tend to push prices toward more efficient levels in major markets, which means obvious value opportunities are uncommon without either superior models or superior execution.
Try a model tracking template and learn about structured challenge programs
If you want a simple template to log pregame and live prices and compare them to the close, sign up for a model tracking template that organizes timestamps, prices, and result fields for periodic CLV review.
The favourite-longshot bias and what it means for traders
The favourite longshot bias is the tendency for extreme underdogs to be overpriced while favorites are priced slightly more efficiently; however the magnitude of that bias is modest in mature basketball markets, so it is rarely a blanket source of profit without selectivity and good timing. For a concise review of the favourite longshot bias and its typical effects, read the Pinnacle overview on the subject Pinnacle on the favourite longshot bias.
An illustrative scenario: an extreme underdog that receives media attention after a key injury may attract recreational bets and temporarily present a price you consider rich; but in a liquid market that gap can close quickly as sharper accounts react. The practical takeaway is to pair an observed bias with execution rules rather than assume the bias will persist.
Measuring edge: why closing line value matters more than short-run returns
What closing line value (CLV) measures
Closing Line Value measures whether you consistently obtain better prices than the market close; beating the close is a long established proxy for having a pricing edge and helps filter out short term variance in returns. If your average stakes obtain prices superior to the final market price, you are more likely to have a repeatable advantage.
Operationally, CLV focuses on price improvement rather than isolated profit and loss, which means a losing month can still be evidence of edge if bets beat the close on average. For an accessible primer on how CLV is used to validate edges, see the Pinnacle explanation of closing line value Pinnacle article on closing line value.
How to track CLV for pregame and in-play trades
Keep a simple trade log with these columns: timestamp, market open price, your price, stake, closing price, and outcome. Record pregame and in-play trades separately so you can compare sources of edge independently and measure whether live execution adds measurable value above pregame pricing.
For in-play trades, timestamp the exact game clock and market timestamp so you can align your price with market movement and event sequencing. Periodic review of CLV by market type and by game state helps you understand if edges are consistent or concentrated in specific scenarios.
Stake sizing and risk control: fractional Kelly and practical caps
What fractional Kelly is and why practitioners prefer it
The Kelly criterion prescribes an optimal fraction of bankroll to stake when edge and odds are known, but full Kelly is often too aggressive when edges are small or estimates are noisy. Practitioners commonly use fractional Kelly, for example a half Kelly, to reduce volatility while preserving long run growth characteristics of Kelly sizing.
Fractional Kelly smooths equity curves and reduces drawdown risk compared with full Kelly, which is particularly helpful when working with small, uncertain model edges common in NBA trading. For detailed theoretical and practical context on Kelly and fractional Kelly, see Edward Thorp and collaborators on the Kelly approach Thorp on the Kelly criterion.
Practical stake caps and drawdown planning
Simple rules make fractional Kelly workable: compute a Kelly fraction from your estimated edge, then multiply by your chosen fraction such as 0.5. Add a hard per‑trade cap (for example 1.0 percent of current bankroll) and a daily exposure cap to control correlation risk across multiple trades.
Also build a drawdown plan: set review thresholds if your account falls a given percent from peak equity, pause model changes during review, and run a retrospective CLV check to distinguish model drift from variance. Selected technical treatments and practical guidance on fractional Kelly are discussed in applied literature on the subject MacLean and collaborators on fractional Kelly.
In-play dynamics: where transient mispricings often appear
How live markets react to game events
Live markets adjust quickly to new information, but not instantaneously; that gap creates short windows where a model that interprets possession level detail and injury updates can diverge from posted prices. Speed matters, and execution quality defines how much of that divergence you can capture.
Modern in-play activity represents a significant share of global wagering, which increases both opportunity and competition. The IBIA integrity report outlines the size and rapidity of live market activity and helps frame why in-play requires tight latency and clear signal filters IBIA Annual Integrity Report 2024.
Common micro-situations that create short windows
Typical moments to monitor include timeouts, substitutions that change on court matchups, sudden foul trouble for a star, and late game possession sequences where win probability swings sharply. These micro events often produce brief mismatches between your win probability model and market odds.
To exploit these windows you need a live win probability backbone, quick filters to suppress noise, and conservative stake caps to avoid over committing when the model is uncertain. For how possession level analytics feed live probabilities, see the Stats Perform guide to win probability in basketball The Analyst on win probability.
A practical framework: combine pregame models, live filters, and stake caps
Anchoring fair price pregame
Step 1 is to compute a pregame fair price using your model, then log the opening market quote and your fair price. This anchor provides a baseline to judge in-play signals and prevents frequent overreaction to short lived market moves.
Maintain separate templates for pregame and in-play trades so you can measure where value originates. The template should include fields that let you record timestamps, the fair price, the market price you took, and the closing price for later CLV analysis.
Real-time signal filters and execution rules
Step 2 is to set concise live filters: require a minimum win probability delta to the market, confirm the trigger after a short latency check, and avoid signals that rely on single noisy inputs. Combining event driven rules with possession level probability changes reduces false positives in live trading.
When a trade meets your filters, record exact timestamps and limit the time window in which you will accept the market price, for example 10 to 30 seconds depending on your execution method and market liquidity.
Putting fractional Kelly limits on trades
Step 3 applies fractional Kelly to those filtered signals. Calculate the stake suggested by your Kelly fraction, apply your selected shrink factor such as half Kelly, and then subject that result to your hard per trade cap and daily exposure limit before executing.
After execution, log the trade and compare your traded price to the closing price for CLV review. Regularly reviewing these logged entries is the primary way to confirm whether your pregame anchor plus live filters produce consistent price improvement.

Decision criteria, evaluation metrics, and when to deviate
Objective rules for taking a trade
Set an objective entry rule such as: minimum model edge of X percent versus available price, maximum per trade stake of Y percent of bankroll, and a confirmed live trigger where applicable. Objectivity removes emotion from trade selection.
Combine hit rate expectations with average edge to estimate expected value, but prioritize CLV improvement as your main validation metric rather than short term ROI. Tracking CLV forces you to focus on whether execution and models are improving on market close over time; for why CLV is a robust validation metric see the Pinnacle discussion of closing line value Pinnacle article on closing line value.
Use a disciplined log to compare your executed prices to the market close, measure closing line value over a large sample, combine pregame fair price anchors with live win probability signals, and size stakes with fractional Kelly plus hard caps to protect against drawdowns.
How to evaluate and iterate on your model
Use a periodic review cadence: monthly CLV checks, quarterly model calibration, and immediate review if drawdowns exceed predefined thresholds. Analyze trades by market type, game state, and whether live filters produced the observed edge or loss.
If hit rate, CLV, or win probability deltas deteriorate persistently, pause new live deployment and backtest changes on a holdout period before resuming. Also consider market regime shifts such as rule changes or liquidity shifts as reasons to revalidate assumptions.
Common mistakes, practical scenarios, and final checklist
Typical pitfalls to avoid
Common errors include chasing variance by increasing stakes after losses, neglecting to log opening and closing prices, over trusting noisy live signals, and failing to cap correlated exposure across simultaneous events.
Avoid these by enforcing strict logging discipline, using fractional Kelly with hard caps, and keeping CLV reviews on a fixed schedule so you can detect model issues rather than amplify them through emotion or overconfidence. For context on staking prudence and drawdown management review pragmatic fractional Kelly guidance Thorp on the Kelly criterion.
Short scenarios: favorite fade, small underdog scalp, late-game hedge
Scenario 1, favorite fade: your pregame model shows a small favorite edge but the market moves against you due to public money. If your CLV tracking shows you generally beat the close on similar situations, take a controlled fractional Kelly stake with a tight cap and log the trade for review.
Scenario 2, small underdog scalp: in the first quarter a key starter is in foul trouble and your live win probability model instantly shifts value to the underdog. If the market has not yet fully adjusted and your filters require a clear win probability delta, take a modest live stake and cap exposure to protect against rapid reversion. Scenario 3, late game hedge: when a close game swings on a late turnover use very tight stake caps because the variance and correlation risk spike in final possessions. These common micro-scenarios are frequent sources of short lived mispricing in in-play markets, especially where live probability models provide clear, timestamped deltas The Analyst on win probability.

Funded Plays Logo
One-page checklist
Checklist summary: compute pregame fair price, log opening price, apply live filters for in-play signals, use fractional Kelly with hard caps, record traded price and close, and review CLV on a fixed cadence. Keep rules simple, document every trade, and prioritize responsible participation rather than aggressive leverage.
Consistent application of this framework helps distinguish durable approaches from short term luck while limiting downside from variance and execution risk. The combination of CLV based evaluation, fractional Kelly sizing, and disciplined live filters forms a conservative, testable structure for trading favorites and underdogs in NBA markets.
Measure whether your executed prices consistently beat the market close using closing line value, and review CLV over a sufficiently large sample before concluding you have an edge.
Fractional Kelly reduces drawdown and volatility from noisy edge estimates while preserving much of the long run growth benefits of the Kelly approach.
Short windows after timeouts, injuries, substitutions, or late game possession swings can create transient mispricings detectable with a robust win probability model.