
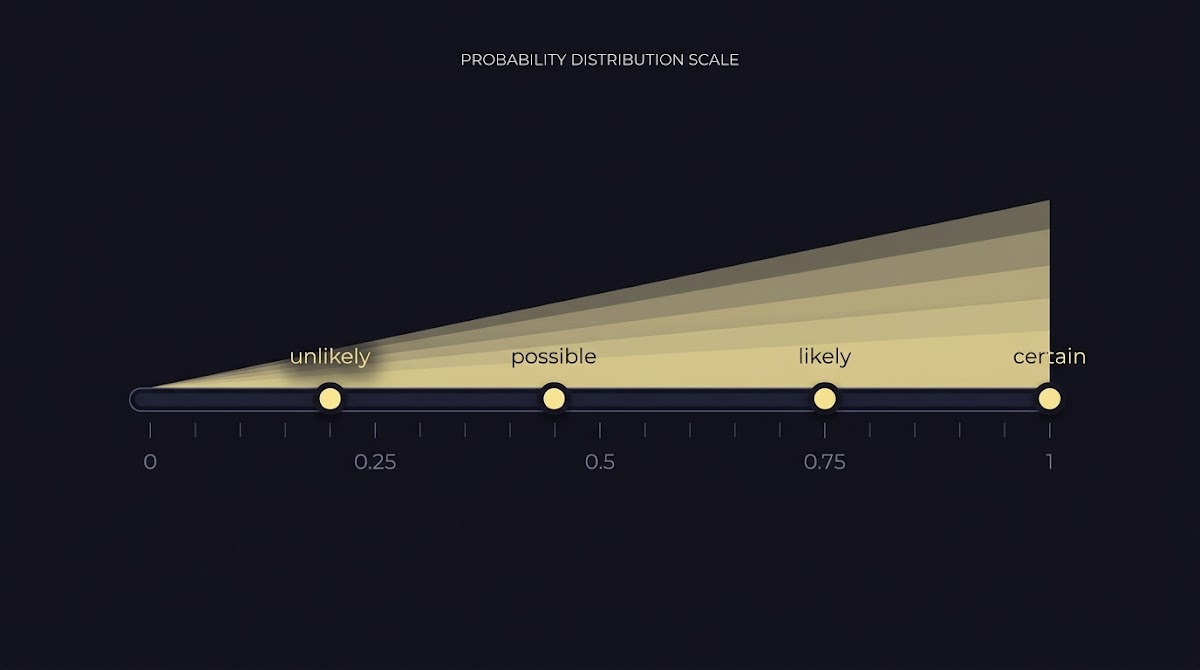
What the difference between probability and certainty means
The Difference Between Probability and Certainty
The Difference Between Probability and Certainty matters when you move from saying what might happen to deciding what to do about it. Probability is a formal measure that places an event somewhere on a scale from 0 to 1, with 0 meaning impossibility and 1 meaning certainty; certainty corresponds to probability 1 while empirical claims rarely justify that extreme value Stanford Encyclopedia of Philosophy.
Probability is useful because it captures degrees of uncertainty in a single number and lets you compare alternatives, while certainty implies no doubt and therefore tends to eliminate the need for tradeoffs or further estimation. Treating a probabilistic forecast as if it were certain tends to produce overconfidence and poorer choices, especially when rare outcomes have outsized effects.

In practical terms, a forecaster who reports a 0.7 chance is saying the event is substantially more likely than not but not guaranteed; that distinction changes how one sizes stakes, sets limits, or designs contingency plans. In many applied settings, including structured sports-prediction challenges, acknowledging the gap between probability and certainty helps keep decisions disciplined and measurable.
Core concepts: how probability is measured and expressed
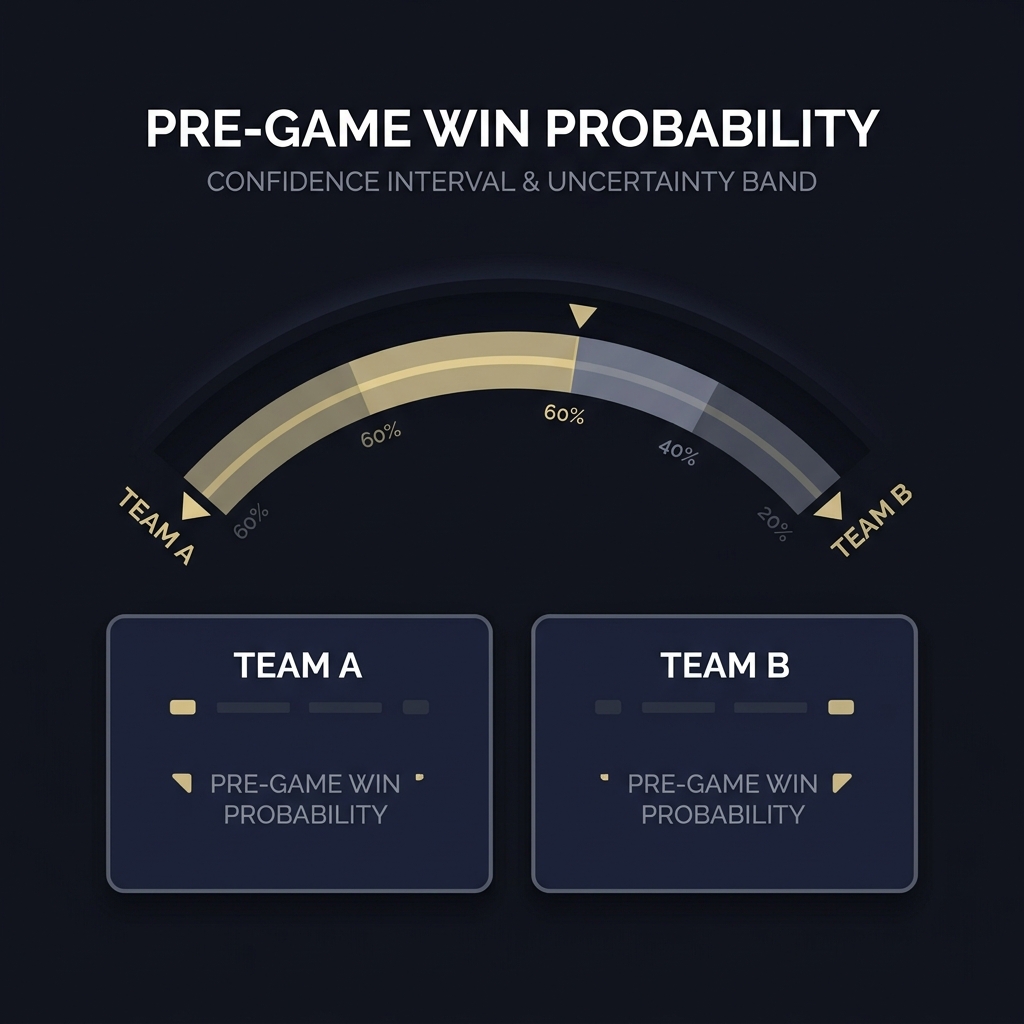
Numeric probabilities place uncertainty on a 0 to 1 scale, often shown as percentages for readability. A single point probability can be supplemented with a range or interval to represent estimation uncertainty, for example a 60 percent central estimate with a 50 to 70 percent interval to reflect measurement or model uncertainty UK Analysis Function guidance.
Confidence intervals and other interval forms express the idea that the reported number is not exact. Visual formats such as fan charts or shaded intervals make those ranges intuitive for readers and help prevent the misreading of a point estimate as a claim of certainty.
Calibrated verbal labels are commonly used to bridge technical and public audiences. Best practice ties phrases like likely, unlikely and very likely to explicit numeric bands so readers know what words map to which probabilities; this mapping reduces ambiguity and improves clarity when communicating to nontechnical audiences IPCC AR6 uncertainty guidance.
When you see a report that uses a verbal label without giving its numeric mapping, ask for the underlying range or interval. That mapping is the simplest way to avoid interpreting a qualitative phrase as a statement of certainty.

Interpretations of probability: common frameworks and why they matter
Two widely discussed frameworks help make sense of probability: the frequentist view, which ties probability to long-run frequencies of repeatable events, and the Bayesian view, which treats probability as a degree of belief updated as new evidence arrives Stanford Encyclopedia of Philosophy.
Frequentist thinking suits situations where many similar trials can be observed and used to estimate rates, while Bayesian reasoning fits settings where forecasters need to update a single-case judgment as new information appears. Choosing an interpretation affects how you assign numbers, how you update them, and how you explain your assessment to others.
A simple forecast log template to record probability, context and outcome
Use daily or per-event entries
In applied forecasting, state your working interpretation when communicating technical estimates. Saying whether probabilities reflect long-run frequencies, subjective degrees of belief, or model-based likelihoods helps technical readers reproduce and evaluate forecasts without confusing the underlying assumptions.
Standards and official guidance for communicating uncertainty
Authoritative sources converge on clear, practical rules: show numeric ranges, attach calibrated labels to explicit probability bands, and use visual intervals when possible. These conventions are recommended by standards used across measurement and policy work, and they reduce the chance that readers will interpret probabilistic statements as certain facts NIST TN 1297 and guidance on communicating uncertainty.
Government and scientific guidance also warns against definitive language that implies false certainty. Short, precise caveats and explicit uncertainty ranges are better than confident-sounding single numbers when evidence is limited or models are imperfect.
Practical takeaways from these standards include: always show the central estimate and its plausible interval; if you use qualitative terms, define their numeric mappings; and, where relevant, document the sources of uncertainty so users can judge whether missing factors might change the assessment UK Analysis Function guidance.
When preparing a public summary, prioritize clarity: one short sentence of central guidance, one visual showing range, and one line on key caveats is often more useful than a long technical appendix for nontechnical readers.
Why empirical certainty is rare and how that affects forecasts
Empiricalcertainty is rare because real-world predictions face multiple sources of irreducible uncertainty: sampling variability, measurement error, and model misspecification that together make probability 1 an exceptional claim rather than the norm NIST measurement guidance.
Models are simplifications of reality and any observed data come with noise; even when an event seems overwhelmingly likely, small probabilities for unexpected outcomes remain. That is why forecasters prefer to quantify uncertainty rather than assert certainty.
Forecasters should treat probabilistic estimates as degrees of belief or frequency-based rates, report numeric ranges and confidence levels, use expected-value reasoning and explicit risk limits when acting, and track calibration over time rather than asserting certainty.
In sports prediction, for example, a team that is heavily favored still faces nonzero chances of upset due to luck, injury, or unmodelled factors, so calling any single game outcome certain is usually unjustified IPCC guidance on uncertainty framing.
Recognizing the rarity of empirical certainty changes how you prepare: use conservative stake sizes, set drawdown limits, and maintain contingency plans rather than assuming a forecast will realize with absolute surety.
How to make decisions using probabilities: expected value and risk limits
Expected-value thinking helps you translate probabilities into choices without heavy math. Multiply the probability of a favorable outcome by its benefit and compare that quantity to the expected cost. If the expected gain exceeds the expected loss under your risk rules, the pick is appealing; when not, it is a signal to pass or reduce exposure NIST guidance on measurement and decision framing.
Simple examples work best. If a forecast implies a 60 percent chance of winning a small contest that yields a fixed reward, the expected return is 0.6 times the reward minus the cost. If that number is positive and fits your risk limits, the decision is aligned with expected-value logic.
Risk constraints matter because even positive expected-value choices can suffer long losing streaks. Set drawdown rules, position-sizing limits and conservative thresholds to protect longevity. In structured simulation challenges or funded accounts, explicit drawdown and performance rules are often part of the evaluation, and applying risk controls keeps participation sustainable and repeatable IPCC guidance.
When possible, state the decision rule required to act on a forecast. That discipline turns probabilistic estimates into consistent behavior rather than ad hoc betting driven by emotion or anecdote.
A practical framework for forecasting and testing probabilistic claims
1. Define the event and horizon clearly. Write a one-sentence description of what you expect to happen and by when. Record boundary conditions such as lineups, weather and deadlines.
Practice calibrated forecasting with sample dashboards and exercises
Try a short calibration exercise: make five separate probability estimates for similar events over a month, then compare how often outcomes occur versus your stated probabilities to see if you are overconfident or underconfident.
2. Assign a probabilistic estimate and a confidence range, then record the forecast in a log with your rationale and the information available at the time. That record is the basis for later evaluation.
3. Evaluate outcomes and measure calibration. Group forecasts into probability bins (for example 0 to 0.2, 0.2 to 0.4) and compare predicted frequencies with observed frequencies to check whether your probabilities are well calibrated Nature Human Behaviour on uncertainty communication.
4. Update models and heuristics based on what you learn. If you find consistent biases, adjust your process rather than assuming individual misses were flukes.
5. Repeat the cycle with clear success criteria and a logging system or dashboard so you track long-term performance and avoid overfitting to a small sample Nature Human Behaviour.
Throughout this workflow, keep records that separate forecasts from post-hoc rationales. That separation preserves the integrity of calibration checks and helps distinguish genuine skill from hindsight storytelling.
Common mistakes and cognitive biases when people treat probabilities as certainties
Overconfidence is the most common error. Forecasters often truncate uncertainty and speak in absolutes, which invites poor sizing decisions and surprise when low probability events occur. Explicitly naming uncertainty reduces the rhetorical pressure to sound certain and helps keep choices proportional to real risk Nature Human Behaviour.
Base-rate neglect is another familiar trap: focusing on a compelling story or recent performance instead of the broader historical rate often inflates perceived likelihood. Corrective practices include checking base rates before assigning a probability and using calibration bins to test whether adjustments are warranted.
Hindsight bias also turns probabilistic assessments into deterministic narratives after outcomes are known. To avoid this, keep contemporaneous logs and employ pre-mortems that surface ways a forecast could fail before the event occurs GAISE guidance on teaching probabilistic reasoning.
Practical remedies include forecasting journals, routine calibration exercises, and a policy of stating explicit probability ranges rather than single point claims when communicating outside technical teams.
How to communicate uncertainty clearly to different audiences
For nontechnical audiences, use a short phrase plus an explicit numeric range and a simple visual where possible. For example: "Team A has a likely chance of winning, about 65 percent with a plausible range of 55 to 75 percent," which pairs a verbal label with numbers and reduces misinterpretation UK Analysis Function guidance.
For technical readers, include the numeric central estimate, the interval you used, the data and model assumptions, and a brief note on residual uncertainties that could change the assessment. That level of documentation enables replication and critique without implying certainty.
Evidence from peer-reviewed research indicates that transparent uncertainty communication typically does not erode trust and can improve understanding when presented clearly and consistently. Format and context matter, so choose your visual and verbal mapping for the intended audience Nature Human Behaviour.
A simple sentence that models good wording for public summaries is: "We estimate a 60 percent chance that Event X occurs by Date Y, with a plausible range of 50 to 70 percent; key uncertainties include A and B." That sentence gives a number, a range and a short caveat in one compact line.
Examples and scenarios: everyday life and sports prediction
Everyday vignette: imagine the commute. A weather forecast saying there is a 30 percent chance of heavy rain is not a promise that you will get wet; it is a basis for deciding whether to carry an umbrella, leave earlier or change routes. Interpreting 30 percent as certainty that it will not rain is the kind of deterministic error that leads to regretted choices UK Analysis Function guidance.
Sports scenario: before a game you estimate a 75 percent win probability for the favorite. Expected-value reasoning suggests sizing your exposure so that the long-run expectancy and your drawdown limits remain acceptable; even at 75 percent, upsets happen and a sequence of losses can harm performance if position sizes are uncontrolled NIST guidance.

Step-by-step application: use your log to record the 75 percent forecast, assign a confidence range such as 65 to 85 percent, set a stake consistent with your risk policy, and review the outcome to update calibration. In structured, simulated challenge environments you can test these steps without real-money exposure and measure calibration objectively.
These vignettes show that probabilities guide actions rather than reduce them to all-or-nothing bets, and that treating estimates as uncertain helps maintain resilience over many decisions.
Teaching and learning probabilistic thinking
Three practical exercises build calibration: forecast journaling where every forecast is recorded with context; probability bin calibration where you compare predicted frequencies to observed frequencies across bins; and small-scale tournaments or group exercises where feedback is timely and structured GAISE college report.
Use a short feedback loop so learners can see whether their 70 percent forecasts actually occur about 70 percent of the time. Immediate, objective feedback accelerates learning and reduces reliance on intuition alone.
Tips for dashboards and iteration: track cumulative calibration scores, avoid overfitting by reserving a validation window, and run simple backtests to ensure that apparent improvements are robust rather than artifacts of a shifting sample or retroactive tuning Evidence on the benefits of transparent uncertainty communication.
Over time, these practices help transform gut feelings into disciplined probabilistic judgments that generalize across events and time horizons.
Practical checklist: writing and sharing probabilistic claims
Checklist items to use every time you publish a forecast: state the numeric range, include a calibrated verbal label, show a visual interval or explain why you cannot, list key caveats, and link to methodology or your forecast log when possible UK Analysis Function guidance.
Two wording templates you can copy: public template: "We assess a likely chance of X at 60 percent, plausible range 50 to 70 percent, main uncertainties: A, B." Technical template: "Central estimate 0.6, 90 percent interval [0.5, 0.7]; data sources: D; main model limitations: L."
When sharing with teammates, pair the statement with one line of operational guidance: list the decision rule that follows from the forecast so actions are consistent across individuals and time.
Conclusion: actionable takeaways and next steps
Five concise takeaways: quantify uncertainty on a 0 to 1 scale and prefer ranges over point certainty; map verbal labels to numeric bands; use expected-value reasoning and explicit risk limits when acting on probabilities; track calibration with a forecast log; and prefer transparent visuals and methodology notes when communicating assessments NIST guidance.
Probabilistic approaches require discipline and do not guarantee outcomes. They do, however, align choices with the true degree of uncertainty and reduce the harmful effects of treating likely events as if they were certain.
If you want to practice, try a short series of calibration exercises, keep an accurate log, and apply conservative position-sizing until your calibration improves. Over time this process will make your forecasts more honest, repeatable and useful.
Probability measures degrees of uncertainty on a 0 to 1 scale; certainty is the special case where probability equals 1 and is uncommon in empirical contexts.
Give a numeric estimate plus a simple range and a short caveat, and map any verbal label to an explicit probability band.
Evidence indicates that transparent uncertainty communication usually does not reduce trust and often improves understanding when presented clearly.
References
- https://plato.stanford.edu/entries/probability-interpret/
- https://www.fundedplays.com/challenges
- https://analysisfunction.civilservice.gov.uk/policy-store/communicating-uncertainty/
- https://analysisfunction.civilservice.gov.uk/policy-store/communicating-quality-uncertainty-and-change/
- https://www.ipcc.ch/report/ar6/wg1/downloads/report/IPCC_AR6_WGI_Appendix_1.pdf
- https://nvlpubs.nist.gov/nistpubs/TechnicalNotes/NIST.TN.1297.pdf
- https://www.nature.com/articles/s41562-019-0673-x
- https://www.amstat.org/docs/default-source/amstat-documents/gaisecollege_full.pdf
- https://pmc.ncbi.nlm.nih.gov/articles/PMC7292191/
- https://royalsocietypublishing.org/rsos/article/6/5/181870/95102/Communicating-uncertainty-about-facts-numbers-and
- https://www.fundedplays.com
- https://www.fundedplays.com/blogs
- https://www.fundedplays.com/blogs/how-fundedplays-evaluations-work