

Why this glossary exists and how to use it
This resource is written for beginners who want clear, actionable definitions and a path from vocabulary to practice. The Complete Beginner s Glossary of Sports Trading Terms is designed to help sports trading newcomers learn the words they need, see how those words matter for decisions, and apply simple checks before execution.
Use the glossary as both a quick reference and a short course: read one short definition when you need it, then follow the deeper section for worked examples and checklists. Many entries are connected to decision criteria and risk management, so the practical value comes from mapping vocabulary to rules you can apply while researching or trading.
Use this glossary to identify which terms you already apply, then prioritize practicing EV calculations, odds conversions, and CLV tracking to build evidence for decision-making.
Who this is for: beginners in sports trading, experienced sports fans moving to organized forecasting, and anyone preparing to practice staking or evaluation challenges. The focus is on helping you think like a trader: define an edge, size bets to survive variance, and review outcomes.
How to read the entries: start with the short definition if you need a quick cue, then read the decision cue that follows to know when the term should change what you do. Where math matters, a worked example is nearby so you can see the calculation without searching elsewhere.
Key terms at a glance: essential definitions
Odds - The quoted price for an outcome that determines payout and implied probability; see the odds formats section for quick conversions and examples.
Implied probability - The share of outcomes implied by odds; it is the baseline you use to test whether your estimate produces an edge.
Edge - The difference between your estimated probability and the market implied probability; a positive edge suggests a trade may have expected value.
Expected value (EV) - The probability-weighted average outcome used to measure whether a trade is positive or negative expectation; EV is foundational to long-term profitability and decision-making Investopedia expected value definition.
Stake - The amount placed on a single market; stake sizing links to bankroll management and staking frameworks like Kelly.
Bankroll - The total capital allocated to your trading or challenge account; protecting bankroll and using drawdown limits is central to surviving variance.
Liability - The amount at risk on lay positions or when bookmaking; understanding liability prevents oversized exposure on exchange bets.
Vig / Overround - The bookmaker margin embedded in quoted prices; accounting for vig is necessary when converting odds to fair implied probability.
Quick decision cues: memorize the one-line reason each term matters. For example, check implied probability before you size a stake, and log EV and closing line value for later review. For EV and Kelly, see the deeper sections with worked examples.
Odds formats: decimal, American, and implied probability
Decimal odds show the total return per 1 unit staked, including your stake, which makes payout math straightforward for beginners and helps compare markets quickly Investopedia decimal odds.
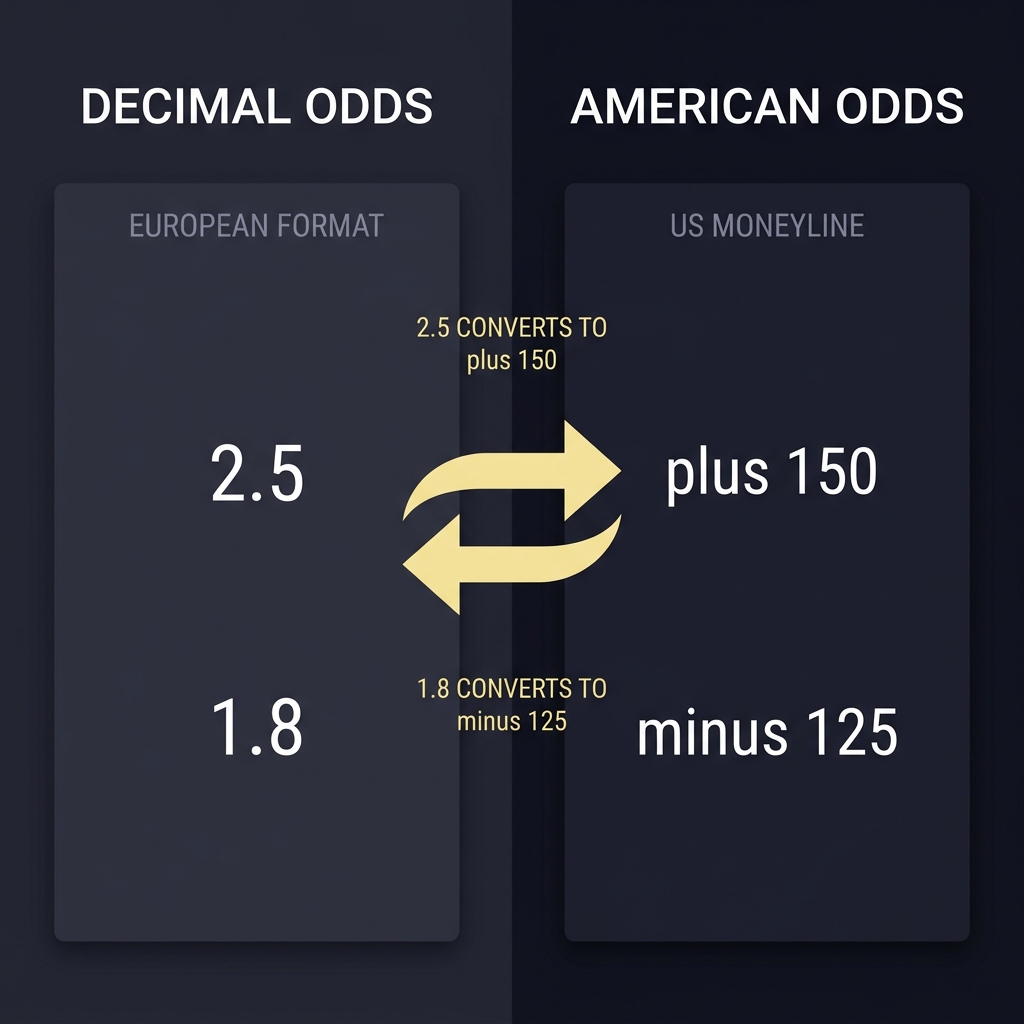
American, or moneyline, odds use positive and negative figures to express payouts relative to a 100-unit base: a positive number shows how much you win on a 100-unit stake, while a negative number shows how much you must stake to win 100 units; this convention is standard in U.S. markets in 2026 Investopedia moneyline definition.
Simple conversions you should be able to do without a tool: decimal to implied probability is 1 divided by the decimal price; for American odds, convert to decimal first, then to implied probability. These conversions let you compare prices across markets and spot edges.
Examples: For decimal odds 3.25 the implied probability is 1/3.25 = 0.3077. For American odds +250 convert to decimal 3.50 then implied probability 1/3.50 = 0.2857. A short mental check like this can reveal whether a quoted price matches your model or contains potential value.
Convert decimal and American odds and compute implied probability
Leave unused fields blank
Why implied probability matters: it is the common language between odds formats and your probability model. Once you express both your forecast and market price as probabilities, you can compute edge and EV reliably.
Exchange mechanics: back, lay, liability, and liquidity
On betting exchanges you can back an outcome, which means betting for it, or lay an outcome, which means betting against it. These two actions create symmetric exposure and let traders take either side of a market depending on expected value and hedging needs Betfair back and lay explanation.
Lay liability is calculated from the lay odds and the stake: liability = (odds - 1) * stake for decimal-based calculations. Understanding this formula shows why small changes in odds can produce very different capital requirements on lay positions.
Example: If you lay a runner at decimal 5.00 for a 10-unit stake, your liability is (5.00 - 1) * 10 = 40 units. That 40-unit exposure is what you must be prepared to pay if the laid outcome wins, so check liability before placing lay orders.
Liquidity matters because thin markets make it harder to match desired sizes at quoted prices. Low liquidity increases slippage and the chance that you cannot enter or exit a position at your model price; always check matched volume or exchange depth for markets where you plan to trade.
Expected value (EV) and how traders find an edge
Expected value, or EV, is the probability-weighted average of outcomes and remains the foundational metric for identifying a positive edge in sports trading Investopedia expected value.

In practice, compute EV by multiplying each outcome probability by its net payoff and summing the results. If the EV is positive, the trade is favorable in expectation; if negative, the trade reduces your long-term capital on average.
Worked example: Suppose you estimate a 40% chance of an outcome and the market offers decimal odds of 3.00. Net payoff per unit staked is 2.00 if it wins. EV = 0.40 * 2.00 + 0.60 * (-1.00) = 0.80 - 0.60 = 0.20 units per stake, a positive expectation, assuming your probability is accurate.
Limitations in practice include model error, misestimation of probabilities, and sample size. EV requires reliable probability estimates; if your model systematically overstates edge, EV will mislead. Treat EV as necessary but not sufficient for decisions and combine it with risk management rules.
Staking and sizing: Kelly Criterion and fractional Kelly
The Kelly Criterion gives a formula for the optimal fraction of bankroll to stake based on estimated edge and odds; applied correctly, it links your perceived edge to a proportional stake that maximizes long-term growth under idealized assumptions Investopedia Kelly Criterion.
Put simply, Kelly recommends larger stakes when your edge is larger and smaller stakes when your edge is small or uncertain. Because Kelly is sensitive to estimation error, many traders use fractional Kelly, scaling the recommended stake to reduce volatility and drawdown.
Why fractional Kelly helps: full Kelly maximizes asymptotic growth but can produce large short-term swings and deep drawdowns if your edge estimate is noisy. Using half-Kelly or quarter-Kelly shrinks volatility while preserving some of the Kelly advantage, which is why practitioners commonly apply a fractional approach.
Practical cautions: Kelly inputs are your edge estimate and the payoff odds. If your edge estimate is biased, Kelly will magnify mistakes. Before committing to a stake schedule, stress-test the plan with simulated sequences to observe potential drawdown and recovery dynamics.
Closing line value (CLV): definition, use, and limits
Closing line value compares the price you obtained to the market closing price and is widely used by practitioners as a diagnostic of pricing skill; a consistent positive CLV is associated with better long-run expectation, though it does not guarantee profit Pinnacle CLV explanation.
How to compute CLV for a single trade: record your entry odds, record the market closing odds, and note the difference in implied probability or price. Over many trades, average your CLV to assess whether your prices typically improve relative to the market close.
Practice CLV and EV tracking with structured challenges
Track CLV in a simple spreadsheet after each session to see whether your prices move toward the market close and to spot systematic errors.
Limits and caveats: CLV is sample-size sensitive and affected by liquidity and market-moving information that arrives after you trade. In thin markets, a single large market movement can distort CLV measures, so interpret small-sample CLV cautiously.
Risk metrics: drawdown, variance, and bankroll planning
Drawdown measures the fall from a peak bankroll to a subsequent trough; it signals how much ground your account must regain to recover and is central for setting evaluation challenge limits and personal risk tolerance.
Variance refers to expected short-term volatility and explains why positive EV processes still produce losing streaks. Recognizing that variance creates normal streaks helps you avoid changing correct strategies prematurely.
Practical bankroll rules include sizing stakes so that expected drawdown under plausible adverse runs stays within acceptable limits and keeping reserves so you can continue testing a process through ordinary variance. Simple stress tests on your staking plan reveal whether your bankroll plan is realistic.
Decision criteria: what to check before you place a trade
Daily pre-session checklist: confirm odds format, run quick implied probability conversions, check liquidity for target markets, and verify stake sizes against your bankroll plan. This brief routine reduces common execution errors.
When to walk away: if implied probability and your estimate are close (no edge), if liquidity is too thin for your size, or if lay liability would create outsized exposure, do not force the trade. Poor CLV history on a market or recurring model errors are also valid reasons to pause and review.
Tracking trades: log key fields for each trade to enable later CLV and EV analysis. Useful log fields include date, market, odds quoted, implied probability, your estimated probability, stake, EV estimate, result, and closing market price for CLV computation.
Common beginner mistakes and how to avoid them
Misreading odds and probability is common. For example, confusing moneyline conventions or forgetting to include the stake in decimal returns leads to incorrect EV calculations and poor decisions; double-check conversions before betting Investopedia moneyline definition.
Ignoring liquidity and lay liability can create outsized exposures, especially on exchanges. Always compute liability for lay positions and confirm market depth before placing orders to avoid being matched at worse prices than you expect Betfair back and lay explanation.
Overbetting and staking errors often arise from emotional responses to short-term results. Use a predefined staking plan, consider fractional Kelly to limit volatility, and log each trade so you can learn from outcomes rather than chase losses.
Practical examples and short walkthroughs
Example 1: Converting American odds to EV. Suppose you see American odds +180 and estimate the true probability at 38%. Convert +180 to decimal 2.80, implied probability 1/2.80 = 35.7%. Net payoff is 1.80 per unit. EV = 0.38 * 1.80 + 0.62 * (-1.00) = 0.684 - 0.62 = 0.064 units, a positive EV if your probability estimate is sound Investopedia decimal odds.
Example 2: Sizing a lay bet and calculating liability. If you plan to lay at decimal 4.50 with a 20-unit lay stake, liability = (4.50 - 1) * 20 = 70 units. That liability is the capital you would lose if the backed outcome wins, so compare liability to bankroll before committing Betfair back and lay explanation.

Example 3: Tracking CLV across a small sample. Record three trades with your entry prices and the market close. If your average CLV is positive over a meaningful sample, it suggests your pricing often improved relative to the market close; remember that this is diagnostic and does not promise future profit Pinnacle CLV explanation.
A short checklist for applying the glossary to your routine
Daily pre-session checklist: confirm odds format, run quick implied probability conversions, check liquidity for target markets, and verify stake sizes against your bankroll plan. This brief routine reduces common execution errors.
Weekly review items: compute your average CLV, aggregate EV across logged trades, and review any persistent model biases. A weekly cadence prevents reacting to short-term variance and builds evidence for meaningful adjustments.
What to record for CLV and EV analysis: at minimum log date, market, entry odds, stake, your estimated probability, EV estimate, result, and closing market odds. These fields let you compute both EV and CLV during reviews.
Tools and next steps for learning more
Helpful tool categories include odds converters, EV and Kelly calculators, exchange simulators, and trade journals or spreadsheets. These tool types let you practice calculations, test staking plans, and preserve records for CLV analysis without risking capital.
How to test a staking plan safely: paper-trade or use exchange simulation modes to apply your staking rules across hundreds of hypothetical trades before scaling live. Simulated testing helps reveal sensitivity to edge estimation errors and potential drawdowns.

Recommended learning path: first master odds conversions and implied probability, then practice EV computation and simple Kelly sizing, and finally track CLV and refine probability estimates. Focus on one metric at a time to build reliable skills.
Conclusion: how to keep improving after this glossary
Set small measurable goals: learn and use one new term per week, keep a trade log, and aim to improve average CLV over a rolling sample. Consistent measurement provides evidence for meaningful changes rather than intuition alone Pinnacle CLV explanation.
Keep records and use fractional staking while your estimate process stabilizes. Remember that metrics like CLV and EV are diagnostics that depend on sample size and model quality; treat them as signals to investigate rather than guarantees.
Avoid common traps: do not overbet during losing streaks, always compute lay liability on exchange positions, and prefer disciplined, incremental improvements over sudden strategy shifts. With structured practice, the vocabulary in this glossary becomes a toolkit for consistent decision-making.
Convert American odds to decimal first, then implied probability is 1 divided by the decimal odds. For positive American odds, decimal = American/100 + 1; for negative, decimal = 100/abs(American) + 1.
Closing line value measures whether your entry price is better or worse than the market closing price. Tracking average CLV helps diagnose whether your pricing tends to improve relative to the market close.
Full Kelly maximizes theoretical growth but can produce large volatility. Many practitioners use fractional Kelly to reduce drawdown and limit sensitivity to estimation errors.
References
- https://www.investopedia.com/terms/e/expected-value.asp
- https://www.investopedia.com/terms/d/decimal-odds.asp
- https://www.investopedia.com/terms/m/moneyline-bet.asp
- https://support.betfair.com/app/answers/detail/a_id/909/~/back-and-lay-betting-explained
- https://www.investopedia.com/terms/k/kellycriterion.asp
- https://www.pinnacle.com/en/betting-resources/educational/closing-line-value-explained
- https://www.fundedplays.com/challenges
- https://oddsjam.com/betting-education/closing-line-value
- https://www.dratings.com/clv-calculator/
- https://www.fundedplays.com/blogs/how-fundedplays-evaluations-work
- https://www.fundedplays.com/blogs
- https://www.fundedplays.com
- https://www.pinnacleoddsdropper.com/blog/closing-line-value