

Understanding states with gambling: quick answer
At-a-glance ranking
Short answer, focused on clarity: when we ask which states have gambling most extensively, the simplest defensible ranking uses commercial gaming revenue for 2024 as reported in AGA's State of the States 2025, with Nevada, Pennsylvania, and New Jersey leading that list State of the States 2025.
That total-revenue view captures where the largest commercial markets and resorts generate the most gross receipts, but it is not the only way to define "most gambling."
Using AGA commercial gaming revenue for 2024 as the principal measure, Nevada, Pennsylvania, and New Jersey ranked highest, but per-capita and casino-count views can reorder priorities; tribal reporting is regional and requires separate handling.
Why revenue, per-capita and counts differ for states with gambling
Different definitions produce different leaders. Total commercial revenue highlights large markets that attract tourists and have major integrated resorts. Per-capita figures can elevate smaller states with heavy visitor traffic. Counts of licensed casinos and legal verticals show market breadth rather than depth. Later sections make these distinctions explicit and reproduce a clear methodology for readers.
Note also that tribal gaming reporting is done by region in the National Indian Gaming Commission publications, so full state-level totals that combine tribal and commercial figures require care and may be unavailable unless a state regulator compiles them at the state level NIGC FY 2024 gross gaming revenue announcement.
What 'gambling' includes in this analysis
Commercial casino revenue vs other verticals
For the ranking in this article we treat commercial gaming revenue as the primary metric, because it provides the most consistent, audited measure across states and across commercial operators. AGA's State of the States compiles those 2024 commercial figures and is the basis for the headline ranking used here State of the States 2025. Using a clear commercial revenue baseline helps avoid mixing counts and tax treatments that vary widely by jurisdiction.
Tribal gaming and reporting scope
Tribal gaming is a major part of U.S. gaming activity, but the National Indian Gaming Commission reports gross gaming revenue by region rather than distributing every tribal amount to a single state total. That reporting structure means a straightforward state-by-state total that cleanly combines commercial and tribal figures is often not available from a single federal source, and researchers should flag when tribal sums are estimated or aggregated from state filings NIGC FY 2024 gross gaming revenue announcement.
Why casino counts matter
Revenue totals show market size, but casino counts and the number of legal verticals reveal market diversity and local access. AGA's State of Play provides counts of casinos and legal gaming options by state, which lets readers see whether a high-revenue state is concentrated in a few megaresorts or spread across many smaller properties State of Play.
Looking at casino counts alongside revenue helps capture market breadth: a state with many licensed properties may offer extensive local access and employment even if per-property revenue is lower than in a resort hub.
Data and methodology: how we rank states with gambling
Primary data sources and why we use them
We use AGA's commercial revenue figures for 2024 as the primary ranking measure because those figures are collected and reported consistently across commercial operators and states, which supports fair cross-state comparisons State of the States 2025.
Per-capita normalization using census estimates
To reduce population-size distortion, per-capita comparisons normalize 2024 commercial revenue by the U.S. Census Bureau July 1, 2025 state population estimates. That step brings tourist-driven and commuter effects into clearer relief for readers comparing intensity of activity rather than raw market scale U.S. Census Bureau population estimates.
Limitations and transparency
Limitations include the regional format of tribal reporting from the NIGC, timing differences between commercial filings and tribal reports, and the potential for year-to-year policy changes to shift rankings rapidly. The approach here is explicit: rank by AGA commercial revenue, then present per-capita and casino-count views as complementary lenses, and highlight where tribal figures need separate handling NIGC FY 2024 gross gaming revenue announcement.
Quick list of the public sources used for replication
Use original tables for exact figures
Top states by commercial gaming revenue in 2024
Why Nevada leads the list
Nevada ranks first by 2024 commercial gaming revenue because it combines world-scale resorts, concentrated tourist demand, and year-round attraction to visitors, producing larger gross receipts than any other state in the AGA ranking State of the States 2025.

The concentration of integrated resorts on the Las Vegas Strip and major regional properties supports sustained spending per visitor that drives Nevada's top position when totals are compared across states.
Other high-revenue states and business mix
Pennsylvania and New Jersey appear among the highest-revenue states in 2024, reflecting large commercial footprints that include urban properties and a mixture of retail, resort, and online verticals where authorized State of the States 2025. For additional state-level breakdowns you can also consult published tables such as a Statista state-by-state summary Gross gaming revenue by state.
States with sizeable local populations and substantial tourism can reach high totals even without a single dominant resort corridor. The business mix in each state, including whether iGaming or sports wagering is available, changes how revenue is distributed across operators and affects year-over-year growth patterns.
How tax receipts reflect activity
High commercial revenue typically translates into larger state and local tax receipts. AGA's 2025 summary highlights record tax collections tied to 2024 commercial activity, which is why state fiscal offices and policymakers monitor these figures closely as part of budget planning AGA State of the States 2025 tax highlights.

Understanding tax treatment is essential when comparing states because different tax rates, fee structures, and local assessments mean the same gross receipts can have different fiscal impacts depending on jurisdictional policy.
Per-capita rankings and casino counts: a different view of states with gambling
How per-capita changes the leaders
When you divide commercial revenue by state population using the Census estimates, smaller states with heavy visitor throughput can climb the rankings because the revenue is spread across fewer residents; that normalization helps show intensity rather than scale U.S. Census Bureau population estimates.
For readers asking which states have gambling most intensively among residents and visitors combined, per-capita gambling measures are the better signal than raw totals.

Number of casinos and legal verticals by state
AGA's State of Play lists casino counts and legal verticals by state, which lets readers see whether high revenue is driven by many small venues or a few large resorts State of Play.
Looking at casino counts alongside revenue helps capture market breadth: a state with many licensed properties may offer extensive local access and employment even if per-property revenue is lower than in a resort hub.
Interpreting tourism and commuter effects
Tourism and cross-border play complicate per-capita comparisons because visitors inflate revenue relative to resident counts. Destination markets like Nevada or states with major tourism corridors show high revenue per resident for this reason, making careful disclosure of methodology essential when reporting per-capita ranks State of Play.
When planning travel or research, readers should choose the metric that best answers their question: total market size, intensity per resident, or local access through counts of properties. For travel-oriented planning you can also see our blogs for context on destinations and access Funded Plays blog.
Tribal gaming: why state-by-state totals can be incomplete
How the NIGC reports tribal revenue
The National Indian Gaming Commission publishes FY 2024 gross gaming revenue at regional levels, not necessarily mapped directly to states, which means readers should be cautious about attributing all regional tribal receipts to specific states without state-level aggregation from tribal reports or regulators NIGC FY 2024 gross gaming revenue announcement.
Because tribal gaming can be substantial in some regions, omitting or double-counting it when comparing states introduces significant error; transparent notes are the right remedy.
Common pitfalls when mixing datasets
A frequent mistake is combining AGA commercial totals with NIGC regional tribal totals as if they were equivalently allocated by state. Without careful methodology, that approach overstates or misallocates tribal activity, so researchers should either use state-compiled tribal aggregates or present tribal figures separately.
When presenting state comparisons, disclose whether tribal receipts are included, indicate the NIGC regional reporting limitation, and point readers to state regulators or tribal authorities for state-level tribal aggregates when available NIGC FY 2024 gross gaming revenue announcement.
Recent trends: what has driven growth through 2024 and into 2025
The role of iGaming and sports wagering
iGaming and legal sports wagering have materially lifted commercial figures where they are authorized, contributing to sustained commercial growth through 2024 and into early 2025 according to AGA's revenue tracker Commercial Gaming Revenue Tracker.
States that opened new verticals saw notable revenue gains, which is why policy changes can quickly shift rankings from one year to the next.
Year-to-date commercial growth patterns
AGA's monthly tracker shows continued year-to-date growth in many markets through early 2025, underscoring the importance of looking at rolling periods rather than a single snapshot to understand trends Commercial Gaming Revenue Tracker.
Stay current with FundedPlays: explore challenge-based sports prediction
Check the AGA tracker and your state regulator pages for the latest monthly figures and policy updates so you use the most current data when reviewing rankings.
Year-to-date commercial growth patterns
Because vertical authorizations, seasonal tourism, and regulatory changes can all affect short-term patterns, readers should treat year-over-year comparisons as a starting point and consider multi-year context for more stable insight.
Policy and tax implications
Record commercial activity in 2024 translated into higher state and local tax receipts in many jurisdictions, drawing legislative attention to both potential revenue and regulatory oversight needs identified in the AGA State of the States materials AGA State of the States 2025 tax highlights.
Policymakers considering new authorizations or tax changes look at how revenue flows, employment impacts, and local benefits balance against regulatory and social considerations.
How to use these rankings: decision criteria for readers
If you are a visitor or tourist
If you are planning travel, prioritize casino counts and local vertical availability to judge access and experience rather than raw state revenue totals; a destination with a few major resorts may offer different experiences than a state with many smaller venues State of Play.
Consider per-capita signals if you want a sense of how intensely gaming features in local economies and visitor flows.
If you are a researcher or reporter
Use AGA's State of the States commercial revenue as the primary dataset and normalize by Census population estimates for per-capita analysis, and be explicit about whether tribal figures are included or kept separate State of the States 2025. For a note on reproducible methods, see our writeup on evaluations how Funded Plays evaluations work.
Retain original tables and document any allocation choices so readers can reproduce your results.
If you follow policy or taxation issues
Policy analysis should combine revenue totals, tax treatment, and local economic impact studies. AGA's tax highlights and the commercial revenue tables provide a practical starting point for fiscal assessment AGA State of the States 2025 tax highlights.
When tribal operations are relevant to state budgets, ask state regulators or tribal authorities for the most granular, state-level aggregates available and disclose methodology when combining sources.
Common mistakes and how to avoid them when comparing states
Mixing regional tribal data with state totals
Do not combine NIGC regional tribal totals with state commercial totals without a clear allocation method, because the NIGC reports by region and not by state, which can misstate state-level activity NIGC FY 2024 gross gaming revenue announcement.
Instead, present tribal figures separately or use state-compiled tribal aggregates when available.
Relying on single-year revenue without context
Single-year changes can be driven by one-off events, new vertical launches, or large property openings; use multi-year trends from the AGA tracker to avoid overinterpreting short-term shifts Commercial Gaming Revenue Tracker.
Present year-over-year context alongside multi-year averages for more stable analysis.
Ignoring per-capita and tourism effects
Failing to normalize by population hides intensity differences. Use Census population estimates to create per-capita measures that better reflect how concentrated gambling activity is relative to resident populations U.S. Census Bureau population estimates.
When tourism is large relative to resident populations, label findings as tourism-inflated where appropriate.
Practical scenarios: examples showing how metrics change conclusions
A tourist choosing a destination
A visitor deciding where to go should weigh casino counts and the presence of integrated resorts rather than a state's total receipts, because counts and venue types determine the available experience State of Play.
Per-capita signals help if you want to know whether a destination is a concentrated gaming hub relative to local population.
A researcher building a statewide dataset
A researcher should combine AGA commercial revenue with Census population numbers to create per-capita variables and then note NIGC regional reporting limits for tribal data; document every step so results are reproducible State of the States 2025.
When tribal totals are material, seek state regulator or tribal reports for state-level allocation before mixing sources.
A policymaker reviewing tax receipts
Policymakers looking at fiscal impact should consult AGA's tax highlights and examine how gross receipts translate into state and local revenue in their jurisdiction, including any recent authorizations for new verticals that affect taxable bases AGA State of the States 2025 tax highlights.
Policy reviews should be transparent about what is included and should model scenarios that reflect new authorizations or market expansions.
Conclusion and where to go for official state data
Short recap of the best single metric
For a straightforward, defensible answer to which states have the most gambling, use AGA's commercial gaming revenue for 2024 as the primary comparator, and supplement with per-capita adjustments to compare intensity across states State of the States 2025.
Remember that tribal reporting by the NIGC is regional, so include explicit methodology notes when combining sources and consult state regulators for state-level tribal aggregates NIGC FY 2024 gross gaming revenue announcement. For related resources, visit Funded Plays Funded Plays.
When presenting state comparisons, disclose whether tribal receipts are included, indicate the NIGC regional reporting limitation, and point readers to state regulators or tribal authorities for state-level tribal aggregates when available NIGC FY 2024 gross gaming revenue announcement.
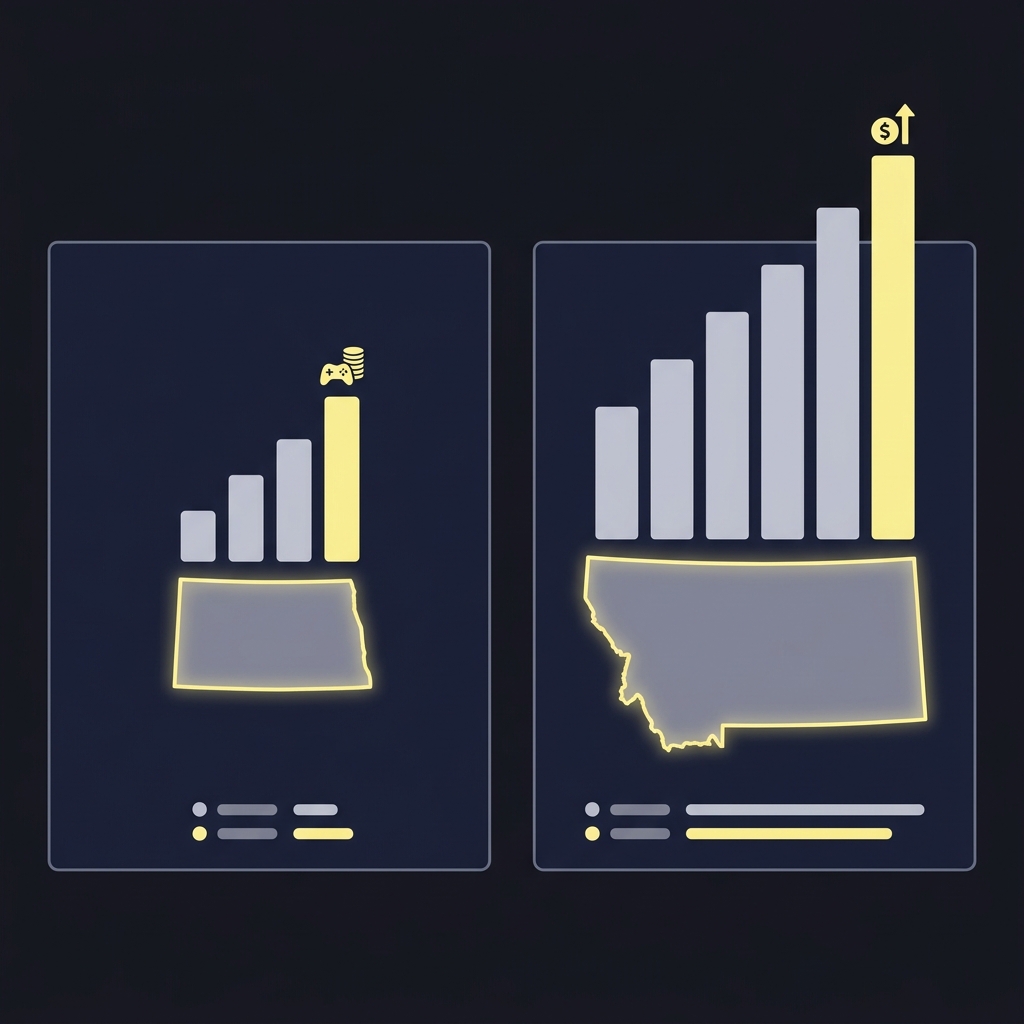
It primarily uses commercial gaming revenue for 2024 as reported by the AGA, and supplements that with per-capita and casino-count views for different purposes.
NIGC tribal revenue is reported by region, so state-level tribal totals are not automatically included; include them only if state-level aggregates are available and transparently documented.
Start with AGA's State of the States commercial revenue tables and the U.S. Census population estimates, and consult NIGC regional reports for tribal context.