
What 'sharp' means in sportsbook markets
Definition of sharpness and market efficiency
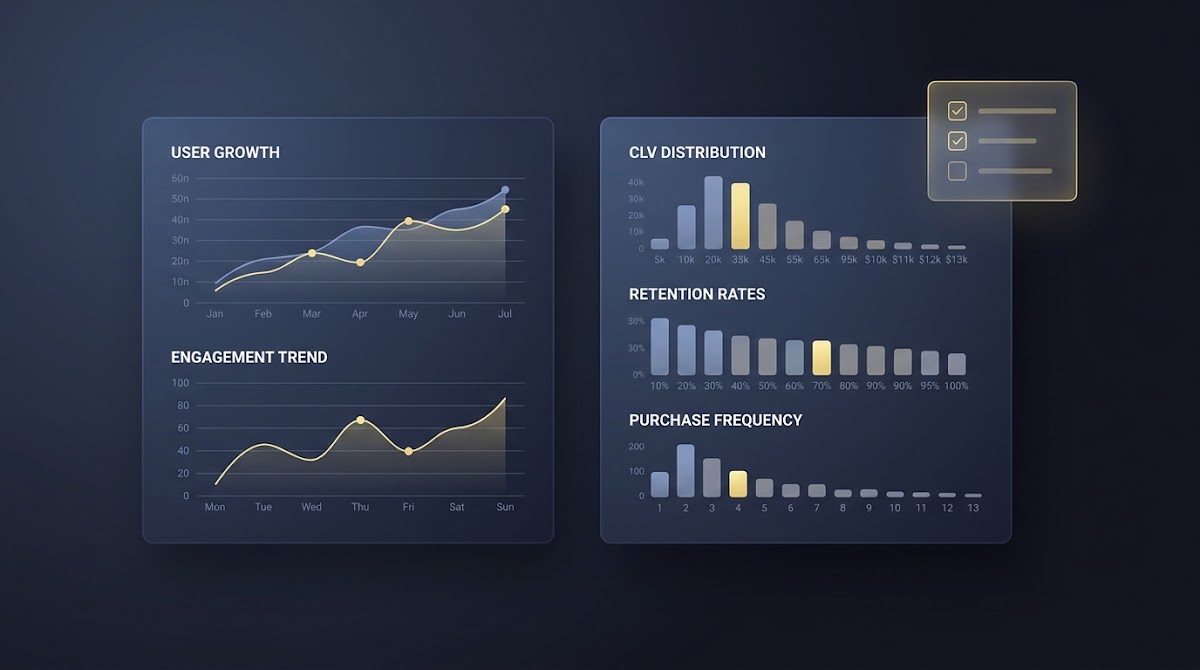
In practical terms, a "sharp" bookmaker is one whose posted prices tend, on average, to move toward more efficient closing values, signaling that the market incorporates informed money and public signals consistently. The clearest, operational way to capture that tendency is Closing Line Value, or CLV, which compares a bettor's entry price to a later, robust closing reference rather than relying on subjective labels.
Closing Line Value is widely used by analysts and handicappers because it gives an event-level measure of whether early prices were good or poor relative to the market consensus at close, making CLV a defensible benchmark for evaluating price efficiency Closing Line Value explainer.
Measure closing line value across many events using a robust closing composite, normalize results for hold and handle, stratify by sport and bet type, and corroborate price leadership with posted limits and house-rule disclosures to build a repeatable ranking.
Why sharpness matters for bettors and pricing
Bettors and researchers care about sharpness because consistently beating recreational books even by small margins compounds into meaningful advantage over time; conversely, a book with wide built-in hold or noisy pricing raises the effective cost of bets and can hide genuine edges. Understanding sharpness lets you choose venues and strategies that align with your objectives and stake size.
Comparisons need real market inputs rather than brand claims; regulated U.S. operator reporting supplies handle and revenue figures that let analysts normalize for market structure when comparing books across time and products AGA state survey and industry summary.
Key metrics you can measure: CLV, hold, and limits
Closing Line Value explained in practice (sharpest sportsbooks)

CLV is calculated at the event level as the difference between the price at which a wager would have been placed and a robust closing reference price, then aggregated (for example as a median) across many events to measure long-run efficiency. Analysts often prefer median CLV to mean CLV because medians reduce skew from a handful of extreme moves.
Practically, you need a reliable closing composite to serve as the reference and a consistent capture cadence for pregame prices so CLV comparisons are repeatable and auditable; many practitioner guides outline those methodological basics Pinnacle primer on CLV.
How hold or vig changes effective prices
Hold, or vig, is the house take embedded in posted prices and it changes the effective price a bettor receives compared with a theoretical 0% hold market. Two books with identical CLV profiles can feel very different to bettors if one consistently charges higher hold, so any sharpness comparison must account for effective vig by sport and period.
State-level revenue and handle reports provide the inputs needed to compute operator-level hold across products and seasons, which lets you normalize CLV metrics to reflect true bettor economics Legal Sports Report revenue tracker.
Limits and posted market depth as complementary signals
Posted limits and house-rule disclosures are observable, non-price signals of market depth and an operator's risk appetite; high limits on specific markets suggest willingness to lay larger positions, which often correlates with more confident, market-oriented pricing.
Reading operator house-rule catalogs and limit schedules reveals operational constraints and settlement practices that matter to large-stake bettors and can corroborate price-based leadership identified through CLV analysis Massachusetts Gaming Commission house rules.
A repeatable 2026 test framework for ranking sharpness
Sampling pregame prices and building a closing composite
Design a repeatable pipeline by first defining the universe of events and the capture cadence for pregame snapshots, then assemble a closing composite built from a stable set of late-window pricing sources so the reference is robust to any single operator's artifacts. Use the same capture rules across operators and time windows to avoid selection bias.
For practical implementation, sample multiple pregame times (for example early, mid, and two hours before start) and ensure the composite closing price is created from late-window data; methodological guides stress that consistent capture times and a robust composite are essential for reliable CLV measurement Closing Line Value explainer.

Try the CLV testing checklist and methodology worksheet
Try the checklist in this section on a small sample of events to see how median CLV changes after normalization; the exercise helps you understand the sensitivity of rankings to capture cadence and composite choice.
Computing median CLV, price drift, and leader-follower metrics
Compute per-event CLV as the price delta relative to the closing composite, then report median CLV and the CLV distribution to show central tendency and tails. Measure price drift or volatility by tracking how much pregame prices move over the capture window, and summarize leader-follower relationships by timestamping price updates and counting which operators initiate moves more often than they follow. You can also use a free CLV calculator here.
These metrics give a multi-dimensional view of sharpness: median CLV for efficiency, drift for stability, and leader-follower counts for directional market influence, which together provide stronger evidence than any single measure alone Pinnacle primer on CLV.
Stratifying results by sport and bet type
Always stratify results by sport, bet type, and liquidity band. A book that looks highly efficient on NFL spreads may be far less so on niche markets or preseason games, so per-sport reporting avoids conflating high-liquidity advantages with true operator-level skill.
Regulated market trackers and state reports help with stratification by supplying handle and revenue slices you can use to create liquidity bands and season windows for fair comparisons Legal Sports Report revenue tracker.
Which data sources to trust and how to normalize them
State reports and industry surveys
Primary inputs for normalization come from regulated state reports and industry surveys that publish handle, revenue, and operator-level hold by sport and time period. These documents are the backbone for fair comparisons across regulated U.S. operators because they reveal structural differences in market size and retained revenue.
For example, aggregated state reports and industry surveys supply the per-sport handle needed to weight or normalize CLV so that books operating in larger markets are not unfairly advantaged in rankings AGA state survey and industry summary. Also see U.S. sports betting statistics U.S. sports betting statistics.
Third-party trackers and composites
Third-party trackers that publish operator revenue snapshots and pricing archives are useful for constructing closing composites and for cross-checking your own captures. Use trackers as one input to a composite rather than the sole source to reduce single-source bias.
Legal and industry trackers provide timely aggregates and historical series you can reference when reconciling your CLV results with publicly reported operator performance Legal Sports Report revenue tracker.
Normalizing for handle, seasonality, and liquidity
Normalization techniques include per-handle CLV (dividing aggregate CLV by operator handle in the same window), per-event median CLV with liquidity buckets, and season-window weighting that compares like-for-like periods. Choose one or more methods and report results side by side so readers can see sensitivity to normalization choices.
State-level monthly reports and trackers supply the handle and revenue inputs you need to compute per-handle adjustments and to form rolling-season windows for consistent comparison across time Colorado Division of Gaming sports betting reports.
How to compare books across sports and time
Why sport-specific comparisons are necessary
Different sports have different liquidity patterns, market participants, and seasonal cycles. Comparing CLV across operators without separating sports biases results toward books that are strong in high-liquidity markets, rather than revealing general pricing acumen.
To avoid that bias, create sport-specific leaderboards and aggregate only with weighted methods that reflect handle or event counts; industry sources provide the necessary segmentation to support that approach Legal Sports Report revenue tracker.
Per-event and per-handle normalization methods
Per-event median CLV treats each event equally, useful when you care about consistent pricing across many events. Per-handle normalization weights CLV by the amount of money wagered, which highlights efficiency where liquidity matters most. Present both to show tradeoffs and be explicit about which you use for final rankings.
State and operator reports let you compute per-handle adjustments so you can transparently show how normalization affects leaderboard orderings and why a book may climb or fall when handle-weighted metrics are applied AGA state survey and industry summary.

Using season windows and rolling samples
Use rolling windows and season-specific analyses rather than single snapshots. Rolling samples reduce the chance that transient events or short-term rule changes distort long-term rankings, and they let you monitor trends in sharpness rather than static snapshots.
Re-running analyses on consistent windows and reconciling results with state and industry reporting helps you detect structural changes in operator behavior and avoid overreacting to short-lived anomalies Legal Sports Report revenue tracker. See how FundedPlays evaluations work.
Interpreting CLV and leader-follower behavior
When CLV indicates skill versus noise
CLV that persistently favors an operator across many independent events suggests genuine price efficiency, while positive CLV in very small samples is likely noise. Use median CLV with sample-size thresholds to separate durable signals from luck.
Methodological guides recommend minimum sample sizes and use of medians to avoid over-interpreting short-run CLV performance Closing Line Value explainer. See the propsbot.ai glossary on CLV.
Detecting market leaders and followers
Leader-follower detection relies on timestamped price snapshots. By counting who moves first and who follows, you can identify operators that consistently start price moves, a behavior associated with informed pricing or willingness to take early positions.
Use time-sequenced snapshots and simple leader counts to flag probable market leaders, and corroborate those findings with limit schedules and house rules for a fuller picture Pinnacle primer on CLV.
Common statistical artifacts to watch
Watch for artifacts like late-window jumps that look like leadership but are reactive, timestamp mismatches between capture systems, and sparse-event bias where thin markets create misleading CLV readings. Explicitly document how you handle these in your pipeline.
Clearly describing timestamp rules and outlier filters reduces the risk of spurious leader signals and makes your ranking reproducible and auditable Closing Line Value explainer.
Limits, house rules, and market depth as secondary signals
How posted limits reveal risk tolerance
Posted limits indicate how much exposure an operator is willing to accept on a given market, which is a practical proxy for market depth. Higher limits generally allow larger professional stakes and suggest stronger appetite for liquidity provision in that market.
Because limits are an operational disclosure rather than a price, they should be used alongside CLV to understand whether observed efficiency translates into usable liquidity for your stake sizes Massachusetts Gaming Commission house rules.
Reading house-rule catalogs for operational signals
House-rule catalogs typically list settlement rules, bet acceptance policies, and limit schedules. These elements impact how large bets are handled and whether certain markets may be voided or adjusted, so read them as part of your sharpness due diligence.
House rules give context to price leadership: an operator that posts tight prices but has restrictive acceptance policies may not be practical for large-stake strategies, so cross-reference both sources when deciding where to place bigger wagers Massachusetts Gaming Commission house rules.
quick closing-line calculator for per-event CLV
Use consistent price formats
Corroborating limits with observed price leadership
Compare posted limit schedules against observed leader-follower behavior to check whether price leadership corresponds to actionable liquidity. If an operator leads prices but limits are low, leadership may reflect informational influence rather than capacity to accept large stakes.
Cross-checks between limits and price data strengthen evidence that a leader is also a book where larger stakes can be executed without immediate limit calls Pinnacle primer on CLV.
Practical workflow: building and validating your ranking
End-to-end pipeline from price capture to ranking
Build a pipeline that captures pregame snapshots at fixed intervals, stores them with precise timestamps, constructs a closing composite, computes per-event CLV, stratifies by sport and bet type, normalizes for handle, and ranks operators by chosen metrics. Keep the pipeline modular so individual steps can be re-run or audited independently.
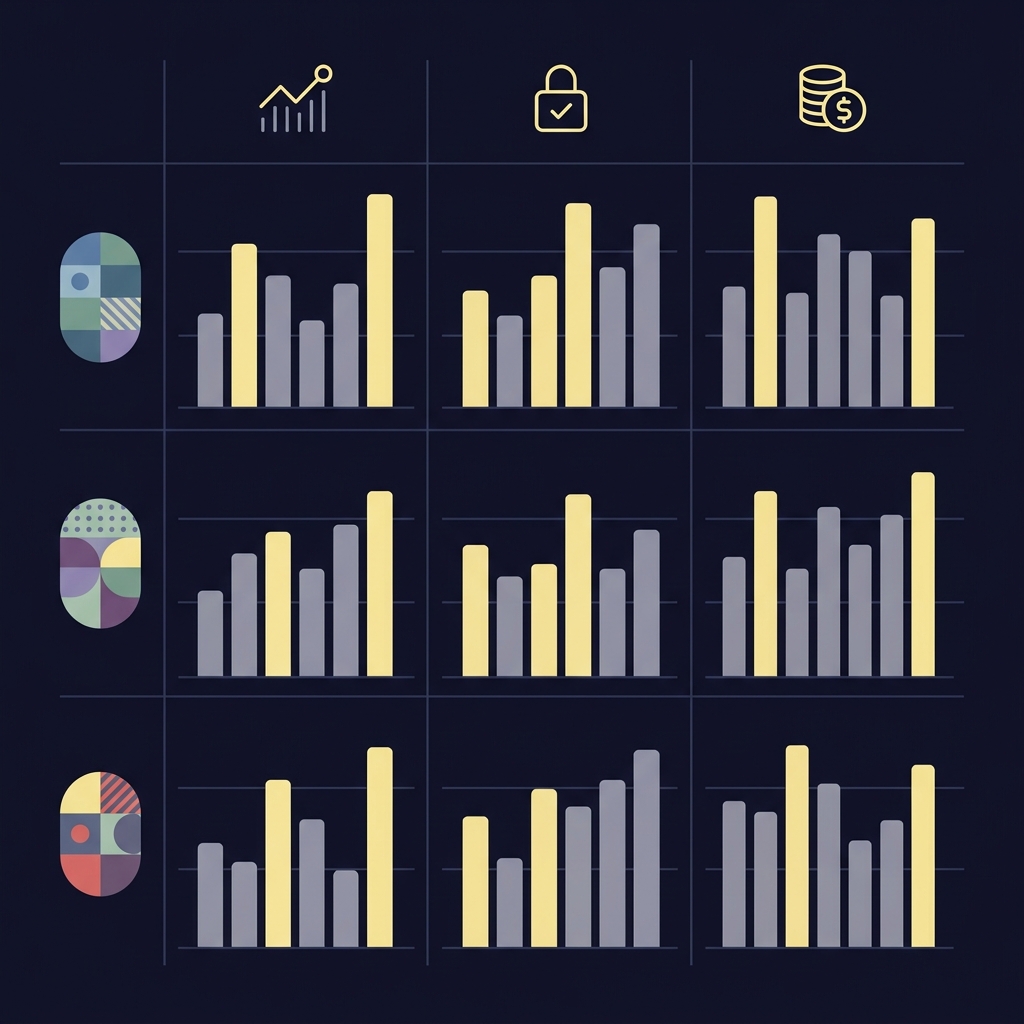
Explicitly log capture cadence, composite composition, and normalization choices so you or others can reproduce results and understand why rankings changed between runs Closing Line Value explainer.
Validation steps and sanity checks
Validation includes sample-size thresholds, outlier removal rules, and reconciliation with state-level revenue and handle reports. If your sample for a given operator and sport is too small, exclude it from the leaderboard or flag it with a confidence score.
Use state and industry reports to reconcile aggregate handle and revenue so your per-handle adjustments and sample thresholds are grounded in public data rather than purely internal snapshots AGA state survey and industry summary.
Documenting and versioning your dataset
Version datasets and code, document methodology changes, and publish changelogs for each ranking iteration. Reproducibility is essential if you plan to use sharpness rankings in research or share them with other bettors.
Good documentation includes the capture times, composite sources, sample sizes per sport, and normalization parameters so readers can evaluate your methodological choices independently Closing Line Value explainer.
Decision criteria: choosing a sportsbook based on sharpness
When CLV should guide your choice
If your strategy relies on finding small, repeatable pricing edges, prioritize operators with consistently positive median CLV over long windows, especially in the sports you trade. CLV shows long-run price efficiency and helps identify venues where early edges are real rather than illusory.
Combine CLV evidence with hold data so you choose operators that not only offer efficient prices but also charge reasonable vig for your market and stake size Legal Sports Report revenue tracker.
Balancing low hold, liquidity, and limits
Low hold reduces long-run costs, but liquidity and limits matter more at larger stakes. A low-hold book with restrictive limits may be ideal for small recreational bettors, while sharps with large exposure needs must balance moderate hold against higher limits and stable leadership.
Use per-handle normalization and posted limit checks to see how a candidate operator performs under the practical constraints of your typical stake sizes Colorado Division of Gaming sports betting reports.
Practical tradeoffs for different bettor profiles
For small-stake recreational bettors, prioritize low hold and clear pricing that favors mid-line consistency. For professional or high-volume bettors, prioritize demonstrated leader behavior plus high posted limits and predictable acceptance policies.
Document the tradeoffs you accept and re-run rankings periodically to confirm that your chosen operator maintains the profiles you relied on when making your decision AGA state survey and industry summary.
Common mistakes and how to avoid them
Small-sample CLV and selection bias
One common error is drawing conclusions from small samples, which produces volatile CLV estimates. Avoid this by enforcing minimum event counts and using medians rather than means to summarize CLV.
Document sample sizes and either exclude or flag low-confidence results so consumers of your rankings understand the underlying uncertainty Closing Line Value explainer.
Ignoring hold and product mix
Failing to account for hold or the product mix biases comparisons toward books with lower effective costs or different focus markets. Normalize CLV for handle and report sport-level metrics to avoid misleading rankings.
Use state reports and industry trackers as the ground truth for handle and revenue so normalization is based on public, audited inputs rather than inferred volumes Legal Sports Report revenue tracker.
Confusing late line moves with price leadership
Late line jumps can appear as leadership in naive leader counts but often reflect reactive balancing or sharp betting flowing into the market. Use timestamped, sequenced snapshots and check context before labeling an operator a leader.
Combine time-sequence analysis with limit checks and house-rule reviews to distinguish genuine early leadership from late reactive moves Pinnacle primer on CLV.
Examples and scenarios that illustrate sharpness testing
Comparing NFL regular season and preseason markets
In the NFL regular season, liquidity is high and CLV signals tend to stabilize with large samples; in preseason or obscure leagues, sparse action can create misleading CLV. Run separate leaderboards for regular season and preseason so you do not conflate the two.
State revenue and handle reports can confirm that aggregate liquidity is higher for regular-season NFL, which justifies using different sample thresholds for preseason comparisons Legal Sports Report revenue tracker.
NBA game markets and liquidity patterns
NBA markets often have deep liquidity for spreads and totals, but certain prop markets are thin. Stratify NBA analyses by market type so CLV for team lines is not mixed with thin prop markets that require different treatment.
Use per-handle buckets to separate deep NBA markets from niche props so a book that is efficient on team markets does not get penalized for weak pricing in low-liquidity props Colorado Division of Gaming sports betting reports.
A hypothetical cross-operator leader-follower case
Imagine Operator A consistently moves first on spreads while Operator B follows; if Operator A also shows better median CLV, the pattern suggests Operator A is providing informative pricing. If Operator A has low limits, however, leadership may be informational rather than actionable for large bettors.
Combine leader-follower counts with limit schedules and hold normalization to judge whether leadership is linked to practical execution capacity Pinnacle primer on CLV.
Monitoring sharpness over time and automating checks
Setting periodic re-runs and alerts
Re-run rankings on rolling windows and set alerts for sustained CLV drift or sudden changes in leader behavior. Threshold-based alerts based on median CLV or leader counts let you react when an operator changes policy or liquidity posture.
Establish sample-size minimums for alerting so you do not chase spurious signals from small-event sets Closing Line Value explainer.
Versioning and auditing changes
Version your datasets and keep changelogs for composite compositions, capture cadence, and normalization parameters. Auditing ensures that shifts in rankings have a documented cause rather than being the result of silent methodology drift.
Good versioning practices make it possible to roll back to prior analyses and to explain why a given operator's rank changed between runs Closing Line Value explainer.
Practical automation tips without proprietary tools
Schedule regular price snapshots, automate composite construction scripts, and generate summary tables and visualizations that highlight median CLV, leader counts, and limit coverage. Keep the pipeline simple and repeatable so it can run on modest infrastructure.
Automate basic sanity checks like sample-size thresholds and timestamp consistency to reduce manual review time and surface only actionable anomalies AGA state survey and industry summary.
Summary checklist and next steps
Quick checklist to evaluate a sportsbook's sharpness
Collect pregame prices with consistent cadence, construct a robust closing composite, compute per-event CLV and median CLV, normalize for hold and handle, check posted limits and house rules, and stratify by sport and bet type before ranking.
State reports and industry trackers provide the public inputs you need to normalize and validate your results, enabling repeatable comparisons without relying on brand claims Legal Sports Report revenue tracker. Read more on our blog.
How to apply findings to your betting or research
Use the rankings to match operators to your stake size and strategy, favoring low-hold, high-liquidity operators for large-volume strategies and low-hold consistent operators for small-stake approaches. Re-run the analysis periodically to adapt to operator changes. See Funded Plays.
Remember that rankings indicate historical relative efficiency and should inform but not guarantee decisions about where to place money.
Responsible participation and limitations
Sharpness metrics are tools for research and decision-making and do not guarantee outcomes or profits. Use them as part of disciplined risk management and avoid assuming that past efficiency ensures future performance.
Public state reports and industry sources support repeatable comparisons, but they do not predict future operator behavior or guarantees about bet acceptance or payouts AGA state survey and industry summary.
CLV is the difference between the price you get and a robust closing reference price for the same market, aggregated across events, typically summarized with medians to reduce skew.
Hold changes the effective price bettors receive; without adjusting for hold or handle, comparisons can favor books that simply charge lower vig rather than true pricing efficiency.
CLV indicates pricing efficiency but not execution capacity; use posted limits and house rules together with CLV to judge whether a book can handle your stake size.
References
- https://unabated.com/articles/closing-line-value/
- https://www.americangaming.org/resources/state-of-the-states-2025/
- https://www.pinnacle.com/en/betting-articles/educational/closing-line-value/
- https://www.legalsportsreport.com/sports-betting/revenue/
- https://massgaming.com/sports-wagering/house-rules/
- https://sbg.colorado.gov/sports-betting-reports
- https://www.fundedplays.com/challenges
- https://propsbot.ai/glossary/closing-line-value/
- https://rg.org/statistics/us
- https://app.numberedge.com/free-tools/clv-calculator
- https://www.fundedplays.com
- https://www.fundedplays.com/blogs
- https://www.fundedplays.com/blogs/how-fundedplays-evaluations-work