
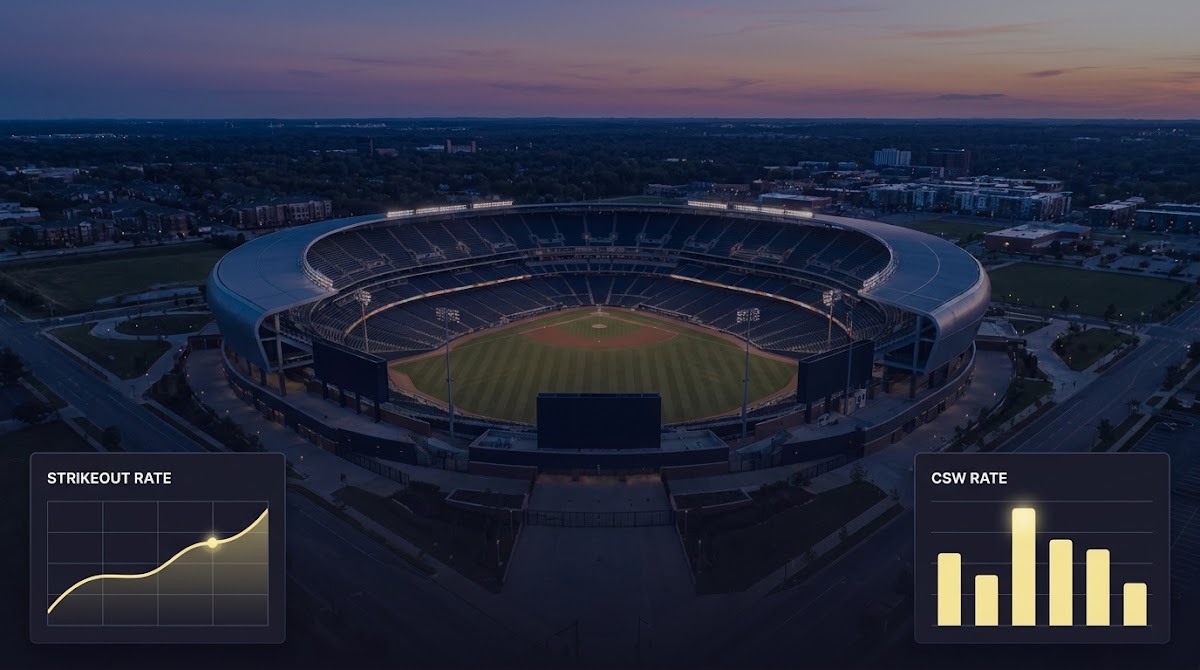
What are pitcher strikeout props?
Definition and how lines are shown
A pitcher strikeout prop is a player prop market that prices the expected number of strikeouts a starting pitcher will record in a game. In practice you see those markets displayed as a simple over/under line, for example Over 6.5 or Under 6.5 strikeouts, and the number represents the market projection for that starter's likely total.
Bookmakers do not invent these lines arbitrarily. They begin with projection baselines derived from season and recent performance, then translate those projections into a posted over/under and adjust for roster news and demand. This market construction process is what creates a readable line that bettors can compare to their own projection models. For an overview of how player prop lines are set and moved, see a practical explanation on how bookmakers set and move player prop lines Pinnacle Insights player props explained.
Not every strikeout number is equally useful. Surface totals like K/9 are simple but can mislead if you use them alone. K/9 measures strikeouts per nine innings, which requires an innings expectation to be meaningful. By contrast, rate metrics that normalize by batters faced, such as strikeout rate or K%, tell you how often a pitcher records a strikeout each time a batter comes to the plate. For why K% is the preferred skill indicator, consult the FanGraphs guide to strikeout rate FanGraphs strikeout rate (K%).
Key metrics to evaluate strikeout props
Why K% is preferred over K/9
K% is the share of batters faced that a pitcher strikes out, and it normalizes performance across differing inning totals and usage patterns. Using K% keeps your projection grounded in how often a pitcher creates strikeouts rather than how many innings they happen to pitch. That normalization is especially important when converting a rate into a forecasted total for an over/under line, and it is the cornerstone of metric-first evaluation because it avoids false precision that comes from relying on K/9 alone FanGraphs strikeout rate (K%).
K/9 still appears in box scores and fantasy feeds, and it has practical value when you have a reliable innings projection. But if you start with K/9 without a strong innings estimate you can over- or under-weight a pitcher's actual strikeout skill. Treat K/9 as a descriptive stat rather than the starting point for a prop forecast, and convert it to a rate-based expectation when possible.
CSW% as a leading indicator and how to pair it with pitch usage
CSW% measures called strikes plus whiffs and functions as a nearer-term predictor of a pitcher's ability to produce strikeouts when combined with pitch usage and swinging strike rates. CSW% captures how often a pitcher generates misses and called strikes, which translates into strikeout opportunity. For a practical primer on CSW% and why it matters, see the explanation of CSW% as a leading indicator Pitcher List CSW% primer.
Use CSW% in combination with pitch usage data. A rising CSW% with a stable or heavier usage of a breaking pitch suggests growing strikeout upside. Conversely, a high CSW% that comes with reduced velocity or diminished secondary movement may be less predictive. When you pair CSW% with whiff and swinging strike metrics you get a clearer short-term view of strikeout production than either metric alone.

Start with K% to measure strikeout skill, use CSW% and pitch usage for short-term signals, adjust for opponent tendencies and park factors, and use CLV tracking to judge timing and value.
Opponent and lineup context to layer on the metric view
Opponent tendencies are a force multiplier for your baseline rate. Teams that swing-and-miss more often or have higher team K% give a strikeout-prone starter more opportunities to exceed a line, while lineups with low strikeout rates or favorable handedness splits make overs harder to reach. Park characteristics matter too, and yearly park factors can help you nudge a projection up or down for venue-specific trends. Consult seasonal park factor summaries to calibrate how much the ballpark might change expectation 2024 MLB park factors.
Combine opponent K% and handedness splits with your pitcher-level K% and CSW% to form a layered probability picture rather than relying on a single headline stat. This layered approach reduces the risk of being misled by one noisy input and puts matchup context at the center of your decision process.
How sportsbooks and markets set pitcher K lines
Projection inputs and baselines
Sportsbooks start with statistical projections: a mix of season rates, recent form, matchup adjustments, and usage expectations. That baseline is then converted into a numeric strikeout line for each starting pitcher. The book will often provide an initial market price and then staff or algorithms adjust for exposure and early information.
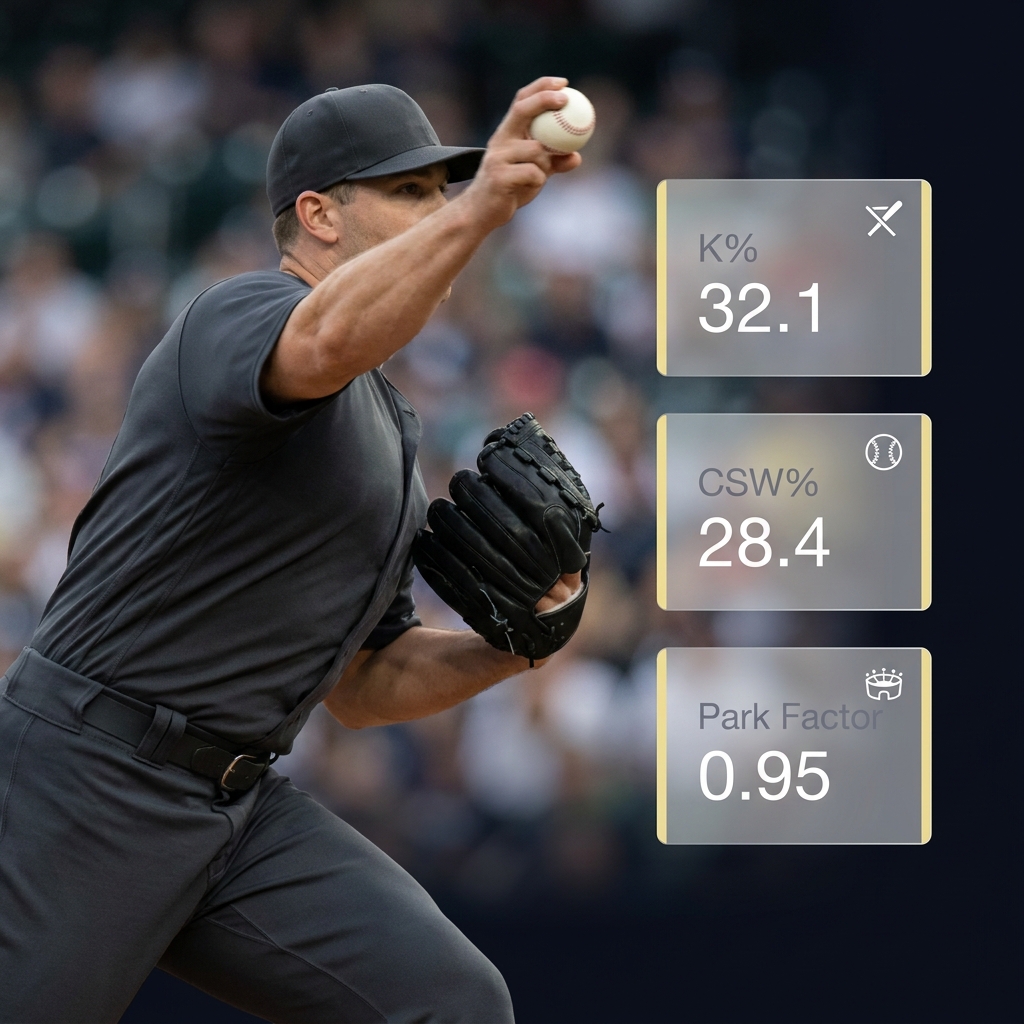
When you are assessing a posted line, think of it as the market synthesis of projection plus risk management. The initial line is useful as a benchmark because it represents a neutral, professionally calibrated expectation before large amounts of money or breaking news move it.
Line movement drivers: news, liquidity, and sharps
Lines move for rational and practical reasons. Injury or lineup news can force quick adjustments. Large bets from sharp bettors or imbalanced action can also push a line to reprice exposure. Liquidity matters: thin markets can show volatile swings that overstate an edge if you do not understand the context. For an accessible explanation of market movement and the role liquidity plays, see a practical guide to closing line value and market behavior What Is Closing Line Value (CLV).
Be cautious about assuming any single line move implies a permanent edge. Some moves reflect information that a market has already priced, and some moves reflect temporary exposures that can revert when more balanced action arrives.
Closing line value (CLV) as an edge benchmark
Closing line value is the difference between the price you took and the closing market price. It is a practical performance metric that tells you whether your selection beat the market consensus. Tracking CLV over time gives disciplined bettors a signal about whether their process is adding value versus simply getting lucky on volatile lines CLV primer.
CLV is not proof of future gains on its own, but consistent positive CLV suggests your projections or timing are aligned with long-term market edges. Use it as a measurement tool and integrate CLV tracking into your postgame review process rather than treating it as a guarantee.
Decision framework: when to take an over or under
Assess innings and expected batters faced
Step one is converting rate metrics into expected totals, and that requires an innings or batters faced estimate. A pitcher's K% gives you strikeouts per batter faced, so multiply K% by an innings-based batter count to get a baseline projection. If innings are uncertain, explicitly fold that uncertainty into your probability estimate instead of pretending the innings number is fixed.
For example, if a starter has a strong K% but early-season pitch-count concerns exist, your expected batters faced may shrink and turn an over into a no-play. Always test how sensitive your projection is to small changes in expected batters faced before you commit.

Matchup factors: opponent K% and handedness
Next, apply matchup adjustments. A team that strikes out at a well-above-average rate will amplify a pitcher's K% advantage, while a contact-heavy lineup will mute it. Handedness splits matter for specific pitchers: same-handed matchups can lower strikeout expectancy for some styles and raise it for others. Combine these matchup tweaks with park factor adjustments for a fully contextual baseline 2024 park factors.
After you adjust for lineup and park context, compare your adjusted projection to the posted line. If your projection implies a materially higher probability of clearing the posted over, then you may have a value opportunity; if it is lower, the under becomes the safer selection.
Simple projection calculator to convert K% and expected batters faced into a strikeout probability
Use conservative battter estimates
Price versus projection using CLV and projected probability
Estimating value requires converting your projection to an implied probability and comparing it to the market. If your projected chance of the pitcher reaching the posted over exceeds the market-implied chance, that is the basic definition of value. Use CLV history to inform whether your probability estimates historically align with better-than-market outcomes CLV guidance.
Size your action according to conviction and edge. When you have a small but repeatable edge, using modest sizing and disciplined record-keeping will preserve capital and allow you to compound learning over time. Add a final check for park factors and any late news before sending the bet.
Common mistakes and cognitive traps
Overreliance on K/9 or raw totals
A frequent error is trusting K/9 as the primary input. K/9 can hide the true strikeout skill because it depends on innings. Switch to K% as your primary skill metric and use K/9 only with a clear innings expectation to avoid this trap. For support on why K% is preferable, review the FanGraphs guidance on strikeout rate FanGraphs strikeout rate (K%).
Corrective action: build your baseline from K% and convert to a total using your best estimate of batters faced, then stress-test the result across reasonable innings ranges.
Ignoring park and lineup context
Ignoring park effects or opponent composition systematically biases projections. Some parks modestly increase or decrease strikeout outcomes, so fold park factors into your projection process. Use seasonal park factor summaries as a quick calibration tool 2024 MLB park factors.
Corrective action: maintain a simple lookup for park adjustments and always apply the same neutral rule set so you do not cherry-pick when to use park context.
Chasing late line moves and small samples
Chasing late line moves without understanding the drivers is risky. A line that moves substantially may reflect meaningful information or simply illiquid market swings. Track CLV and the history of your timing decisions to understand whether you are consistently out-timing the market or merely riding noise CLV primer.
Corrective action: use a simple rule such as only tracking CLV moves that are accompanied by verifiable news or clear sharp activity, and avoid reacting to every small price shift.
Practical examples and scenarios
Example 1: high-K starter versus weak-plate-discipline lineup
Start with the pitcher K% and a current CSW% reading to build a baseline projection. Against a lineup that posts a high team K%, the matchup increases strikeout opportunity. Convert the rate to an expected total using your expected batters faced, then compare that projection to the posted line. If your projection is meaningfully higher, you may have value, and you would confirm with CLV history to ensure timing is consistent with your process FanGraphs K% reference.
Example 2: sinker/groundball pitcher in a strikeout-friendly park
Here the baseline K% may be modest, and CSW% may not be elevated. A strikeout-friendly park can nudge the projection upward, but a groundball profile usually limits upside. After combining K%, CSW%, and the park factor, you might find the posted line slightly aggressive for an over play. Use CLV tracking to determine whether the market tends to over-adjust in these matchups CSW% primer.
In short, a park advantage rarely converts a contact-oriented starter into a reliable over without corresponding CSW% or pitch-profile signals.

Example 3: short outing expected due to pitch-count or bullpen concern
If you expect a shortened outing, the same K% translates to fewer total strikeouts. That makes the posted line harder to beat even if the rate metrics look favorable. Run sensitivity checks on expected batters faced and treat reduced innings as a primary factor in your decision. Check CLV tendencies around early hooks or pitchers with recurring pitch-count limits before committing.
Always state that these are illustrative scenarios and users should treat them as a method demonstration rather than a prediction of outcomes.
Quick model checklist and tools to use
Minimum data points to collect
Collect the core metrics before placing a selection: K%, CSW%, opponent team K%, park factor, and an estimate of expected innings or batters faced. These inputs make the decision tractable because they separate skill from context and volume.
Keep a simple spreadsheet to log each selection, the line taken, your projected probability, and the closing market price so you can calculate CLV over time. That history is crucial for learning whether your approach is producing value.
Simple probability and sizing checklist
Use a five-step checklist before committing: 1) Confirm the starter and lineup, 2) Convert K% to a projected total using expected batters faced, 3) Apply opponent and park adjustments, 4) Compare your projected probability to the market-implied probability, and 5) Size according to conviction and CLV history. These steps are concise and repeatable.
Track CLV and keep a line history log to evaluate long-term performance rather than judging by single results. This disciplined record-keeping separates process from luck and helps refine your model over time CLV reference.
Conclusion: disciplined strikeout prop play
Pitcher Strikeout Props Explained centers on a metric-first approach that treats K% as the primary strikeout skill indicator and CSW% as a short-term leading signal. Combine these metrics with park factors and CLV tracking to make disciplined decisions rather than reacting to surface totals.
Practice disciplined prediction with structured challenges
If you want a practical place to apply disciplined projections and track your selections, set up a simple logging process and commit to recording CLV for every play.
Discipline and measurement matter more than fancy heuristics. Use K% as your foundation, layer CSW% and opponent context on top, and let consistent tracking guide sizing and timing decisions. No method guarantees results, but a structured, metric-first process gives you the best chance to identify repeatable edges. Visit Funded Plays for more resources.
Strikeout rate, or K%, is the most reliable single stat because it normalizes strikeouts by batters faced and reflects true strikeout skill.
CSW% captures called strikes plus whiffs and works as a near-term indicator of strikeout potential when paired with pitch usage and swinging strike data.
CLV shows whether your timing and projections beat the market; consistent positive CLV suggests your process may offer long-term value.
References
- https://www.pinnacle.com/en/betting-resources/educational-resources/player-props-explained
- https://library.fangraphs.com/pitching/strikeout-rate-k/
- https://www.pitcherlist.com/csw-called-strikes-plus-whiffs/
- https://www.baseball-reference.com/leagues/MLB/2024-factors.shtml
- https://unabated.com/articles/what-is-closing-line-value/
- https://www.fundedplays.com/challenges
- https://baseballsavant.mlb.com/leaderboard/statcast-park-factors
- https://www.espn.com/fantasy/baseball/story/_/id/47896015/fantasy-baseball-new-2026-home-stadiums-royals-rays-stats-projections-stats
- https://www.fantasypros.com/2026/02/mlb-park-factors-overview-targets-fantasy-baseball/
- https://www.fundedplays.com
- https://www.fundedplays.com/blogs
- https://www.fundedplays.com/blogs/how-fundedplays-evaluations-work