

What no vig odds mean and why they matter
Plain definition
No vig odds are market prices adjusted to remove the bookmaker margin so the implied probabilities add up to 100%, creating a normalized set of fair probabilities that can be compared across books and models; this normalization is useful for model calibration and value spotting and is normally performed by converting odds to implied probabilities and scaling to the market percentage Pinnacle margin guide.
Try the steps on a real challenge
Read on for clear, repeatable steps and a worked spreadsheet example that you can copy to your own analysis.
When readers should care
Practitioners care about no vig odds when they want to compare a model to market prices, estimate expected value opportunities, or backtest strategies without the distortion of operator margin; treating prices as if they were ‘‘fair’’ helps separate your model edge from the bookmaker's built-in take Smarkets overround explainer and is relevant to practitioners visiting Funded Plays.
Common uses include calibrating probability models, ranking different operators by implied price, and creating input probabilities for pooled or parlay pricing, all while remembering that normalized probabilities do not guarantee outcomes or profits (see how Funded Plays evaluations work).

How sportsbooks build margin and what overround is
How margin appears in odds
Bookmakers embed a margin by shading prices so the sum of implied probabilities exceeds 100 percent; you compute implied probability from decimal odds as 1 divided by the decimal price, and the excess over 100 percent is the market margin or overround Pinnacle margin guide.
Market percentage explained
Market percentage, sometimes called the overround, is simply the sum of those implied probabilities across all outcomes in a market; it is the denominator you use when you normalize probabilities back to a 100 percent basis, and checking that figure is the first practical step when you want to remove bookmaker margin Smarkets overround explainer.
For analysts, the market percentage tells you how much cushion the operator built into prices and helps you spot where different books offer materially different available probabilities for the same event.
How to calculate no vig odds: proportional scaling step by step
Convert odds to implied probabilities
Step 1, convert each decimal price Oi to an implied probability by computing 1 divided by Oi; keep several decimal places to avoid rounding error in later steps.
Normalize by market percentage
Step 2, compute the market percentage as the sum of those implied probabilities; then divide each individual implied probability by that market percentage to yield the de-vig probability for each outcome, following proportional scaling as the standard practical method Pinnacle margin guide.
Convert back to fair odds
Step 3, convert each de-vig probability back to a decimal fair price by computing 1 divided by the de-vig probability, and check that the normalized probabilities sum to 100 percent as a sanity check Football-Data notes on odds and overround.
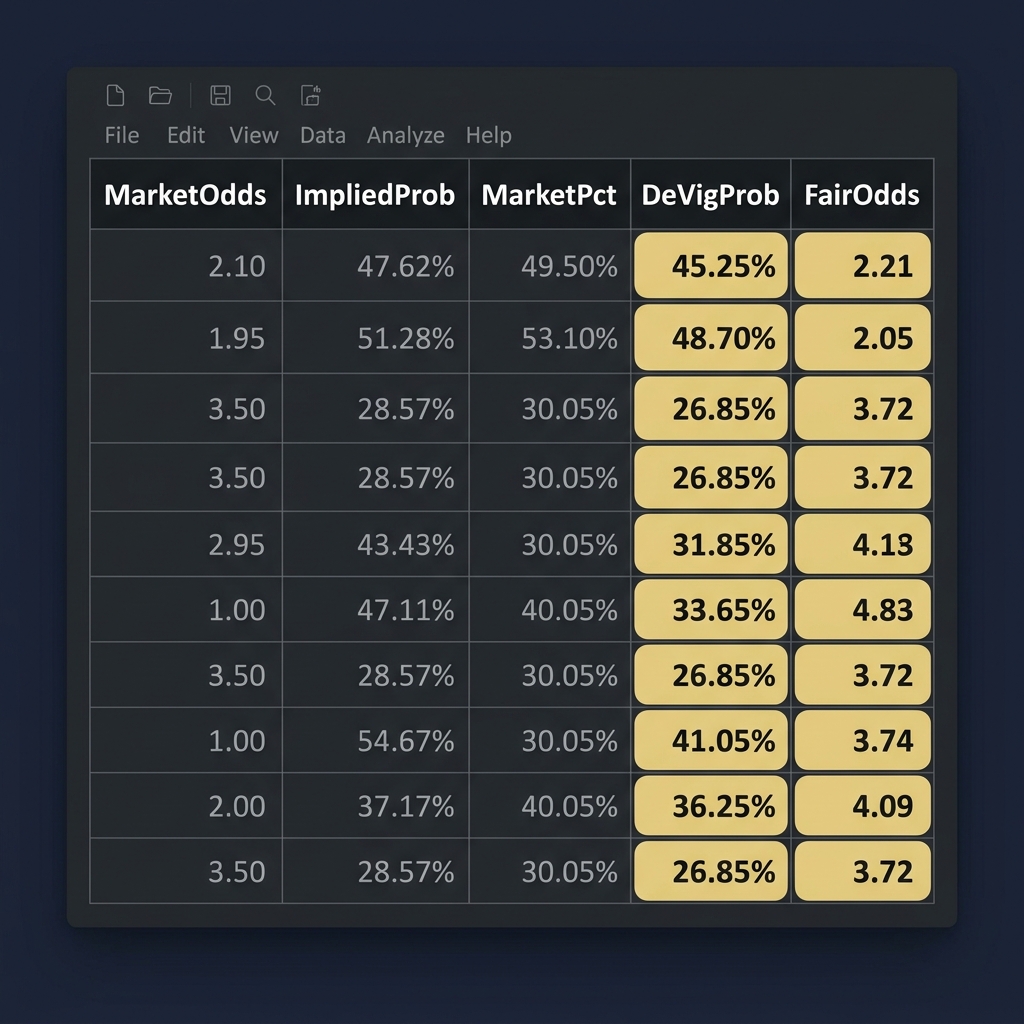
Practical tips: carry at least four to six decimal places in intermediate calculations, label columns in your spreadsheet clearly, and log the original market prices alongside the normalized outputs for auditability.
quick calculator checklist for de-vigging a market
Use consistent decimal precision
Worked example: de-vig a single market, step by step
Illustrative numbers without claiming real market data
Start with a small three-way market of decimal odds and follow the three step proportional approach; first compute 1 divided by each price to get implied probabilities and sum them to get the market percentage, then divide each implied probability by that percentage and convert the results back to decimals to get no vig odds no-vig calculator.
Spreadsheet formulas and sanity checks
In a spreadsheet use formulas such as =1/A2 for implied probability, =SUM(B2:B4) for market percentage, =B2/B5 for normalized probability, and =1/C2 to convert normalized probability back to fair odds; always include a final =SUM(C2:C4) to confirm that normalized probabilities sum to 1.00 or 100 percent.
Label your columns MarketOdds, ImpliedProb, MarketPct, DeVigProb, FairOdds and keep the original prices beside the derived values so you can easily audit the transformation when reviewing backtests or reports.

De-vigging parlays and multi leg bets: workflow and cautions
De-vig each leg first
The common workflow for a multi-leg bet is to de-vig each leg independently using proportional scaling, then multiply the resulting de-vig probabilities for each leg to get a parlay probability under an independence assumption, which is a practical and widely used method among analysts Pinnacle margin guide.
Multiply leg probabilities under independence
Once you have de-vig probabilities p1, p2, p3 for the legs, compute parlay probability as p1 times p2 times p3 and convert to a parlay fair price by taking 1 divided by that product; this approach is straightforward but rests on the independence assumption and will misprice the leg if the events are correlated Smarkets overround explainer.

Dealing with correlated legs
If legs are correlated, such as same-game outcomes or conditional events, you need to model the conditional probability or use joint distributions rather than naive multiplication; ignoring correlation can materially understate or overstate fair parlay prices.
In structured evaluation programs and challenge environments, practitioners often document correlation assumptions and either avoid correlated multi-leg constructions or adjust probabilities using historical conditional frequencies.
When proportional de-vig is not enough: correlated legs and limits
Recognizing correlated markets
Common correlation sources include same-game lines, where a game-level outcome affects multiple props, and lines tied to the same underlying team or player, both of which invalidate simple independence assumptions in parlay pricing Pinnacle margin guide.
Practical limits of proportional normalization
Proportional scaling is a normalization convenience and can misrepresent joint distributions; when you suspect correlation, either compute conditional probabilities from data, build a simple joint model, or avoid using de-vigged single-leg probabilities as if they were independent.
As a rule, treat proportional de-vig as a first filter rather than the final answer for complex combinations.
Alternative de-vig frameworks: the Shin model and information asymmetry
Why alternative models exist
Economists and statisticians have developed alternative normalization frameworks because proportional scaling assumes the market contains no information asymmetry or strategic trading; models such as Shin introduce parameters that aim to account for possible insider trading or information advantages among market participants Shin model paper.
Convert decimal odds to implied probabilities, sum them to find the market percentage, divide each implied probability by that market percentage to normalize, and convert the normalized probabilities back to decimal odds; this proportional scaling removes the bookmaker margin and yields no vig odds.
Brief overview of the Shin approach
The Shin model modifies the normalization by estimating the fraction of stakes placed by informed traders and adjusting implied probabilities to reflect that asymmetry, which can produce materially different fair probabilities than simple proportional scaling and is primarily used in research or when insider effects are suspected Shin model paper.
Practitioners should consider Shin or related approaches when markets show persistent price patterns inconsistent with publicly available information or when regulatory or academic analysis suggests asymmetric information is present.
Margin versus hold: what operators report and why it matters
Ex ante margin or overround
Margin or overround is an ex ante construct built into prices to secure the operator a mathematical edge; it is the difference between the sum of implied probabilities and 100 percent and is what you remove when you compute no vig odds Pinnacle margin guide.
Ex post hold or realized win percentage
Hold, as reported in industry surveys, is an ex post revenue metric that reflects realized outcomes and the mix of bets and is not the same as the baked-in margin; industry reports can show hold well above or below the theoretical margin depending on outcomes and bettor behavior AGA state of the states report.
Do not conflate an operator's reported hold with the overround in a specific market; hold summarizes business-level performance over time while margin is a pricing feature of a particular market snapshot.
Practical workflows and checklists for de-vigging markets
Quick checklist
Capture market odds, standardize formats to decimal, compute implied probabilities, sum to market percentage, divide to normalize, convert back to fair odds, and log both original and normalized values for auditability; automate these steps where possible and include unit tests on your scripts to catch errors Pinnacle margin guide. See more in our blog.
Automation tips
Automate with a spreadsheet or simple script, keep rounding rules explicit, and maintain a change log of input price feeds; compare your tool output with operator calculators as a validation step and investigate discrepancies. Useful operator calculators include offerings such as No-Vig Fair Odds Calculator and published calculators like OddsJam's no-vig tool.
Store both raw market inputs and normalized outputs so retrospective analysis or challenge-level audits can reconstruct how a particular fair price was computed.
Common mistakes and pitfalls when de-vigging odds
Arithmetic errors and rounding
Frequent errors include forgetting to convert odds formats, carrying insufficient decimal precision, and failing to verify that normalized probabilities sum to 100 percent; small rounding mistakes can change perceived edges and should be caught with unit tests or spreadsheet sanity checks Football-Data notes on odds and overround.
Misapplying independence
Another common mistake is applying leg-level independence when legs are clearly correlated; this will misprice parlays and can give a false sense of expected value if not corrected by conditional modeling or historical joint frequency analysis Pinnacle margin guide.
Good practice is to standardize data formats, include tests for sum-to-one, and keep documentation on how correlation assumptions were handled in any derived prices.
Operator tools, calculators and where to find reliable implementations
What reputable operator tools show
Many operators provide margin and implied probability calculators that perform the core conversion and report market percentage to reduce arithmetic error; these tools are useful time savers and a practical cross-check on your own calculations Pinnacle margin guide.
How to use calculators safely
Validate any external tool by comparing its output to a manual calculation for several markets, test edge cases where odds are extreme, and confirm the tool's rounding conventions before using results in automated processes. Compare outputs with published calculators such as OddsJam's no-vig tool as a cross-check.
Remember tools are aids; keep a reproducible local calculation so you can audit or adapt the method as your workflow changes.
How traders and handicappers can apply no vig odds to strategy and bankroll decisions
Using fair probabilities in expected value calculations
Use de-vigged probabilities to compute expected value by comparing your model probability to the market's fair probability; when your model probability exceeds the de-vigged market probability the bet shows positive expected value under that comparison, keeping in mind that edge estimates are statistical and not guarantees.
Backtesting with normalized prices
Backtest strategies using normalized prices so that bookmaker margin does not bias outcomes; this gives a clearer view of whether a strategy is winning on skill rather than benefiting from pricing inefficiencies introduced by margin.
Apply sensible staking rules and risk limits based on derived expected value and volatility rather than assuming that de-vigged probabilities guarantee profitable results.
Regulatory and industry context: how academics and the industry treat de-vigging
Academic foundations
Academic literature investigates alternative normalizations such as the Shin model to study effects of insider information and strategic trading, and scholars use these frameworks to test market efficiency and information asymmetry in state contingent claims Shin model paper.
Industry reporting differences
Industry reports focus on realized metrics such as hold and revenue and do not replace market-level margin analysis; consult operator help pages and academic references when you need deeper technical detail or when markets look inconsistent with public information AGA state of the states report.
Conclusion: when to use no vig odds and a short checklist
Key takeaways
Proportional scaling is the standard practical method to remove bookmaker margin and normalize implied probabilities so they sum to 100 percent; it is reliable for many workflows but has limits when correlation or information asymmetry is present Pinnacle margin guide.
A simple checklist to follow
Final checklist: standardize odds format, compute implied probabilities, sum to market percentage, normalize by dividing, convert back to fair odds, validate with tools or manual checks before using results in models or staking plans.
No vig odds are market prices adjusted to remove the bookmaker margin so implied probabilities sum to 100 percent; they are a normalization for comparison, not a prediction guarantee.
You can de‑vig each leg and multiply de‑vig probabilities to price a parlay under independence, but correlated legs require conditional modeling or joint probability adjustments.
Consider Shin if you suspect information asymmetry or insider effects in a market, or when proportional scaling consistently produces counterintuitive results.
References
- https://www.pinnacle.com/en/betting-articles/educational/what-is-margin-and-how-do-you-calculate-it/
- https://help.smarkets.com/hc/en-gb/articles/115001461249-What-is-overround-and-market-percentage
- https://www.football-data.co.uk/notes/
- https://www.jstor.org/stable/2348413
- https://www.americangaming.org/resources/state-of-the-states-2025/
- https://www.fundedplays.com/challenges
- https://unabated.com/betting-calculators/no-vig-fair-odds-calculator
- https://oddsjam.com/betting-calculators/no-vig-fair-odds
- https://www.therundown.io/betting-calculators/no-vig-calculator
- https://www.fundedplays.com
- https://www.fundedplays.com/blogs
- https://www.fundedplays.com/blogs/how-fundedplays-evaluations-work