
Quick answer: what are no vig odds?
One-sentence definition: no vig odds
No vig odds are the market prices you get after removing the bookmaker margin so the implied probabilities sum to exactly one, giving a simple fair-price benchmark that helps you compare offers across books while not guaranteeing profit.
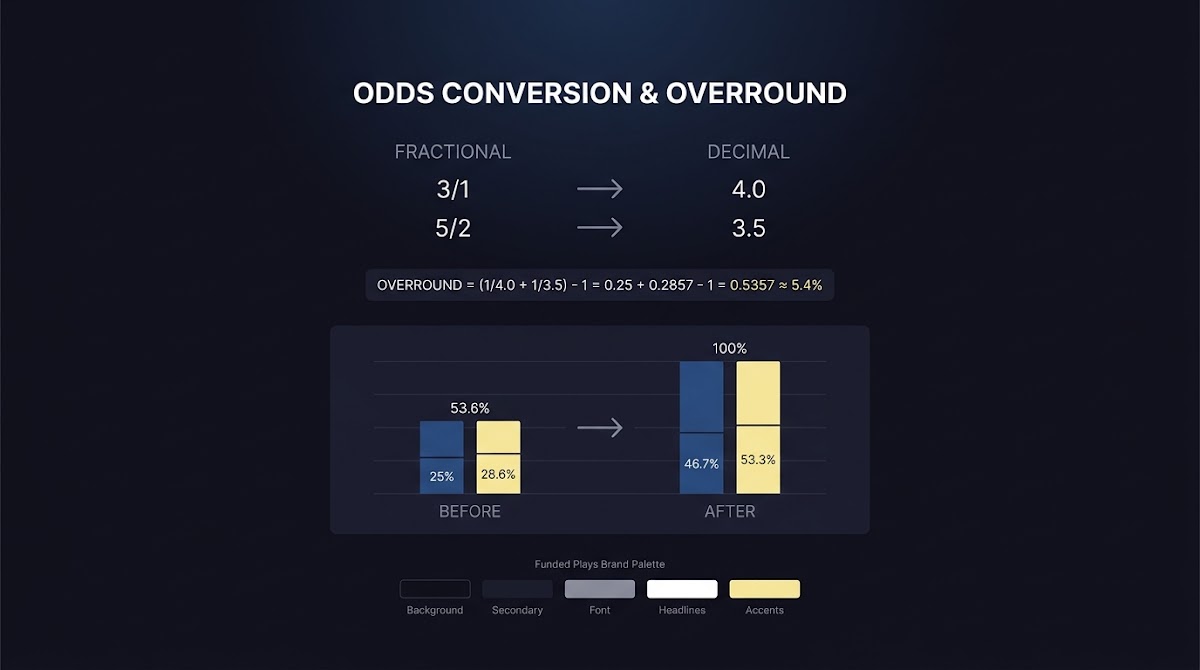
Bookmakers add a built-in edge called vigorish or the vig to generate revenue, which makes quoted odds imply probabilities that sum to more than 100 percent; using a normalization removes that overround and reveals the relative fair probabilities behind the market Smarkets explanation of overround.
Validate the math with a simple spreadsheet
Try the worked examples below to see the arithmetic step by step and then copy the spreadsheet cells into your own calculator to validate results.
Why bookmakers add a margin and how overround works
Operators include a margin, often called vigorish or the vig, as part of quoted prices so the book expects to earn revenue regardless of event outcomes when action is reasonably balanced; that margin is a core part of bookmaker business models and how they manage risk and profitability Investopedia vigorish definition.
Mathematically the margin shows up because implied probabilities derived from decimal odds add up to more than 100 percent; the standard computation for the market overround is the sum of the reciprocals of decimal odds minus one, which gives a straightforward measure of the built-in edge Pinnacle on betting margin.
Understanding hold and margin matters when you compare offers because hold expresses the operator side of expected revenue, and market overround is the numerical form of that hold; this is why removing vig is a useful benchmarking step even though it does not predict actual event results AGA report on industry hold and revenue.
Definition and math: what no vig odds are and the normalization idea
Step one in any no vig conversion is converting each market odd into its implied probability using the decimal formula implied probability = 1 / decimal_odds; this turns prices into a probability mass you can manipulate numerically Smarkets explanation of overround.
No vig odds are market prices recalculated after removing the bookmaker margin so probabilities sum to one, providing a fair-price benchmark for comparing odds.
The next step is to compute the overround by summing those implied probabilities and then normalize each probability by dividing by that sum so the set adds to exactly 1; that normalization is the same mathematical operation used to convert any probability mass into a valid distribution StatLect on normalization of probabilities.
After normalization you can convert each fair probability back into odds in your preferred display format and use those no vig odds as the benchmark against which to compare quoted market prices Wikipedia overround overview.

Odds formats and converting between decimal, fractional and American
Decimal odds are the simplest format for calculations because implied probability is 1 / decimal_odds; convert American or fractional odds to decimal first and then compute implied probability to avoid mistakes Smarkets guidance on formats.
Quick conversion rules: to convert American to decimal, if American is positive use decimal = 1 + (american / 100), if negative use decimal = 1 + (100 / abs(american)); fractional odds convert to decimal with decimal = 1 + (numerator / denominator). Once in decimal you can compute and normalize probabilities, then convert the result back to American or fractional for display.
Many people run the normalization in decimal and only convert at the end because it reduces rounding complications and keeps spreadsheet formulas simple, which is why spreadsheet templates and calculators commonly operate in decimal internally Wikipedia overround overview.
Step-by-step workflow: remove the vig in four actions
Action 1, convert odds to implied probabilities: for every quoted decimal odd use implied probability = 1 / decimal_odds in your sheet cell or calculator; list these in a column labeled implied_prob.
Action 2, compute the overround: sum the implied_prob column to get the market total that will normally exceed 1, and note the overround as sum_implied - 1 to see the margin percentage Pinnacle on betting margin.
Action 3, normalize probabilities: divide each implied probability by the sum_implied value to produce normalized_probabilities that add to 1; these normalized values are the no vig probabilities and are the core of a fair-price benchmark StatLect on normalization.
Action 4, convert back to odds: to present no vig odds in decimal form compute decimal_no_vig = 1 / normalized_probability, or convert to American or fractional using the conversion rules noted above; the normalization keeps relative ordering but rescales probabilities to a consistent total so you can compare across books or against your model output Smarkets explanation of overround.

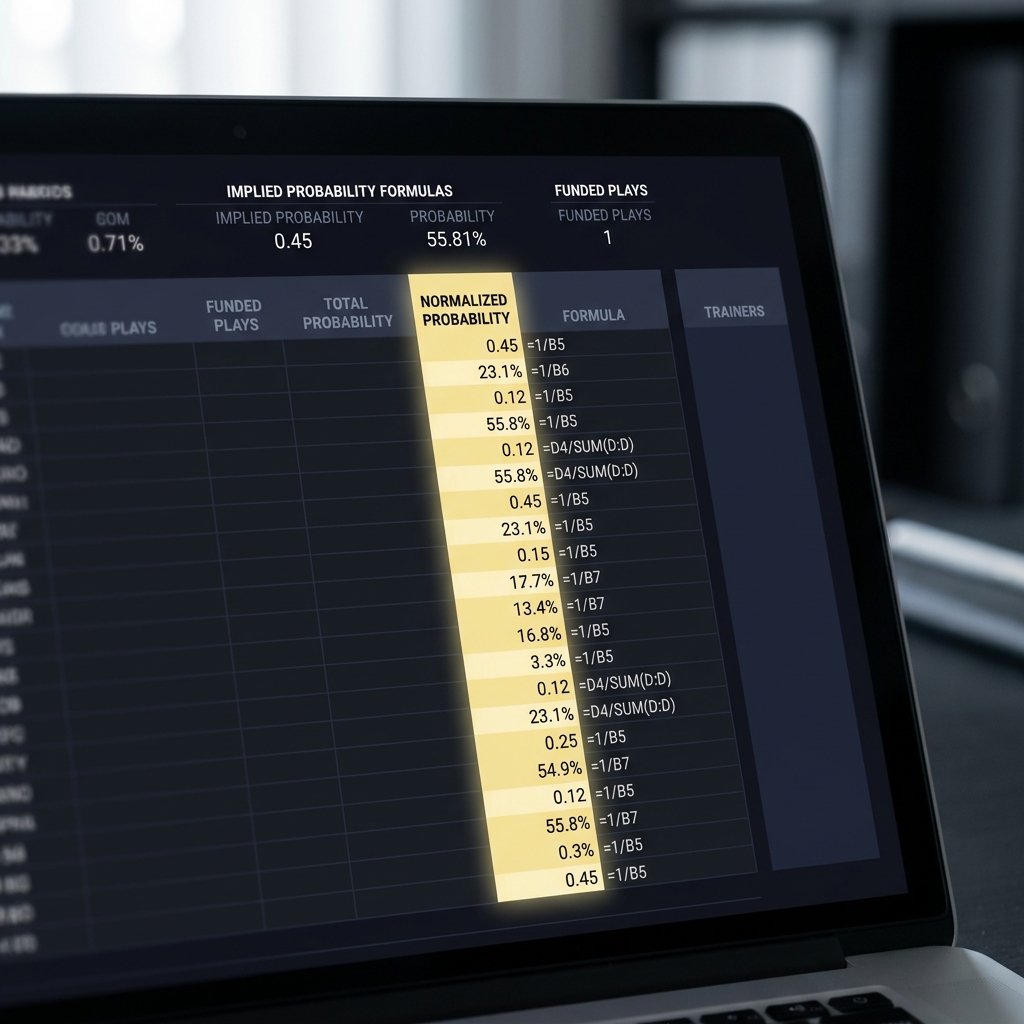
For spreadsheet implementation, common cell formulas look like this: if A2 holds decimal odds then B2 = 1 / A2 for implied probability, Bn for all rows then C1 = SUM(B2:Bn) for the overround, D2 = B2 / C1 for normalized probability, and E2 = 1 / D2 for the no vig decimal odd. Those short formulas are plug and play in Excel or Google Sheets Smarkets overround guide. See related templates on the Funded Plays blog Funded Plays blog.
Worked example: two-outcome market (moneyline) with numbers
Start with a simple moneyline where team A is 1.80 and team B is 2.10 in decimal odds; their implied probabilities are 1 / 1.80 = 0.5556 and 1 / 2.10 = 0.4762, which sum to 1.0318 and indicate an overround of 0.0318 or about 3.18 percent Smarkets overround explanation.
Normalize each probability by dividing by the total 1.0318: for team A normalized = 0.5556 / 1.0318 = 0.5386, for team B normalized = 0.4762 / 1.0318 = 0.4614; these normalized values sum to 1 and represent the fair probabilities after removing the vig StatLect on normalization.
Convert back to decimal odds: team A no vig decimal = 1 / 0.5386 = 1.856, team B no vig decimal = 1 / 0.4614 = 2.167; comparing these no vig odds to quoted market odds shows where each side is relatively over or under priced and gives a clearer benchmark for value checking Wikipedia overround overview.
Multi-way markets and normalization nuances
Numerically the same normalization applies in three-way or multi-way markets: convert each decimal odd to implied probability, sum them, divide each by the sum, and reconvert, but the estimate can be biased if margins are not applied uniformly across outcomes Pinnacle on margin and market structure.
validate multi-way normalization with a small set of checks
check that normalized probs sum to 1
Line shading is a practical issue in multi-way markets where a bookmaker may apply a larger margin to a particular outcome for risk management or liability reasons, and that non-uniform shading will bias no vig estimates if you assume the margin is evenly distributed across outcomes Wikipedia overround overview.
Another nuance is correlation: when outcomes are not independent, simple normalization treats them as if they are separate events and can misrepresent combined probabilities in markets with structural correlations, so treat no vig numbers as a structural benchmark rather than a perfect model of event likelihoods Pinnacle on market mechanics.
When to use no-vig odds: decision criteria for bettors
Use no vig odds when you need a consistent baseline to compare prices between bookmakers or to test whether an offered price differs materially from the market-implied fair price; it is a practical benchmarking tool rather than a prediction engine Investopedia vigorish definition. More context at Funded Plays.
If you run your own probability model, convert its outputs into the same format as the no vig probabilities and compare the two: differences suggest potential value but remember the conversion itself only removes the operator margin and does not correct for model error or market inefficiency AGA industry context on hold.
When markets are thin, heavily hedged, or show signs of line shading, rely less on normalized benchmarks and more on liquidity-aware judgement, because structural issues in pricing and low market efficiency can make the no vig comparison misleading for actionable staking decisions Pinnacle on market efficiency.
Limitations and common biases when using no-vig odds
No vig normalization assumes the bookmaker margin is a single, spreadable quantity across outcomes, but in practice margins can be strategic and uneven which creates bias in fair-price estimates derived from simple normalization Pinnacle on margin nuances.
Market efficiency and liquidity impact how useful a normalized benchmark is: in deep liquid markets the no vig adjustment is a cleaner diagnostic, while in illiquid markets the normalized numbers can be noisy and react strongly to individual bets or liability limits AGA report on industry liquidity.
Finally, remember that no vig odds do not ensure a betting edge: they are a structural tool to help identify where prices differ from a fair baseline, but profits depend on accurate probability models, disciplined staking, and real outcomes Investopedia on vigorish and outcomes.
Common calculation mistakes and how to avoid them
A frequent error is mixing odds formats without converting to decimal first; always convert American and fractional odds to decimal before computing implied probabilities to avoid incorrect numerators in your formulas Smarkets on odds formats.
Another common mistake is rounding too early: keep intermediate probabilities and the overround in full precision until the normalization and final reconversion steps, then round only for display to prevent cumulative rounding error from skewing totals StatLect on normalization precision.
Always validate your sheet by checking that normalized probabilities sum to exactly 1 within numeric tolerance and that converting back to decimal returns logical values; these simple checks catch most spreadsheet mistakes quickly Smarkets validation tips.
Practical tools: spreadsheets, calculators and what to look for
A minimal spreadsheet layout has columns: input decimal odds, implied probability formula (1 / odds), a single overround cell that sums the implied probabilities, normalized probability column (implied / sum), and reconverted no vig odds column (1 / normalized). Those five columns are enough for repeatable, auditable work Smarkets on practical implementation. If you use online calculators (try TheRundown, Optimal-Bet, or Overround Calculator) double check their formulas by running a known worked example and comparing the outputs to your spreadsheet; calculators can be convenient but they vary in how they treat multi-way markets and rounding, so validation is essential StatLect on validation.

For routine checks build a tiny audit section in your sheet that recomputes the overround and prints a pass fail if the normalized probabilities are within a small tolerance of 1, and keep a copy of a worked example in the same file so you can confirm the tool remains correct when you update formulas.
How bookmakers set margins and what 'hold' tells you
Bookmakers set margins to balance expected liabilities and revenue goals; hold is the metric that expresses the operator expected margin and is closely related to the overround computed from market odds Investopedia on hold and vig.
Interpreting hold helps you understand whether a market is relatively generous or tight compared to other offers, but remember hold is an operator metric and does not translate directly to event likelihoods; use it as context for no vig comparisons rather than an absolute judge of a good price AGA on operator pricing.
A quick reader checklist: compute, validate, and interpret
Compute implied probabilities from decimal odds and sum them to get the overround.
Normalize each probability by dividing by the overround total and confirm the normalized probabilities sum to 1 within tolerance.
Reconvert normalized probabilities to your preferred odds format and cross-check for signs of line shading or market inefficiency before acting on any perceived value Pinnacle checklist.
Conclusion: how to use no-vig odds responsibly
No vig odds give you a transparent, repeatable benchmark by stripping the bookmaker margin and normalizing implied probabilities so they sum to one; use them to compare prices and to calibrate models rather than as a guarantee of profit Smarkets on overround.
Next steps are practical: build the small spreadsheet described above, validate it with the worked two-way example in this article, and combine no vig benchmarks with your probability model and disciplined staking to make reasoned decisions. See how Funded Plays evaluates in our guide how Funded Plays evaluations work.
Removing the vig means converting market odds to implied probabilities, summing them to find the overround, dividing each probability by that total so the set sums to one, and then converting back to odds to get fair prices.
No, no vig odds are a structural benchmark that remove the bookmaker margin; they help identify relative value but do not guarantee profits because outcomes depend on real events and model accuracy.
Yes, the normalization works numerically for multi-way markets but watch for non-uniform margins and correlations that can bias the estimates.
References
- https://help.smarkets.com/hc/en-gb/articles/214201329-Understanding-overround
- https://www.investopedia.com/terms/v/vigorish.asp
- https://www.pinnacle.com/en/betting-articles/educational/betting-margin-explained/b3xjzkg4jem2jw4n
- https://www.americangaming.org/resources/state-of-the-states/
- https://www.statlect.com/fundamentals-of-probability/normalization-of-probabilities
- https://en.wikipedia.org/wiki/Overround
- https://www.fundedplays.com/challenges
- https://therundown.io/betting-calculators/no-vig-calculator
- https://www.optimal-bet.com/calculators/no-vig-calculator
- https://overroundcalculator.com/
- https://www.fundedplays.com
- https://www.fundedplays.com/blogs
- https://www.fundedplays.com/blogs/how-fundedplays-evaluations-work