
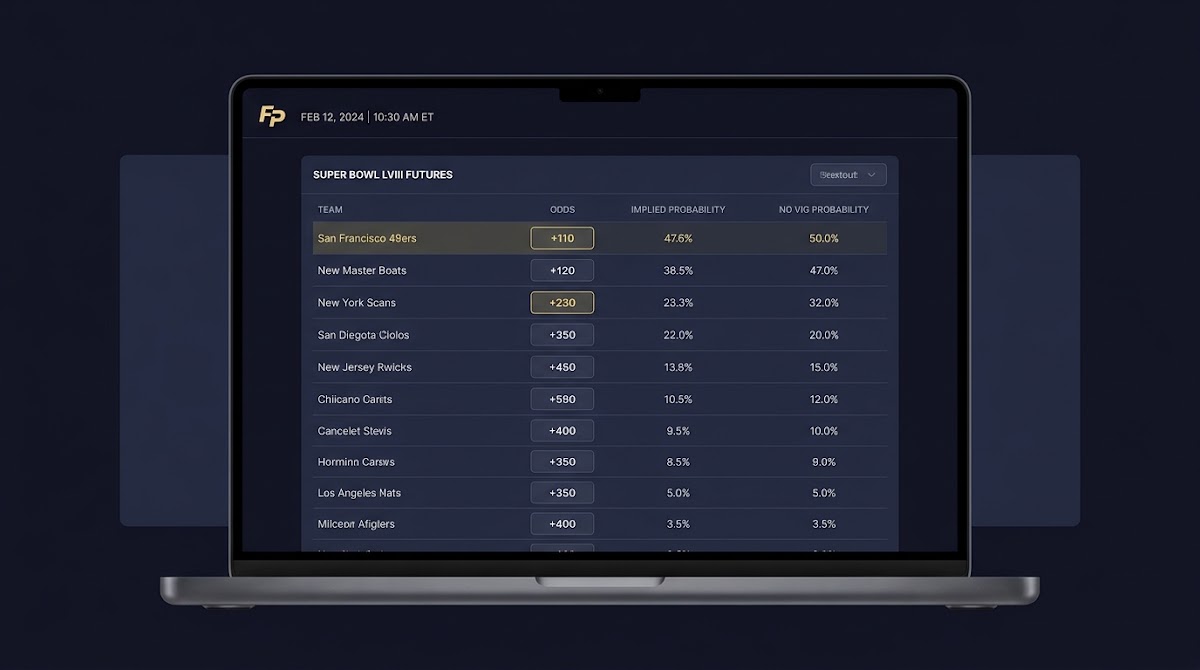
Quick snapshot: nfl teams odds to win super bowl - how to read today's board
Major U.S. sportsbooks and reputable odds aggregators post Super Bowl futures for all 32 NFL teams year-round; when you look at a live board you are seeing current market prices that can change intraday, so always note the source and time of capture. See ESPN's odds coverage ESPN's odds coverage.
To make any board useful at a glance, convert American moneyline quotes into implied probability so you can compare teams side by side; theLines maintains a live Super Bowl futures page that demonstrates how boards are presented in practice TheLines Super Bowl odds.
Run a timestamped capture and convert odds with the steps above
Check a live odds board and record the time and source before converting any prices to percentages.
For a fast worked example: if a team is listed at -150 on a Super Bowl futures board, use the negative moneyline formula to get its market-implied chance; if another team is listed at +300, use the positive moneyline formula. The precise formulas are shown in the conversion section below and you can reproduce them in a spreadsheet.
Remember that different books can show different prices at the same moment; using an aggregator or noting multiple sources helps you see variance and avoid single-book bias.
Where sportsbooks post current Super Bowl futures and why prices differ
Live team-by-team Super Bowl futures appear on major sportsbook pages and on dedicated aggregators; for a practical single-location check many users start with an aggregator or sportsbook futures page such as DraftKings' futures listings to capture the board quickly DraftKings futures odds. You can also check DraftKings' Super Bowl futures page DraftKings futures (super-bowl).
Aggregators combine prices from multiple books and present a consensus view, while individual sportsbooks may shade their quotes for liability or respond to early action differently; TheLines is an example of an aggregator-style page that shows the practical differences you might observe across feeds TheLines Super Bowl odds.
Because books set prices independently and respond to their own client flows, you should always capture the source line and timestamp when saving a board; VegasInsider and other public boards are commonly used references for this purpose VegasInsider Super Bowl odds.
How to convert moneyline odds into implied probability for each NFL team
Formula for negative moneyline odds
Use the standard negative moneyline formula to convert a favorite's odds into implied probability: implied probability = -odds / (-odds + 100). This formula and its explanation are a standard reference for converting American moneyline prices into market probabilities Investopedia implied probability.

Formula for positive moneyline odds
For underdog odds that are positive, use: implied probability = 100 / (odds + 100). This mirrors the same Investopedia explanation and gives you an apples-to-apples percentage for a price like +300 or +1200 Investopedia implied probability.
Worked example: converting -150 and +300
Example 1, favorite: odds -150 converts as follows: implied probability = 150 / (150 + 100) = 150 / 250 = 0.60, or 60 percent. You can enter this formula directly into a spreadsheet cell to replicate the result quickly.
Example 2, underdog: odds +300 converts as follows: implied probability = 100 / (300 + 100) = 100 / 400 = 0.25, or 25 percent. Treat these as market-implied chances that include the book's margin unless you remove the vigorish later.

After converting each team's moneyline to an implied probability, you will usually see the percentages add to more than 100 percent across all 32 teams because sportsbook prices contain a built-in margin; the next section explains how to adjust for that margin.
Removing the vig: calculating no-margin probabilities and fair comparisons
Sportsbook prices embed a margin, commonly called vigorish or vig, so the sum of implied probabilities across all outcomes typically exceeds 100 percent; understanding this margin is essential before comparing teams fairly Investopedia vigorish.
A simple, transparent method to remove the vig is proportional rescaling: compute each team's implied probability, sum those percentages, then divide each implied probability by the sum to rescale them so they add to 100 percent; the rescaled values are commonly called no-vig probabilities and serve as a market-adjusted baseline.
This proportional method assumes the market's relative odds between teams are informative and treats the book's margin as a uniform scale factor; it is a practical approximation rather than a precise truth, but it is widely used for quick, reproducible comparisons.
Common things that move NFL futures odds and how fast they change
Futures odds respond to information shocks such as injuries to key players, trades that change a roster's outlook, depth-chart shifts, and any verified lineup news; these events can trigger rapid repricing as books update risk and bettors adjust positions Covers what moves betting lines.
Market action itself also moves futures: concentrated heavy bets on a single outcome can force a sportsbook to reprice to manage liability, and lower-liquidity futures markets will generally move more for a given piece of news than higher-liquidity markets.
Current odds are posted year-round by sportsbooks and aggregators; convert each team's American moneyline to implied probability, rescale to remove the vigorish for fair comparisons, and always record the source and timestamp because prices move intraday.
Because odds can change quickly around major news, capture a pre-event snapshot, note the timestamp, monitor the news feed, then capture the post-event board to see how the market revalued teams; always document timestamps so your analysis shows causality and sequence rather than a coincidental association TheLines Super Bowl odds.
Practical team-by-team snapshot: how to capture, timestamp, and compare current odds
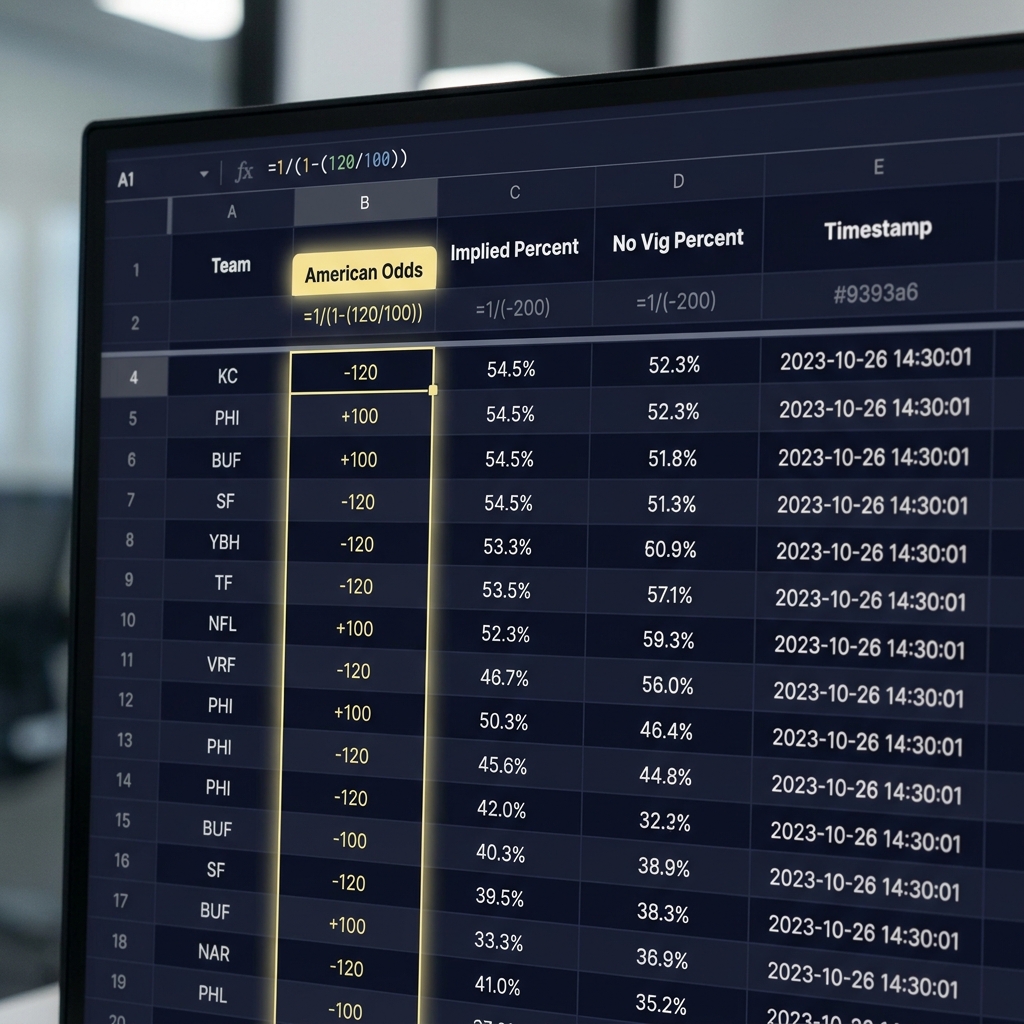
To build a reproducible 32-team snapshot, record these fields for every team: team name, American moneyline odds, source (book or aggregator), timestamp (date and time and timezone), implied probability, and no-vig probability after rescaling; capturing these fields in a spreadsheet preserves provenance and makes later comparisons straightforward.

A practical checklist row looks like this: Team, Odds (American), Source, Timestamp, Implied %, Sum of Implied %, No-Vig %, Notes. Recording the sum of implied probabilities helps you calculate the rescale factor for no-vig conversion and documents how large the market margin was at capture time VegasInsider futures.
Use an aggregator to get a fast consensus, or capture two or three books and include separate columns; showing multiple-book columns helps readers see variance and reduces reliance on a single feed for ranking teams TheLines Super Bowl odds. You can also check VegasInsider for futures listings VegasInsider futures.
Decision framework: how to rank and decide which teams look undervalued
Start by ranking teams by their no-vig implied probabilities; the ones with the largest negative gap between your model's projected probability and the market's no-vig probability are candidates for further investigation because they may be undervalued by the market.
Combine the quantitative gap with qualitative signals such as recent injury reports, known coaching changes, or depth-chart context; if your model consistently rates a team higher than the market and you cannot find a credible negative news item, that situation warrants deeper analysis rather than immediate action. See how Funded Plays evaluates teams how Funded Plays evaluations work.
compute implied and no-vig probabilities for a 32-team board
Copy formulas down the column
Use the tool workflow above in a spreadsheet: convert odds to implied using the moneyline formulas, sum the implied values, compute a rescale factor as Sum/100, then divide each implied probability by the rescale factor to get no-vig probabilities; document the source and timestamp for transparency and reproducibility.
Typical mistakes when interpreting Super Bowl futures
One common mistake is overreacting to short-term moves without checking for confirming information; a significant instant move can reflect market noise or heavy book-specific action rather than a market-wide reassessment Covers what moves betting lines.
Another frequent error is comparing implied probabilities without removing the vig; raw implied percentages often overstate the market's total probability and will mislead if you compare teams without a no-vig adjustment Investopedia vigorish.
Finally, relying on a single sportsbook's price can produce single-book bias because different books may have different liability profiles and client mix; capture multiple sources or use an aggregator to reduce that risk.
Examples and scenarios: reading odds before and after key events
Scenario A, star player injury announced: capture the pre-event board with timestamps and convert all teams to implied and no-vig probabilities; after the injury is announced, capture the post-event board and compute the deltas. The size of the delta indicates how much the market revalued the team's Super Bowl chances and whether that change appears to reflect new information or transient liquidity effects TheLines Super Bowl odds.
Scenario B, blockbuster trade news: similar workflow applies. Note that market liquidity and the timing of the announcement can affect magnitude - low-liquidity futures markets will tend to show larger percentage moves for the same information content than high-liquidity markets.
In both scenarios, document timestamps and sources for pre- and post-event captures so readers or auditors can reproduce your sequence and verify the cause-effect relationship between news and price movement VegasInsider futures.
How bettors and analysts use implied probabilities in model building
Practitioners use implied probabilities as market inputs or benchmarks; comparing a model's predicted probability with the market's no-vig probability highlights discrepancies that might indicate model edge or missing information in the model.
A short calibration routine: collect a history of market no-vig probabilities and your model's predicted probabilities for the same dates, compute the average error and calibration slope, and investigate systematic gaps; systematic divergence can point to model miscalibration or persistent market inefficiency Investopedia implied probability.
Always treat market probabilities as one input among many; even a repeatable difference does not guarantee future outperformance and requires careful risk management if used to size positions.
How to present odds in articles or dashboards - timestamping and sourcing best practices
Every published odds table should include a visible timestamp and a named source line so readers can reproduce the capture; this is essential because boards move intraday and a static table without provenance is not verifiable TheLines Super Bowl odds.
Consider including either a consensus column or separate columns for two or three major books so readers can see variance; a consensus reduces the influence of a single book's liability-driven price and offers a clearer view of the market range VegasInsider futures.
Short checklist for tracking nfl teams odds to win super bowl over a season
Daily quick check: capture top 5 favorites and any teams with notable week-over-week shifts, record source and timestamp, and flag any trigger events for a deeper re-capture.
Weekly full capture: export a full 32-team board from an aggregator or two books, convert to implied and no-vig probabilities, and save a versioned spreadsheet with the timestamped filename for later trend analysis DraftKings futures odds. See Funded Plays Funded Plays.
Trigger re-captures: rerun a full capture after significant injuries, major trades, or notable market action; keep a versioned log so you can compare how the market evolved between versions.
Responsible participation and what these odds do and do not imply
Odds are market prices that express collective willingness to take positions at given prices; they are not guarantees of outcomes or earnings, and interpreting them responsibly means acknowledging uncertainty and using them as one input in decision-making.
Avoid framing implied probabilities as predictions you can rely on for guaranteed returns; instead, treat them as a market signal that should be combined with model outputs, injury reports, and roster context when forming views.
Wrap-up: where to check live boards and next steps for readers
Recap: convert American moneyline odds to implied probability using the standard formulas, then rescale implied probabilities to remove the vig for fair team comparisons; capture source and timestamp for any published board to preserve reproducibility Investopedia implied probability.
Next steps: build the spreadsheet outlined in the practical snapshot section, run weekly captures from an aggregator or multiple books, and compare your model outputs to market no-vig probabilities to spot persistent gaps worth investigating. See our blog our blog.
Use standard formulas: for negative odds use -odds/(-odds+100); for positive odds use 100/(odds+100). These give implied market probabilities you can compute in a spreadsheet.
Sportsbooks include a margin called vigorish, so the raw implied probabilities typically sum above 100 percent; rescaling produces no-vig probabilities for fair comparison.
Use a reputable odds aggregator or capture two to three major sportsbook boards, and always record the exact source and timestamp for reproducibility.
References
- https://www.espn.com/espn/betting/story/_/id/47809892/2026-super-bowl-lxi-odds-nfl-sports-betting-season-win-totals-playoffs
- https://www.thelines.com/odds/nfl/super-bowl/
- https://sportsbook.draftkings.com/leagues/football/nfl?category=futures
- https://sportsbook.draftkings.com/leagues/football/nfl?category=futures&subcategory=super-bowl
- https://www.vegasinsider.com/nfl/odds/super-bowl/
- https://www.investopedia.com/terms/i/implied-probability.asp
- https://www.fundedplays.com/challenges
- https://www.investopedia.com/terms/v/vigorish.asp
- https://www.covers.com/betting/what-moves-betting-lines
- https://www.vegasinsider.com/nfl/odds/futures/
- https://www.fundedplays.com/blogs/how-fundedplays-evaluations-work
- https://www.fundedplays.com/blogs
- https://www.fundedplays.com