
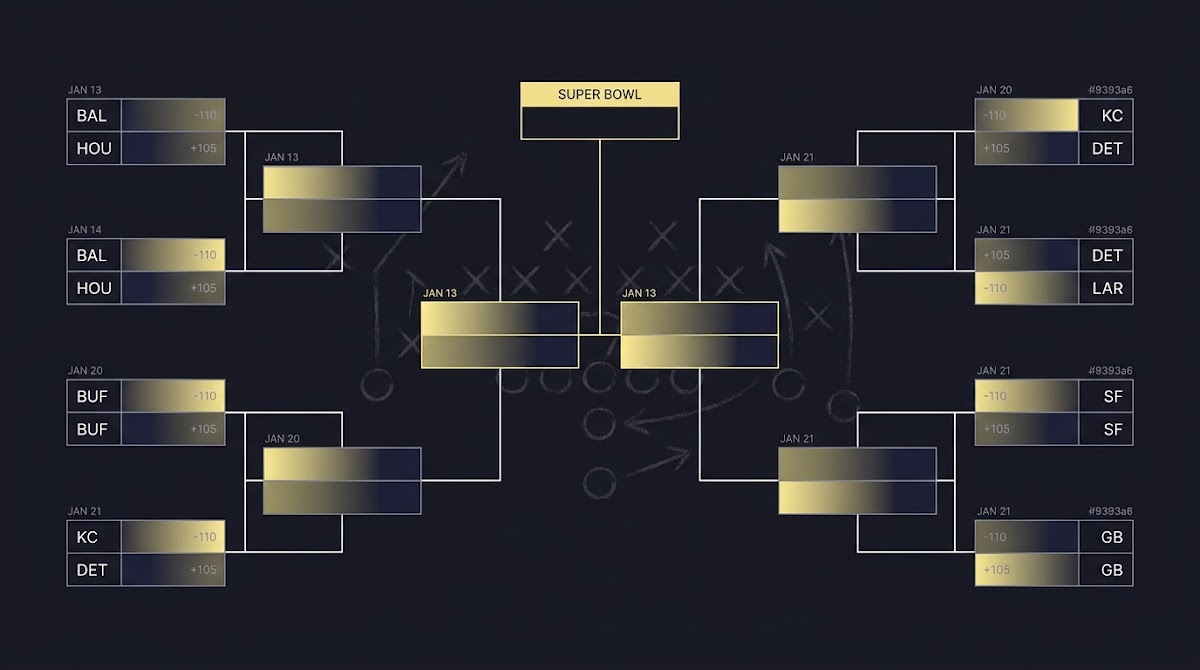
What nfl schedule and lines mean for Super Bowl forecasts
When you ask who is statistically more likely to win the Super Bowl, two inputs dominate the answer: the NFL schedule and lines for remaining games. The nfl schedule and lines together define what games are left, which matchups matter most, and the market view of each game, and any probability model should start by encoding those facts carefully.
Understanding the NFL schedule matters because the modern season has a fixed 17-game regular season that feeds a 14-team playoff bracket, and simulations must enforce that structure so playoff paths are realistic. The league published the current schedule rules and format that modelers should use when mapping remaining matchups into a bracketed simulation NFL schedule announcement.
Sportsbook lines are market prices that imply win probabilities after translating formats into implied probability. Raw odds are useful market priors, but they include a bookmaker margin, so a line is not yet a fair probability until that margin is removed. Converting odds to implied probability is the first step in turning lines into inputs a simulation can use Implied probability guide. For aggregated listings and odds tracking see SportsLine's NFL odds.
Explore FundedPlays challenge-style workflows for skill-based forecasting
Follow this article for a step-by-step framework you can apply to your own models, from de-vigging lines to simulating playoff brackets.
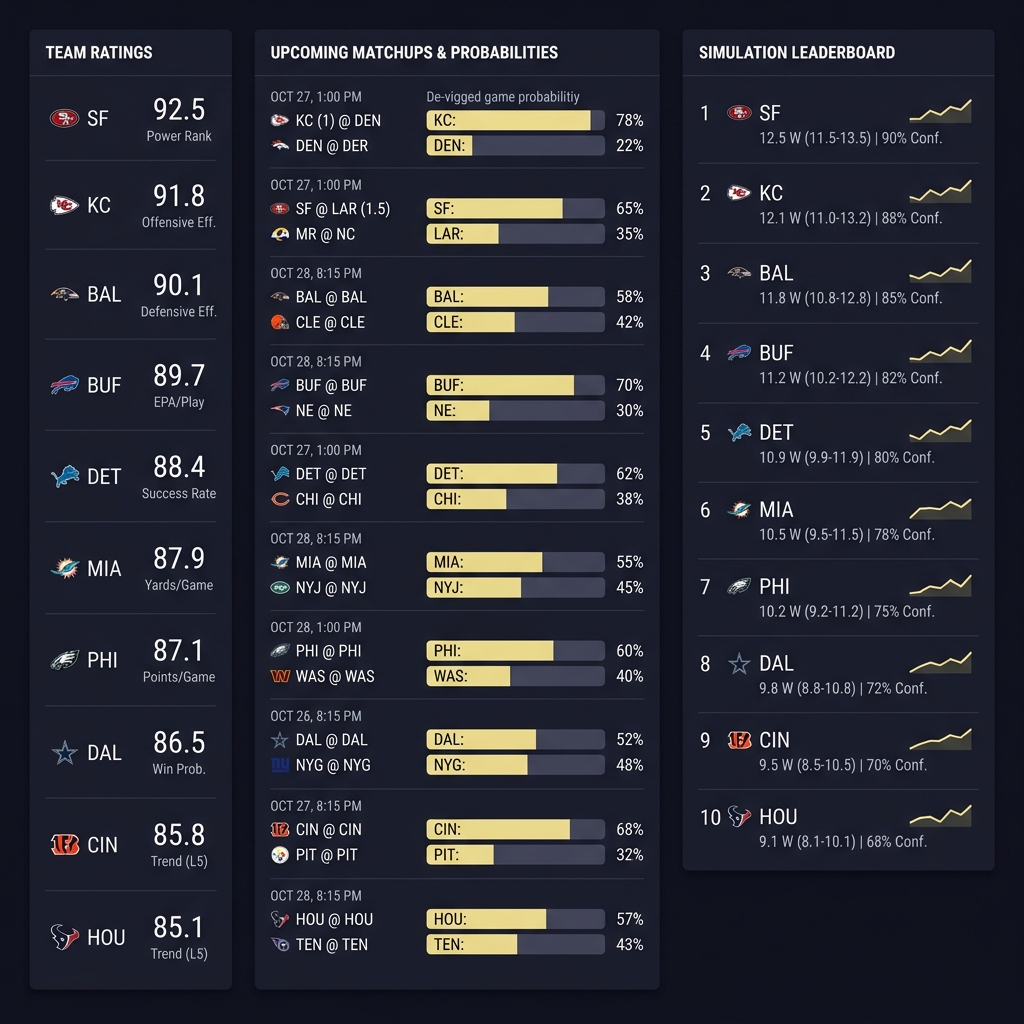
In short, the nfl schedule and lines are complementary: the schedule defines the structural constraints and possible paths to the title, and lines express current market assessments of each game's outcome. A robust super bowl odds model blends both in a transparent way.
How the NFL schedule and playoff format determine possible paths
Modeling the season requires encoding schedule mechanics precisely. The 17-game regular season produces standings that determine a 14-team playoff field, and those seeding rules directly change which opponents a team can face in each playoff round. Treat the schedule release as the authoritative map of which games remain and what matchups can occur NFL schedule announcement.
To translate schedule to simulation logic, follow numbered steps: 1) load remaining regular-season games and note home venues, 2) simulate remaining games to finalize standings, and 3) apply the league's seeding and tie-breaker rules to build the playoff bracket. Each of these steps changes the probability flow because seeding determines home-field and potential opponent chains.
Divisions, conferences, and interconference matchups matter for strength-of-schedule adjustments. Teams locked into easier final slates can see implied championship chances rise even without changing their raw ratings. Include home-field effects in each simulated game so the bracket reflects realistic advantages tied to seeding.

From odds to fair probabilities: converting and de-vigging lines
Odds appear in several formats, but they all convert into implied probability using standard formulas. For decimal odds, the implied probability is 1 divided by the decimal price. For American or fractional formats, convert to decimal first and then to probability. That conversion is the standard way to read market sentiment before adjusting for margin Implied probability guide.
After converting odds to implied probabilities, you will see the total exceed 100 percent because bookmakers include an overround margin. Removing that margin is called de-vigging and it rescales implied probabilities so the pair of outcomes sums to 100 percent. Practical de-vig methods vary, from proportional normalization to more sophisticated approaches that preserve market-implied relative edges De-vigging explained. You can also use no-vig tools such as the Unabated fair odds calculator.
Convert raw odds to implied probabilities, de-vig to remove bookmaker margin, blend those fair probabilities with schedule-adjusted team ratings like FPI or EPA, encode the 17-game season and 14-team playoff rules, and run Monte Carlo simulations to aggregate each team’s championship share.
A simple numeric example helps: convert both sides of a game to implied probabilities, sum them, and proportionally scale each probability so the sum equals 1. That yields fair per-game probabilities you can feed into a Monte Carlo engine without the distortion of overround.
Be mindful that some de-vig choices assume market efficiency while others allow for small systematic biases. Where possible, document which de-vig method you used and why, because that choice directly affects aggregated championship shares later in the workflow.
Strength and efficiency inputs: FPI, EPA and market priors
Schedule-adjusted ratings like ESPN's Football Power Index are designed to convert team performance and opponent context into per-game win probabilities, making them a natural strength input for season simulations. FPI packages opponent adjustments and situational factors so modelers can map a rating to a game probability in a consistent way ESPN FPI methodology.
EPA-based metrics provide an alternative view that focuses on play-level efficiency and expected points added. EPA signals are opponent- and situation-adjusted, which often stabilizes short-term variance and complements ratings that primarily target win probabilities. Many analysts still use EPA foundations when constructing team strength estimates EPA primer.
Markets themselves are informative. Empirical studies show betting lines generally reflect useful information about team strength, which supports using market probabilities as priors or blending inputs rather than ignoring them. Treat market-implied lines as a snapshot of collective market information and let them influence your prior weight in the blend Market efficiency study.
A practical modeling framework using nfl schedule and lines
Start by listing required inputs: the current NFL schedule for remaining games, raw sportsbook lines for those matchups, schedule-adjusted ratings such as FPI or EPA-based team strength numbers, and a simple home-field adjustment. These inputs let you map remaining games into per-game win probabilities and then into simulated bracket outcomes NFL schedule announcement.

A recommended order of operations is: 1) convert raw odds into implied probabilities, 2) de-vig to remove the overround, 3) produce schedule-adjusted team probabilities from ratings, 4) blend market and rating probabilities using chosen weights, and 5) encode seeding rules to run simulations. That sequence keeps preprocessing and modeling separate and auditable.
For the blend step, common choices are weighted averages where market probabilities act as a prior with a tunable weight and rating-derived probabilities pull toward performance-based expectations. Record your blend weight and test sensitivity, because small changes can shift championship shares meaningfully.
Step-by-step simulation workflow and aggregation
With per-game fair probabilities in hand, a Monte Carlo simulation repeatedly plays out the remainder of the regular season, applies seeding rules, and resolves the playoff bracket until a Super Bowl winner emerges. Repeat this process many thousands of times and count how often each team wins to estimate championship share.
simple Monte Carlo engine spec for title aggregation
run multiple seeds for stability
Key steps inside the engine include sampling each remaining game's result according to its blended probability, updating standings, applying tie-breakers and seeding, and simulating playoff rounds with home-field effects applied. Track winners and compute the fraction of simulations each team wins to produce the final probability distribution.
Aggregate results into a ranked table of championship share, and present uncertainty with percentiles or confidence intervals rather than point estimates alone. That helps readers and decision makers see how much variance exists in your estimate.

Handling uncertainty, line moves, and model refreshes
Lines can move rapidly when injuries, rest decisions, or other news break, so refreshing simulations is essential during volatile windows. Rapid updates justify rerunning the engine and documenting what changed between runs to preserve reproducibility De-vigging explained.
Practical refresh cadences vary by situation: daily updates are reasonable during busy late-season weeks or after major injury news, while weekly updates may suffice during stable stretches. When you rerun, archive prior outputs with timestamps and a short note of input changes so readers can track how new information affected the super bowl odds model. That archive and commentary can live in a central blog area where readers review past snapshots our blog.
To reflect increased uncertainty after major line moves, widen ensemble variance or report broader credible intervals. Ensembles that vary blend weights or use alternate de-vig methods are simple ways to express epistemic uncertainty in final probabilities.
Common mistakes and pitfalls to avoid when using nfl schedule and lines
Failing to de-vig is the most common source of bias. If you feed raw implied probabilities into a simulation without removing the bookmaker margin, aggregate probability mass will be inflated and championship shares become unreliable. Always de-vig before simulations Implied probability guide.
Another frequent error is ignoring schedule constraints or home-field effects. Using raw win rates or unadjusted team records without accounting for the remaining schedule can misstate a team’s true path to the title. Encode the league's seeding and home-field rules explicitly in the simulation logic.
Avoid overfitting to short-term EPA noise by smoothing small-sample signals and testing sensitivity. EPA and play-level metrics are valuable, but they also reflect small-sample variance that can mislead if taken as definitive without context EPA primer.
Practical example scenario: midseason simulation walkthrough
Imagine midseason inputs where you have the remaining schedule file, live sportsbook lines for each remaining matchup (see current futures listings on Rotowire), and the latest FPI or EPA ratings. The first task is to convert live odds into implied probabilities, de-vig them, and align them with the remaining schedule entries so each game has a fair probability attached Implied probability guide.
Next, blend those de-vigged probabilities with schedule-adjusted team ratings to moderate market noise. Teams with easier remaining schedules or consistently strong ratings may gain championship share even if market prices move slightly; this happens because schedule structure affects the number and quality of necessary wins to reach the title ESPN FPI methodology.
When you run simulations, expect the leaderboard to show a long tail of teams with small single-digit championship shares and a few teams capturing meaningful fractions. Interpret those shares as probabilistic statements, not guarantees, and document which inputs and dates produced the snapshot.
How to interpret model outputs for decisions and communication
Probability is not certainty. A 20 percent championship share does not mean a team will likely win the Super Bowl in a deterministic sense, only that it wins about one in five simulated seasons under your input assumptions. Frame results with plain-language explanations and avoid overstating confidence Market efficiency study.
Communicate uncertainty by publishing refresh date, blend weights, de-vig method, and which rating sources you used. Readers can then evaluate whether they trust your inputs and compare updates over time. Clear labels and a short assumptions list improve reader literacy.
For decision use, treat simulated championship shares as one input among many. If you use outputs to guide challenge selections or forecasts on a skill-based platform, pair them with disciplined risk management and documented tracking of past performance.
Updating models for late-season dynamics and playoff odds
Late in the season, seeding volatility and rest decisions change the payoff structure and often concentrate information in market lines. As teams clinch byes or rest starters, the expected path to a title can change quickly and require more detailed matchup modeling NFL schedule announcement.
Because news density increases late, it is reasonable to upweight market lines relative to historical ratings when those lines incorporate concentrated information like confirmed injuries or coach statements. Document clearly when you change blend weights so readers understand why late-season probabilities may shift toward market priors.
Track seed-sensitive teams and run targeted sensitivity checks where you vary outcomes of critical late games to see how much bracket paths depend on single-match results. That helps prioritize monitoring effort and clarifies which matchups deserve focused attention.
Responsible communication, disclaimers and model limits
Models do not guarantee earnings. State this plainly in any public output and include a short disclaimer that outcomes depend on future events, model assumptions, and compliance with platform rules. Responsible language aligns with transparent participation goals and avoids misrepresentation.
Provide a concise assumptions list: input date, de-vig method, blend weight, rating sources, and refresh cadence. That single list lets readers replicate or critique your approach and improves trust in probabilistic statements.
Finally, highlight limitations such as small-sample noise in EPA, potential market inefficiencies, and the fact that no model can foresee unforeseeable events. Encourage readers to treat the outputs as decision support rather than deterministic forecasts.
Case study ideas and hypothetical team paths to illustrate concepts
Two useful hypothetical narratives are an easier-remaining-schedule path and an injury-swing scenario. For the schedule path, show conceptually how a middling team can gain championship share when its remaining opponents are weak and home-heavy. For the injury path, illustrate how losing a starter can move lines and thus shift market priors in the de-vigged probabilities ESPN FPI methodology.
Label these clearly as hypothetical scenarios and provide readers with a checklist of data to collect when turning them into concrete examples: current schedule file, live lines, chosen rating source, and documented de-vig method. That prevents accidental presentation of imagined numbers as factual outputs.
When converting any case study into a published table, note the snapshot date and which inputs were active. That allows readers to compare your example to later real-world outcomes and learn from divergences.
Conclusion: how to use nfl schedule and lines to answer who is statistically more likely to win the Super Bowl
To answer who is statistically most likely to win the Super Bowl, follow a disciplined workflow: convert and de-vig betting lines, blend them with schedule-adjusted ratings such as FPI or EPA, encode the 17-game season and 14-team playoff rules, and run Monte Carlo simulations that aggregate championship shares. This sequence preserves market information while grounding forecasts in structural constraints Implied probability guide.
Refresh the model when lines move or new information appears, document assumptions, and communicate uncertainty clearly. By combining market priors with performance-based ratings and respecting schedule mechanics, analysts can produce defensible super bowl odds model outputs that readers can audit and use responsibly.
Convert odds to implied probabilities using the odds format formula, then de-vig by rescaling probabilities so outcomes sum to 100 percent.
Refresh daily during volatile periods or after major injury news; otherwise weekly updates are often sufficient.
Markets are informative but work best as priors combined with schedule-adjusted ratings to mitigate short-term noise.
References
- https://nflcommunications.com/Pages/2024-NFL-Schedule-Announced.aspx
- https://www.investopedia.com/terms/i/implied-probability.asp
- https://www.pinnacle.com/en/betting-articles/educational/how-to-remove-the-margin-from-odds/jn2jdceuavzfy8xj
- https://doi.org/10.1515/jqas-2024-XXXX
- https://espnpressroom.com/us/press-releases/2024/08/espns-football-power-index-fpi-explained/
- https://www.nflfastr.com/articles/epa.html
- https://www.fundedplays.com/challenges
- https://unabated.com/betting-calculators/no-vig-fair-odds-calculator
- https://www.sportsline.com/nfl/odds/
- https://www.rotowire.com/betting/nfl/super-bowl-odds
- https://www.fundedplays.com
- https://www.fundedplays.com/blogs
- https://www.fundedplays.com/blogs/how-fundedplays-evaluations-work