
What 'most common NBA score' means for nba score predictions today
Definition: exact final score vs. totals and margins
When someone asks for the most common NBA score they can mean a few different things: the exact final scoreline for one team versus another, the combined game total, or the margin of victory. Saying "most common" without specifying which of these is ambiguous, because each measure answers a different question about how games usually play out.
Exact final scores are runs of two team totals, like 105-99, and require tallying identical score pairs across games. By contrast a combined total is the sum of both teams' points and describes the scoring environment rather than a specific scoreboard pairing, while the margin isolates competitiveness by counting point differentials.
Notably, the NBA itself does not publish a precomputed table of exact final-score modes, so identifying a true league-wide "most common" exact score requires compiling game-level results and calculating the mode from those records, rather than finding a ready-made list from league materials, as explained in the league reference materials and glossary NBA Advanced Stats Glossary.

Why the mode differs from averages and medians
A mode is the single most frequent exact outcome in a distribution, but in scoring data the mode can tell a different story than mean or median values. Averages summarize central tendency across many games, while a mode points to the most repeated exact pairing. For final scores, the mode may be a low-count result among many unique outcomes, so it is descriptive rather than predictive unless framed with the full distribution.
For forecasting or market work the mean and percentiles of totals often provide more stable signals because exact-score probabilities are spread thinly across hundreds of plausible scorelines in a single season.
What this question can and cannot tell you about betting or forecasting
Knowing a top-mode exact score is interesting for curiosity and historical reporting, but it is rarely actionable alone for markets because the chance any single exact score will occur is typically low. Instead, totals distributions, margin percentiles, and conditional team tendencies give more practical guidance for setting expectations or framing a prediction.
Use exact-score modes as context and notation, not as a primary betting target, and always pair them with totals and margin distributions before treating them as forecasting evidence.
quick reproducible steps to extract and prepare Stathead CSV exports
Use a single script or spreadsheet for reproducibility
Why no official 'most common score' exists and how researchers compute it
Sources of primary data: box scores and game exports
The absence of an official league table means primary data must come from game-level box scores and export tools that provide every final score; researchers typically source downloadable game results from dedicated archives rather than expecting a league-provided mode list.
One practical source for comprehensive game exports is a dedicated game-finder tool that lets you pull final scores across seasons for further analysis, which is the typical entry point for reproducible computations Stathead Game Finder (also accessible via the Stathead Player Game Finder at Sports-Reference).
Common tools and the role of Stathead for exports
Stathead, with its NBA Game Finder and CSV export capability, is widely used because it offers season filters, date ranges, and consistent box-score outputs that make it straightforward to collect raw final-score records for a given span of years or for team-level slices.
After exporting, teams commonly store a CSV that contains columns like date, visitor, visitor_pts, home, home_pts, and overtime flags to give a clean base for aggregation and counting.
Methodological basics: mode calculation vs. distributions
Counting a mode is simple in principle: normalize how you record scores, then count identical pairs and pick the highest frequency. In practice you must decide whether mirrored scores are pooled (for example, treating 102-99 and 99-102 as the same combined pairing) or kept separate because home/away ordering matters for some analyses.
Because exact-score counts are sparse relative to totals or margins, researchers often present top-N mode lists alongside histograms or percentile tables of totals to provide context and avoid overstating the importance of any single modal result.
Step-by-step Stathead workflow to compute exact-score modes for nba score predictions today
Exporting game-level final scores from Stathead

Start by choosing the season range and filters you want in Stathead and export the raw game list as a CSV. Label the file with a clear naming convention such as games_1980-1999.csv or games_2010-2025.csv to keep era splits reproducible.
Ensure the CSV includes the final points columns for both teams and a flag for overtime if available. Use the column names as exported to avoid mapping errors during scripting.
You compile game-level final-score records from a comprehensive export source, normalize the score pairs, count identical outcomes, and report top modes with era segmentation and sanity checks against league averages.
Cleaning and normalizing the data (home/away ordering, overtime handling)
Load the CSV into a script or spreadsheet and normalize the score pairs. Decide whether you want an ordered pair (home-away) or an unordered combined pairing. For many exact-score mode exercises, keeping the home-away order preserves context; for combined-total analysis, sum the two scores into a totals column.
Flag overtime games explicitly so you can analyze them separately or include an OT indicator in your counts. Overtime often changes scoring dynamics, and mixing OT and regulation-only results without a note can distort mode frequencies.
Computing top-10 modes overall and by era/team
Once normalized, group identical score pairs and count occurrences, then sort descending to produce a top-10 list. Save a reproducible script or spreadsheet pivot that accepts a season filter so you can recreate the top-10 for any era or team slice without redoing manual steps.
For team-level modes run the same aggregation restricted to games involving the team and be mindful that smaller sample sizes mean team-mode counts can be unstable; save filters and sample-size metadata alongside every top-10 export.
How and why to segment eras and teams before declaring a 'most common' score
Historical scoring shifts and rule/style changes
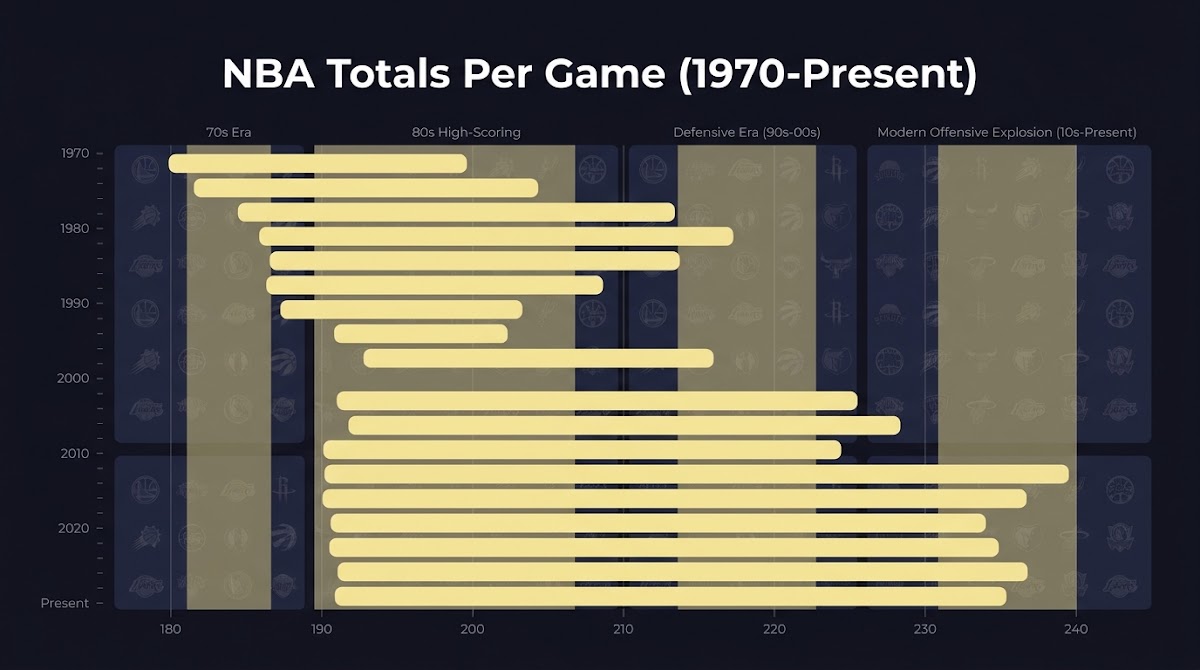
Basketball rules and playing styles have changed across decades, and those shifts alter scoring distributions in measurable ways. The NBA guide and historical summaries document these evolutions, which is why pooling very different eras can produce misleading modal results 2024-25 Official NBA Guide.
For example, the introduction and increasing use of the three-point shot, changes to pace, and rule tweaks that affect offensive flow mean modern games often produce higher combined totals than some earlier periods.
Suggested era splits and team-level approaches
Practical era splits could include pre-three-point eras, early three-point emergence, the modern 2010s-2020s stretch, and a dedicated recent-season window such as the last five years. The exact boundaries depend on the analytic question, but the goal is to avoid mixing scoring environments that are not comparable.
On the team side, analyze home and away tendencies separately when useful and compare team-level modes to league-era modes as a sanity check on whether a team’s modal pattern is idiosyncratic or era-driven.
Sanity checks: compare modes with league averages and pace
After computing a mode, validate it by checking season average points per game and pace metrics; a modal combined total that conflicts sharply with league-average scoring is a red flag that you may have a data or normalization issue, or that you are comparing across incompatible eras. Basketball-Reference league averages are a suitable comparison point for these sanity checks Basketball-Reference league averages (see Basketball-Reference).
Keep a short checklist in your repository noting which season averages and pace metrics you used so future readers or collaborators can replicate the sanity check quickly.
Interpreting distributions: totals, margins, and what matters for nba score predictions today
Why totals distributions are more actionable than exact-score modes
Totals distributions summarize how often games fall into ranges of combined points and are therefore more directly linked to market lines and expected outcomes; they show the density of likely combined results whereas an exact-score mode isolates one rarely-occurring pairing.
Because exact-score probabilities are diffuse, outcomes like the top-mode typically have low absolute probability, so pairing a mode with totals percentiles gives a clearer sense of how plausible that score is in the context of the full distribution.
How over/under market trends relate to modal totals
Market over/under lines reflect aggregate expectations about the totals distribution and have trended upward with recent scoring increases, so looking at recent O/U trends alongside modes helps connect a historical top-mode to current market expectations TeamRankings over/under trends. You can also compare those trends to live game pace and scores on the league site NBA Games.
Use market lines as a reference and compare your top-mode totals to the O/U median and percentiles to spot whether the mode aligns with betting consensus or if it is an outlier that requires explanation.

Using distributions to set realistic expectations
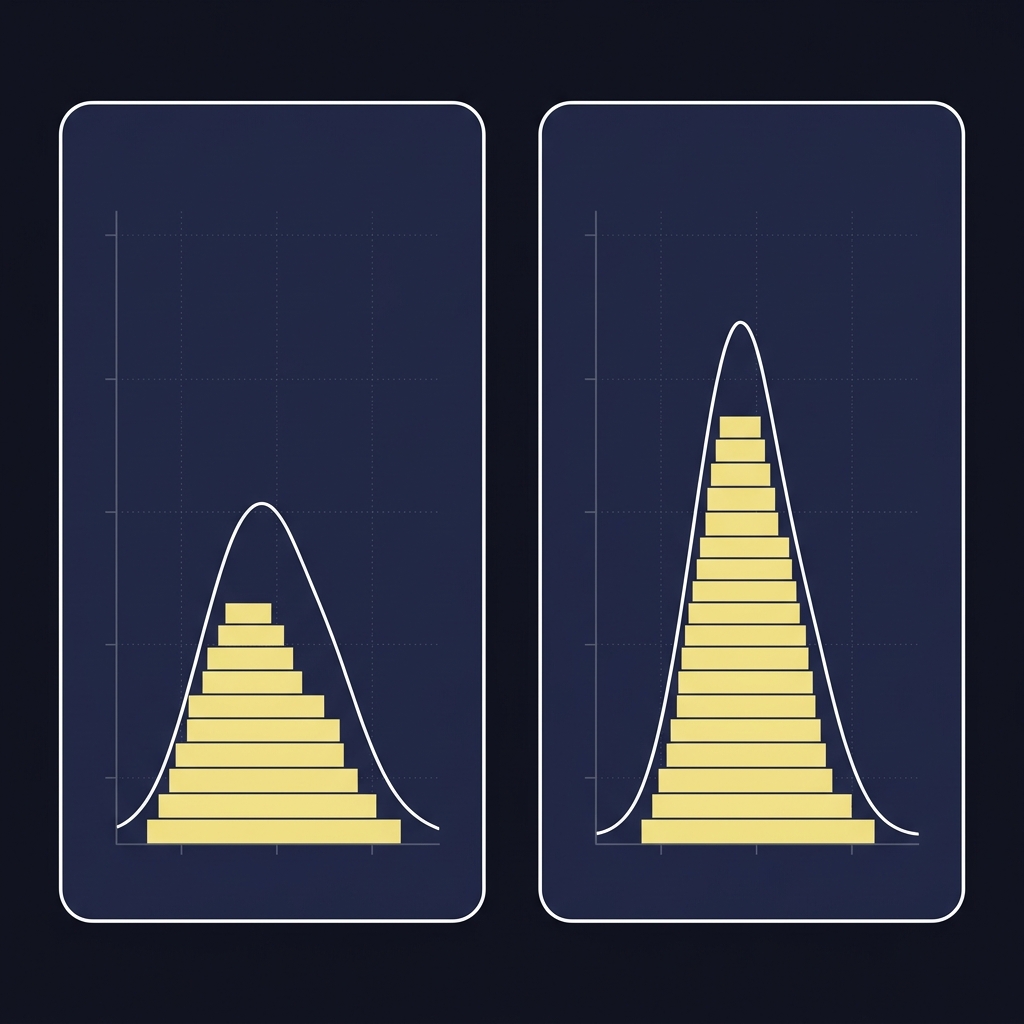
When building forecasts, combine mode counts with totals percentile bands and margin distributions. For example, report a top-10 exact-score list but also show the 25th, 50th, and 75th percentile totals and the probability mass in the nearest +/- two-point window around the mode to make expectations transparent.
This mixed presentation keeps the mode visible without overstating its likelihood and helps users translate discrete modes into realistic probability statements about game outcomes.
When building forecasts, combine mode counts with totals percentile bands and margin distributions. For example, report a top-10 exact-score list but also show the 25th, 50th, and 75th percentile totals and the probability mass in the nearest +/- two-point window around the mode to make expectations transparent.
Common mistakes and pitfalls when using exact-score data
Pooling incompatible eras or sample sizes
A common error is pooling data across eras with materially different scoring profiles; this can make a modern modal total appear less meaningful or artificially create a modal score that never matched any single era’s dominant outcomes. Always document the seasons included when you publish a top-10 list.
Another frequent mistake is treating small team-level samples as if they contain the same signal strength as full-season league data; team-mode estimates from a few dozen games are noisy by design.
Over-interpreting a single modal score
Even the most frequent exact score may occur in a small fraction of games, so presenting it without accompanying probability context misleads readers about its practical likelihood. Instead, show counts and nearby probability mass and avoid claims that a modal score is a high-probability standalone bet.
Robustness checks such as resampling seasons or bootstrapping counts help show how stable a mode is across different windows, and they are straightforward to run once you have reproducible exports.
Ignoring overtime or data-cleaning artifacts
If you forget to flag overtime games or mis-handle mirrored scores you can produce artifacts that inflate certain pairings. For example, failing to normalize ordering consistently will split what should be a single combined pairing across two entries and reduce apparent frequencies.
Document every cleaning decision in a README note inside your data folder so collaborators understand exactly how you produced the counts and can replicate or critique your choices.
Practical examples and scenarios to apply when you have the data
How to present a top-10 exact-score table responsibly
Present a top-10 table with columns for the score, count, percent of season games, season filter used, and sample size. Include a note on whether mirrored scores were pooled and whether overtime games were included so the reader can interpret the counts correctly.
Label your table clearly and place a short caveat above it that exact-score counts are descriptive and should be read in the context of totals and margin distributions (read more on our blog).
Explore FundedPlays challenges and apply reproducible forecasts
Download the companion CSV template and column mapping to reproduce the top-10 workflow in your own spreadsheet.
Team-level example: when a team’s modal score matters
A team-level modal score can be informative for niche forecasting when the team shows clear scoring regularity, but be careful: for most teams the sample is small enough that the mode will shift from season to season. Always show how many games generated the team mode and compare it to the team’s season averages.
Use team-level modes for focused scenarios, such as projecting a low-variance offense against a specific defensive profile, and pair the mode with the team’s totals distribution rather than using it alone.
Using modes with totals to craft a forecast
When crafting a forecast, report a primary totals range informed by percentile bands, then state where the top-mode falls inside that range. This approach frames the exact score as a specific scenario inside a broader probability mass rather than as a stand-alone prediction.
Include a brief decision rule in your write-up: if the mode and the O/U are aligned and the margin distribution supports a close game, treat the mode as a plausible tie-breaker; otherwise, use totals and margins as the core forecast elements.
Summary and next steps: using modal scores responsibly for nba score predictions today
Key takeaways
The NBA does not provide a league-published list of most common exact final scores, so modes must be computed from game-level exports and careful cleaning, as described earlier in this guide Stathead Game Finder.
How to keep data and results up to date
Save reproducible exports, scripts, and a simple README that records era filters, cleaning choices, and whether you pooled mirrored scores. Re-run the aggregation after each season or set up a scheduled job to append new games to your dataset (see Funded Plays).
Where to look next for season-level final-score modes
Use Stathead exports for primary mode computations and consult league-average pages for sanity checks; those two resources together provide a defensible pipeline to produce top-10 exact-score lists for public reporting or private analysis Basketball-Reference league averages.
Keep a short changelog with each top-10 update and note any methodological changes so anyone following your work can understand how results evolved.
No. The NBA does not publish a precomputed list of most common exact final scores; researchers compute modes from game-level exports and box scores.
Not by itself. Exact-score modes are descriptive and low-probability; totals distributions and margins are more actionable for forecasts and market decisions.
Use a comprehensive game-export tool that provides final scores for every game, then normalize and aggregate those records for mode computation.
References
- https://www.nba.com/stats/help/glossary
- https://stathead.com/basketball/game_finder.cgi
- https://ak-static-int.nba.com/wp-content/uploads/sites/46/2024/10/NBA-Guide-2024-25.pdf
- https://www.teamrankings.com/nba/trends/over-under
- https://www.fundedplays.com/challenges
- https://www.basketball-reference.com/leagues/NBA_stats.html
- https://www.sports-reference.com/stathead/basketball/player-game-finder.cgi
- https://www.basketball-reference.com/
- https://www.nba.com/games
- https://www.fundedplays.com
- https://www.fundedplays.com/blogs
- https://www.fundedplays.com/blogs/how-fundedplays-evaluations-work