
What a monthly performance review for funded challenges should do
A Monthly Performance Review for Funded Challenges is a short, repeatable pack that summarizes how a funded account challenge performed over the previous month and what should change next. It is designed to give challenge operators and participants a clear view of outcomes, compliance status, and priority actions without replacing the underlying position logs or longer term performance archives.
Purpose and audience of the review
Target readers include active participants in funded account challenges, challenge administrators, and analysts who monitor signal performance. The report should be accessible to users who know the rules of a funded challenge and to newcomers who need a concise orientation to results and risks.
Build a one-page pack that reports return, volatility, worst peak-to-valley drawdown, Sharpe and Sortino ratios, a compliance log entry, and a prioritized corrective-action checklist; label simulated results prominently and use selection-aware checks like the Deflated Sharpe Ratio before promoting backtested signals.
At its simplest, the review exists to increase transparency, confirm rule compliance, validate signals, and produce a short, prioritized plan for the next month so decision makers can act quickly and consistently.
How a monthly review fits into funded challenge workflows
The monthly review complements daily position logs and ongoing tracking by providing a higher level snapshot that highlights trends and compliance items that are not obvious from single-day reports. It should reference the day-to-day records for details while remaining short enough to circulate to teams and participants for rapid review.

Key metrics to include and why they matter
Start with top-line return measures: simple total return for the month and a time-weighted return where fairness across account sizes or external cash flows matters. Time-weighted returns keep comparisons cleaner when funding or simulated bankrolls change mid-period, and they help avoid misleading conclusions when different accounts have different cash events.
Volatility is the next essential pillar. Simple standard deviation of returns gives context to the headline return and helps readers see whether positive performance came with steady gains or with high variability that may not be repeatable. When possible, present both raw volatility and an annualized equivalent so month-to-month differences are easier to interpret.

Downside variability deserves special attention because it reflects the kind of risk that most participants care about: losses and drawdowns. A downside-focused measure such as the Sortino ratio complements the Sharpe ratio by separating harmful volatility from overall variability, helping readers judge whether a given return profile hides a lot of downside risk Sortino ratio: Definition, Formula, and Example.
For regulatory and comparability reasons, include the worst peak-to-valley drawdown as a named field on every monthly pack, because U.S. performance disclosures for similar strategies continue to recognize this measure as a standard risk metric 17 CFR § 4.35 - Required disclosures for Commodity Trading Advisors (see official text 17 CFR Part 4).
Building the one-page dashboard: mandatory fields and layout
Top-line snapshot: returns, volatility, worst drawdown
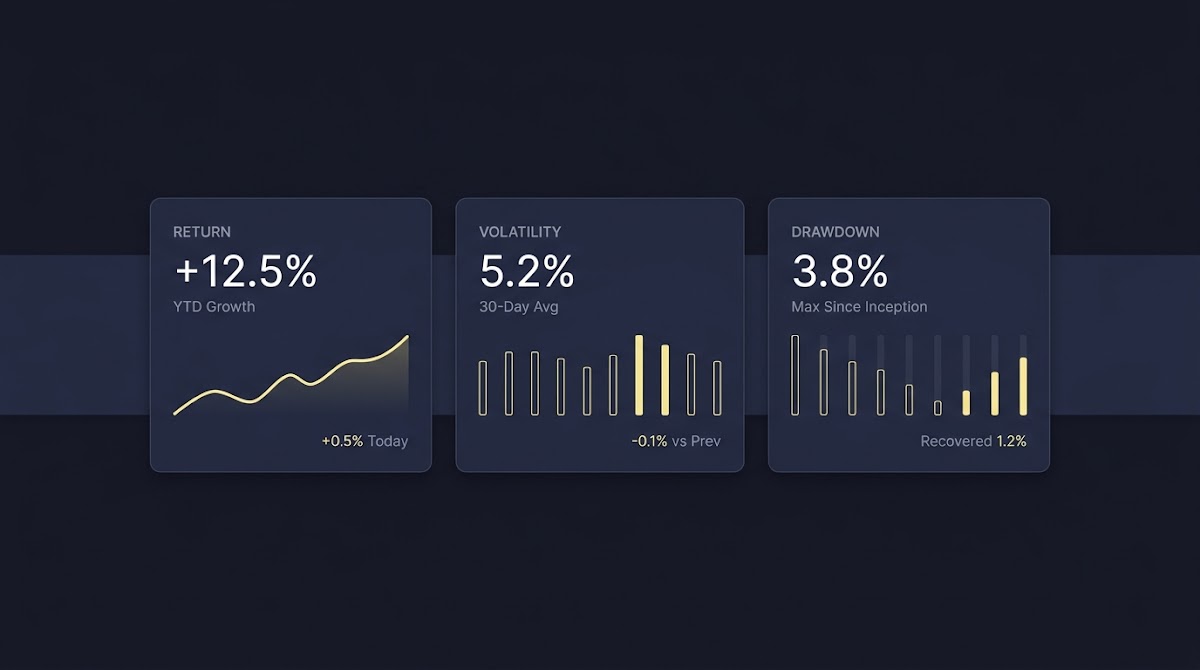
The top of the page should show three headline tiles in clear order: monthly return, monthly volatility (annualized), and worst peak-to-valley drawdown for the period and for a rolling window of your choice. See related discussion in our blog.
Below the tiles, a short line should state whether the month includes any simulated or backtested results and link to the compliance notes that carry the required disclaimers. When you present hypothetical performance, make the simulated status obvious and close to the headline so viewers do not mistake paper trading for live results 17 CFR § 4.41 - Advertising by commodity pool operators and commodity trading advisors.
Get the One-Page Monthly Template
Download the printable one-page template to use as a starting point for your next monthly review.
Supporting panels: risk-adjusted metrics, compliance badge, and notes
Place a small panel showing Sharpe and Sortino values, a compact compliance badge (OK, review needed, or escalated), and a short notes field with material items: rule exceptions, unsettled disputes, or required data corrections. This supports quick triage by an analyst or participant.
Reserve a small area for a brief, prioritized corrective-action checklist tied to owners and deadlines so the dashboard is not just descriptive but also prescriptive and traceable.
How to calculate returns and volatility reliably
Net versus gross returns and when to use time weighting
Decide at the outset whether returns are reported net of fees or gross. For internal reviews of strategy performance, gross returns can be useful, but any public presentation should clearly state which basis is used. When external cash events or simulated bankroll adjustments occur during the month, use time-weighted returns for fairness and comparability across accounts.
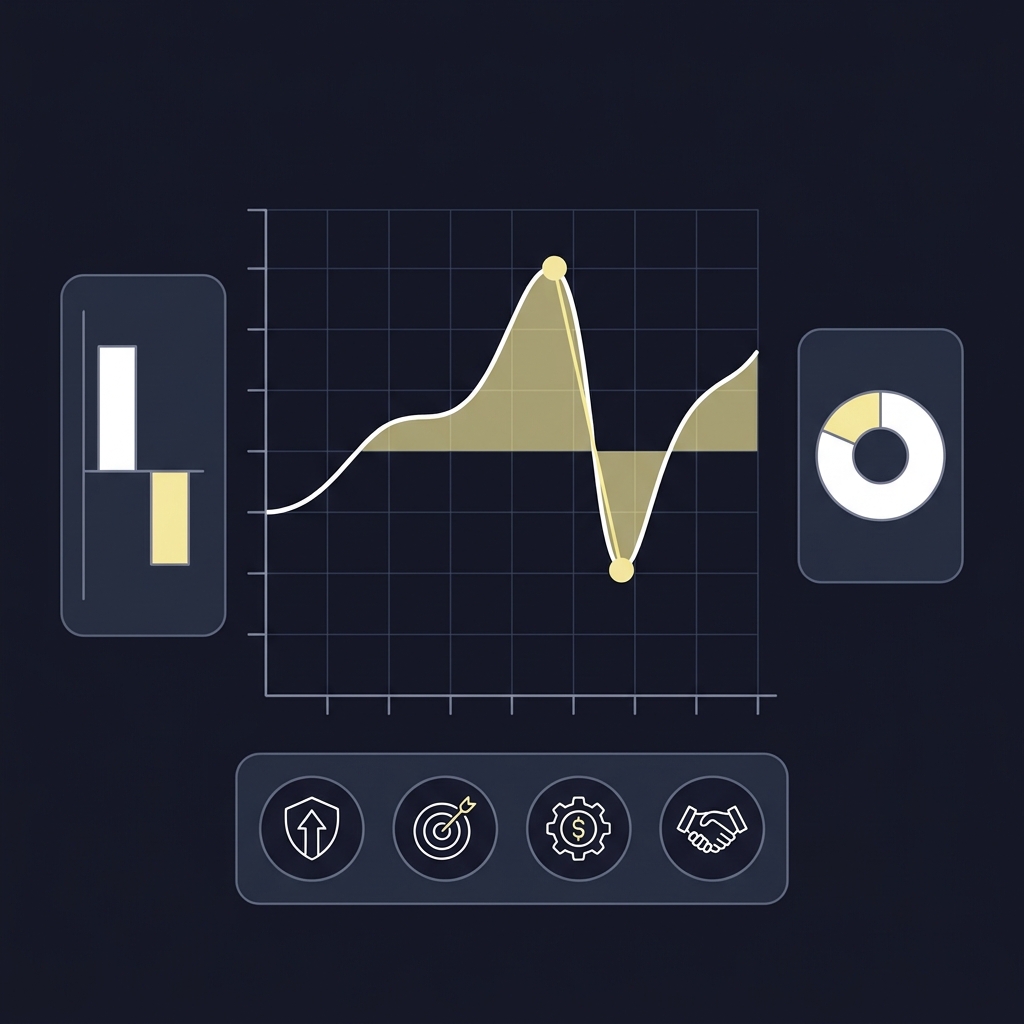
Basic steps to compute a time-weighted monthly return: segment the month into subperiods at each cash flow, compute subperiod returns, chain them multiplicatively, and express the result as the period return. This prevents inflating or understating performance when account balances change mid-month.
Standard deviation, annualization, and data frequency caveats
Compute monthly volatility as the standard deviation of periodic returns using consistent frequency, then annualize by multiplying by the square root of the number of periods per year. For daily returns, use the square root of 252; for weekly use the square root of 52. Be explicit about the frequency and the sample size to avoid misinterpretation.
Watch for common data pitfalls such as missing trade days, divergent timestamp conventions, and lookahead bias in strategy signals. Document any adjustments in the notes panel so the monthly pack remains auditable and repeatable.
Measuring drawdown: implementing worst peak-to-valley drawdown
Definition and exact calculation steps
Compute worst peak-to-valley drawdown by scanning the equity series to find the largest drop from a peak value to a subsequent trough before a new peak occurs. Report both the percentage drawdown and the dates of the peak and trough so readers can see the timing and magnitude of the event.
For rolling windows, apply the same peak-to-valley logic over the chosen window length, for example 3-month or 12-month rolling windows, and report the maximum drawdown observed within each window to surface recent deterioration without losing the long view.

Why this matters in practice: the worst peak-to-valley drawdown gives an immediate, easily understood measure of realized downside and is a required disclosure in certain U.S. managed-futures and CTA reporting contexts, making it essential for any pack intended for broad distribution 17 CFR § 4.35 - Required disclosures for Commodity Trading Advisors. For additional disclosure guidance see the NFA guide on CPO disclosures Disclosure Documents: A Guide for CPOs.
Risk-adjusted measures: Sharpe, Sortino, and the Deflated Sharpe Ratio
Interpretation and limits of Sharpe and Sortino
The Sharpe ratio measures excess return per unit of total volatility and is useful for broad comparisons across strategies, while the Sortino ratio isolates downside volatility to focus on harmful variability. Use both to give readers two lenses on the same performance profile Sharpe Ratio: Definition, Formula, and Limitations.
Be explicit about the risk-free rate used in Sharpe calculations and the downside threshold used for Sortino so values are reproducible. Note that short sample windows amplify noise in these ratios, so treat single-month changes cautiously and prefer multi-month averages when deciding actions.
When and how to apply the Deflated Sharpe Ratio for selection-aware evaluation
To reduce false positives from backtests and multiple testing, the Deflated Sharpe Ratio adjusts the observed Sharpe for selection bias and non-normal returns, giving a more conservative estimate of whether a recorded Sharpe is likely genuine The Deflated Sharpe Ratio: Correcting for Selection Bias, Backtest Overfitting, and Non-Normality.
Use the Deflated Sharpe Ratio as part of a threshold test before promoting a new signal from backtest to live trials. If a backtest shows a high Sharpe but the Deflated Sharpe falls below your acceptance threshold, treat the signal as suspicious and require more out-of-sample live evidence before wider use.
quick Deflated Sharpe Ratio check for backtest selection bias
conservative guide only
Compliance and disclosure checklist for hypothetical or simulated results
Any presentation that includes simulated or hypothetical performance must carry a prominent disclaimer and clear labeling so viewers cannot mistake paper trading for live results. U.S. rules require specific caution when advertising hypothetical performance, and the disclosure should sit near the figures it qualifies rather than buried in a long appendix 17 CFR § 4.41 - Advertising by commodity pool operators and commodity trading advisors (see the statute text at Law.Cornell).
Practical wording tips: use short, plain-language statements such as Notice: This chart includes hypothetical results generated by backtests and paper trading. Past simulated performance does not predict future live results. Position this text close to any simulated panels and replicate it on any exports or screenshots.
Avoid selective presentation. If you show simulated results, also show live results where available and explain differences in methodology, sample period, and the treatment of fees or slippage so viewers can judge comparability.
Maintaining a rule-compliance log and error correction workflow
Keep a concise rule-compliance log that records at minimum: the rule referenced, date, short description of the event, owner, corrective action, and verification status. This lets reviewers trace how an exception or data problem was handled and who closed the item.
Adopt GIPS-style error correction practices for material issues: correct the error, document the impact and the correction method, and communicate materially relevant changes to affected parties. GIPS guidance on composite construction and error handling offers a tested approach for transparent corrections Global Investment Performance Standards (GIPS) for Firms.
Specify when an issue is material enough to escalate. As a practical rule, escalate when an error changes a top-line metric or compliance status that participants or external reviewers would reasonably use to make a decision.
Decision criteria: how to judge signals and decide corrective actions
Quantitative thresholds and qualitative checks
Create explicit thresholds that map into actions, for example: if monthly return drops below -5 percent with drawdown exceeding internal tolerances, flag the signal for immediate review; if Sharpe falls below a rolling minimum, consider pausing new exposure. These thresholds should be calibrated to your strategy and the funded challenge rules you operate under.
Qualitative checks include recent rule exceptions, data integrity issues, and any operational changes that could explain a performance shift. Always pair a quantitative trigger with a short qualitative review to avoid knee-jerk changes based on noise.
Using the Deflated Sharpe Ratio to avoid false positives
Before promoting a backtested signal, require a Deflated Sharpe Ratio check. If the check suggests high selection bias, put the signal into a controlled live trial rather than full deployment. This reduces the chance that a signal fails once exposed to live market conditions and real participant behavior The Deflated Sharpe Ratio: Correcting for Selection Bias, Backtest Overfitting, and Non-Normality.
Document the decision, the metric that triggered it, and the owner assigned to follow up so the next monthly pack can report on whether the corrective plan succeeded.
Common mistakes and pitfalls to avoid in monthly reviews
Do not overstate simulated performance. Presenting backtests without prominent disclaimers and without clear methodological notes is misleading and can breach disclosure rules. Label simulated data plainly and include the required disclaimers close to the figures they relate to 17 CFR § 4.41 - Advertising by commodity pool operators and commodity trading advisors.
A second common error is ignoring small sample effects. One or two strong months can inflate Sharpe readings; selection-aware tests and the Deflated Sharpe Ratio help detect likely false discoveries when many signals or parameter sets have been tried The Deflated Sharpe Ratio: Correcting for Selection Bias, Backtest Overfitting, and Non-Normality.
Operational mistakes include inconsistent calculation methods across months and unclear documentation of data frequency. Treat methodology changes as material and document them in the compliance log so past comparisons remain meaningful.
Practical example scenarios and a ready-to-use checklist
Scenario A: New signal with strong backtest but limited live data
Situation: a recently developed signal shows high backtest returns and a strong Sharpe, but live data covers only a handful of trades. Action: run a Deflated Sharpe Ratio test; if it flags selection risk, start a controlled live trial with capped exposure and require a minimum number of live trades before promotion. Record this trial in the dashboard notes and the compliance log so progress is visible next month The Deflated Sharpe Ratio: Correcting for Selection Bias, Backtest Overfitting, and Non-Normality.
Checklist item examples: assign an owner, set trial size and duration, specify stop-loss rules, and add an entry in the corrective-action checklist with a deadline for review.
Scenario B: Stable strategy with increasing drawdown
Situation: a strategy with historically steady returns shows a gradual increase in drawdown but unchanged gross returns. Action: verify data integrity, check for rule exceptions or market regime shifts, and reduce new exposure until cause is understood. If drawdown breaches regulatory-relevant thresholds, escalate and document the action in the compliance log 17 CFR § 4.35 - Required disclosures for Commodity Trading Advisors.
Checklist item examples: compare current drawdown to rolling window history, test for parameter sensitivity, and assign a remediation owner with a specific deadline and success metric.
A prioritized corrective-action plan template for the next month
Use a simple priority schema: P1 immediate (within 3 days), P2 near term (within 2 weeks), P3 monitoring (by next monthly review). Link each task to an owner and a measurable success criterion so closure is objective, for example reduce drawdown to below X percent or complete five live trades for a new signal.
Sample task entries: P1 data correction - owner, date, verification; P2 trial expansion - owner, target trades, performance threshold; P3 monitoring - owner, update cadence. Record outcomes in the next monthly pack so the loop is complete and auditable.
Closing summary and what to carry into the next review
Keep the monthly pack focused on the one-page dashboard fields: return, volatility, worst peak-to-valley drawdown, Sharpe and Sortino, compliance status, and a short corrective checklist. These items provide the right balance of outcome, risk context, and actionability for funded challenge environments.
Three items to track next month: 1) any outstanding compliance log items, 2) progress on P1 corrective tasks, and 3) live evidence for any signals promoted from backtests. Always label simulated results clearly and maintain the compliance log as the audit trail for decisions.
Label simulated or backtested results clearly and place a prominent disclaimer near the figures, explaining that hypothetical results do not predict future live outcomes.
Worst peak-to-valley drawdown is the largest drop from a high to a subsequent low; it is a standard risk measure that helps readers see realized downside and is required in some U.S. disclosures.
Use the Deflated Sharpe Ratio when evaluating backtests or many candidate signals to adjust for selection bias and reduce false positives before wider deployment.
References
- https://www.investopedia.com/terms/s/sortinoratio.asp
- https://www.ecfr.gov/current/title-17/chapter-I/part-4/section-4.35
- https://www.govinfo.gov/link/cfr/17/4?link-type=pdf§ionnum=12&year=mostrecent
- https://www.fundedplays.com/blogs/how-fundedplays-evaluations-work
- https://www.fundedplays.com
- https://www.fundedplays.com/blogs
- https://www.investopedia.com/terms/s/sharperatio.asp
- https://papers.ssrn.com/sol3/papers.cfm?abstract_id=2465184
- https://www.cfainstitute.org/-/media/documents/code/gips/2020-gips-standards-for-firms.ashx
- https://www.fundedplays.com/challenges
- https://www.nfa.futures.org/members/member-resources/files/cpo-disclosure-documents.pdf
- https://www.law.cornell.edu/cfr/text/17/4.41