
What maximum drawdown is and why it matters
Definition in plain language
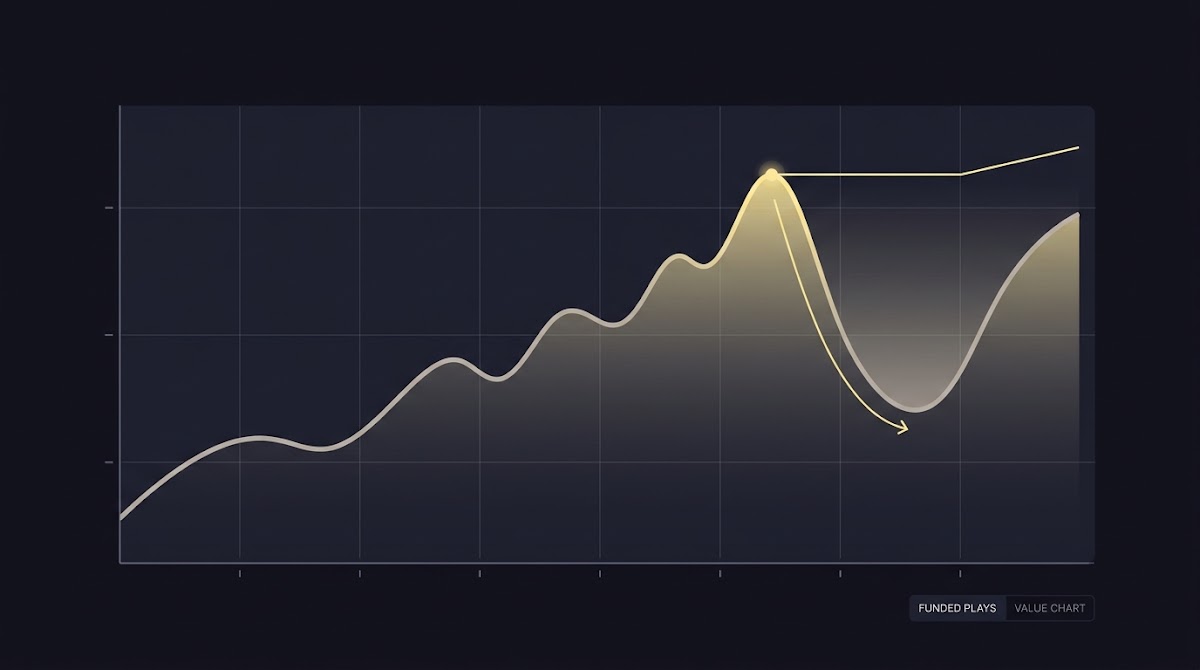
Maximum drawdown is the largest peak to trough decline in a value series before a new peak is reached. In plain terms, it captures the deepest single drop an account or position experiences during a measurement window, and it describes not only how far the value fell but how long recovery took. This path dependent property makes maximum drawdown useful for assessing downside risk and recovery depth in settings where losing streaks and recovery time matter for continuity of participation and capital preservation, as described in a standard definition resource on maximum drawdown Investopedia definition of maximum drawdown.
Because the metric references a running high water mark and a subsequent trough, it differs from single period loss measures that only look at one day or one event. A single bad day can be important, but maximum drawdown summarizes the worst sustained decline from any previous peak to the lowest point that follows it.
How MDD differs from volatility and single period loss
Volatility and maximum drawdown measure different aspects of risk. Volatility captures dispersion of returns around an average, a symmetric measure that treats upside and downside variance similarly. Maximum drawdown focuses on downside movement and recovery path, which is often more relevant when a program must satisfy participation rules or maintain a minimum funding cushion. Morningstar and other fund analysis guides contrast these concepts when evaluating downside behavior for funds Morningstar discussion of maximum drawdown in fund analysis.

In practice, a strategy can show low volatility but still have a deep drawdown if returns are uneven and recovery is slow. For challengers and platform operators that require consistent performance, maximum drawdown gives a clearer view of worst case runs and the likelihood the account can meet progress checkpoints.
How maximum drawdown is calculated: step by step
Running high water mark method
The standard computation tracks a running high water mark and measures the percentage drop to the worst subsequent trough. Start from the first observation, record the highest value seen so far at each step, and compute the percent decline from that high to each later low. The running high water mark approach is the recommended operational method for portfolios and single positions, consistent with commonly used definitions and calculation examples Investopedia definition of maximum drawdown.

Because the method is path dependent, the recorded drawdown can change as new peaks and troughs appear, which is why keeping a chronological record is essential. That chronological trace also enables straightforward visualization: plot the value series, overlay the running high water mark, and read the largest vertical gap down to a trough.
Simple spreadsheet implementation
Set up a minimal spreadsheet with these columns: Date, Portfolio Value, Running High Water Mark, Drawdown Percent. Use a formula for the running high water mark that picks the maximum of the current value and the previous high water mark, and compute drawdown percent as the percentage difference between portfolio value and the running high water mark. The column layout and formulas give a replicable table that produces the peak and trough points needed to extract MDD Investopedia calculation guide.
Be explicit about data frequency. Daily closing values are standard for many reports, but intraday data will usually show larger and shorter drawdowns. When you pick a frequency, document it and use the same cadence in backtests and live monitoring so comparisons are meaningful.
Quick check to compute running high water mark and percent drawdown
Use daily or intraday values to match your monitoring frequency
Common rule sets to limit drawdowns and their trade-offs
Percent loss caps
Percent loss caps impose a portfolio level ceiling on cumulative loss, for example pausing new positions or stepping down exposure when the account falls by a defined percent from its high. These caps are simple to explain and implement, and they create a clear operational trigger for de-risking. Industry guidance on stop orders and portfolio risk notes percent caps as a straightforward control to contain total exposure FINRA guidance on stop and stop limit orders.
The trade-off is that a hard percent cap may force premature pauses in volatile regimes or lead to larger realized losses if markets gap. To mitigate this, many programs layer caps with tiered step-downs so initial caps reduce new allocation rather than close everything at once.
Stop and stop-limit orders
Stop orders and stop-limit orders operate at the execution level to exit positions when prices move past defined points. They can limit losses on individual positions without touching portfolio allocation rules, which helps keep position-level risk consistent. Practical cautions include execution uncertainty and the potential for stop price slippage in illiquid or fast markets, which investment industry resources warn about when using stop or stop-limit orders FINRA stop order caution.
Stop-limit orders add a limit price to reduce the chance of a poor execution price, but they can fail to execute if markets move too quickly. For platforms and challengers, it is important to document how order types interact with the platform's matching and settlement rules so the operational behavior matches expectations.
Trailing stops and dynamic exit rules
Trailing stops move up as a position or portfolio reaches new highs, locking in some gains while leaving room for further upside. They are popular when the objective is to preserve upside gains after a run, but traders should be aware they do not guarantee better long-term outcomes and are exposed to execution risk and whipsaw in choppy markets. Explanations of trailing stop mechanics and their limits are available in educational resources about trailing stops CME Group article on trailing stop orders.
When combining trailing stops with other rules, test how they behave across different volatility regimes. Trailing stops can lock in profits on trending moves but may also trigger on temporary reversals, increasing realized turnover and transaction costs.
Position sizing and portfolio-level drawdown thresholds
Fixed risk per trade and its interaction with MDD
Pairing portfolio drawdown caps with fixed risk per trade reduces the chance that a few losing positions produce a catastrophic portfolio drawdown. The fixed risk per trade approach assigns a notional or percent risk to each position so that position sizes scale with volatility and stop distance; when every trade limits loss to a predictable percent, the worst case aggregate loss becomes more controllable. Optimization literature and drawdown constrained methods give formal support for combining sizing rules with portfolio thresholds Drawdown measure in portfolio optimization.
As an operational example, if each trade risks 1 percent of the portfolio, an operator can model how many consecutive losses would breach a 10 percent drawdown cap and design tiered responses. This clear mapping between per trade risk and portfolio vulnerability helps set realistic thresholds and reduces ambiguity during stress events.
Review sizing and drawdown rules on the FundedPlays challenges page
Review your current position sizing and document when a tiered step down should trigger. A short checklist in this article will help you align trade risk with portfolio drawdown limits.
Tiered de-risking and pause triggers
Tiered de-risking defines levels where the platform or trader reduces new allocations, tightens maximum position size, or pauses opening new positions when the account reaches predefined drawdown thresholds. This layered approach is more flexible than a single hard stop because it preserves participation at reduced risk while preventing small setbacks from cascading into larger failures. Research and practitioner notes recommend tiered responses and clearly documented triggers to maintain repeatability and control Drawdown constrained optimization background.
Operationally, document who can authorize a rule change or a restart after a pause, how alerts are sent, and what review steps are required. That governance reduces ambiguity and supports consistent treatment of borderline cases.
Trailing stops versus percent caps: practical trade-offs
When trailing stops help lock in gains
Trailing stops are useful when a program frequently reaches new highs and the priority is to protect gains while allowing continued upside. They mechanically ratchet the acceptable downside as the position appreciates, which means that a portion of a run is preserved without manual intervention. Educational materials on trailing stops explain how they track new highs and lock in gains CME Group trailing stop overview.
In trending markets, trailing stops can reduce the risk of losing an entire run to a sudden reversal. However, they also introduce sensitivity to the stop distance parameter: too tight and normal volatility triggers exits, too wide and the stop may fail to protect meaningful gains.
When percent caps are preferable
Percent caps at the portfolio level are simpler to administer and explain, particularly for evaluation programs and funded account challenges. They create a single clear boundary for acceptable cumulative loss and reduce operational complexity on execution systems because they focus on account state rather than individual fills. Regulatory and investor guidance that discusses stop and limit orders notes the practical simplicity of percent-level monitors when compared to per-order execution logic FINRA guidance on stop orders.
Percent caps are best when the environment includes many small positions or when the platform's matching process complicates precise per-order stops. They do not, however, lock in gains the way trailing stops do, so combining both concepts can provide complementary protections.
Practical implementation: spreadsheets and simple code
Minimal spreadsheet walkthrough
Build a sheet with Date, Value, High Water Mark, Drawdown Percent, and a column for any stop triggers you want to simulate, such as trailing stop level or next allowable position size. Use a cell formula for the running high water mark that references the previous row's high and the current value. For drawdown percent, subtract current value from the high water mark and divide by the high water mark; format the result as a percentage. A simple spreadsheet gives quick insight and lets you annotate the rows where rules would have triggered exits or pauses Investopedia spreadsheet example.
Start by computing MDD on representative data, choose a monitoring frequency, map fixed risk per trade to portfolio vulnerability, and design tiered thresholds that trigger step downs and reviews; validate choices with backtests and conservative slippage assumptions.
Pseudocode for a minimal MDD loop is short and illustrative: compute running high, compute drawdown, update max drawdown if current drawdown exceeds prior max, and check rule triggers. Keep your simulation honest about execution: model slippage on triggered exits and include a fill assumption when testing stop or stop-limit behavior.
Pseudo code for running MDD and stop logic
Example pseudo code can be adapted to many scripting environments. The core loop maintains a high water mark and flags rule triggers. When simulating trailing stops, implement a trailing threshold that updates as the high water mark updates; when simulating percent caps, compute cumulative loss from the highest portfolio value and compare it to the cap. Documentation and a short backtest across regimes helps validate the practical impact of these rules CME Group trailing stop guidance.
Remember that simulations rarely capture live execution nuances, so maintain conservative assumptions about slippage and fill rates during testing and note these assumptions in your documentation.
Common mistakes, monitoring and review cadences
Overfitting stop rules to past data
A frequent mistake is tuning stops and thresholds too tightly to historical winning stretches, which can fail in other regimes. Overfitting makes rules fragile and prone to poor performance when market behavior changes. Guidance on stop orders and execution cautions emphasizes testing across multiple regimes rather than optimizing to one period FINRA stop order caution.
To avoid overfitting, use simple, robust rules, validate them on out of sample data, and prefer tiered responses that degrade performance gracefully instead of binary breakpoints that force a single outcome.
Ignoring execution and liquidity effects
Rules that look good on paper can fail in live markets if liquidity or execution costs are ignored. Slippage, fills at poor prices, and temporarily frozen markets can all widen realized losses compared with simulated outcomes. Market guides that address stop implementation note these practical execution risks and suggest explicit allowance for slippage in planning and testing FINRA on execution and stop limits.
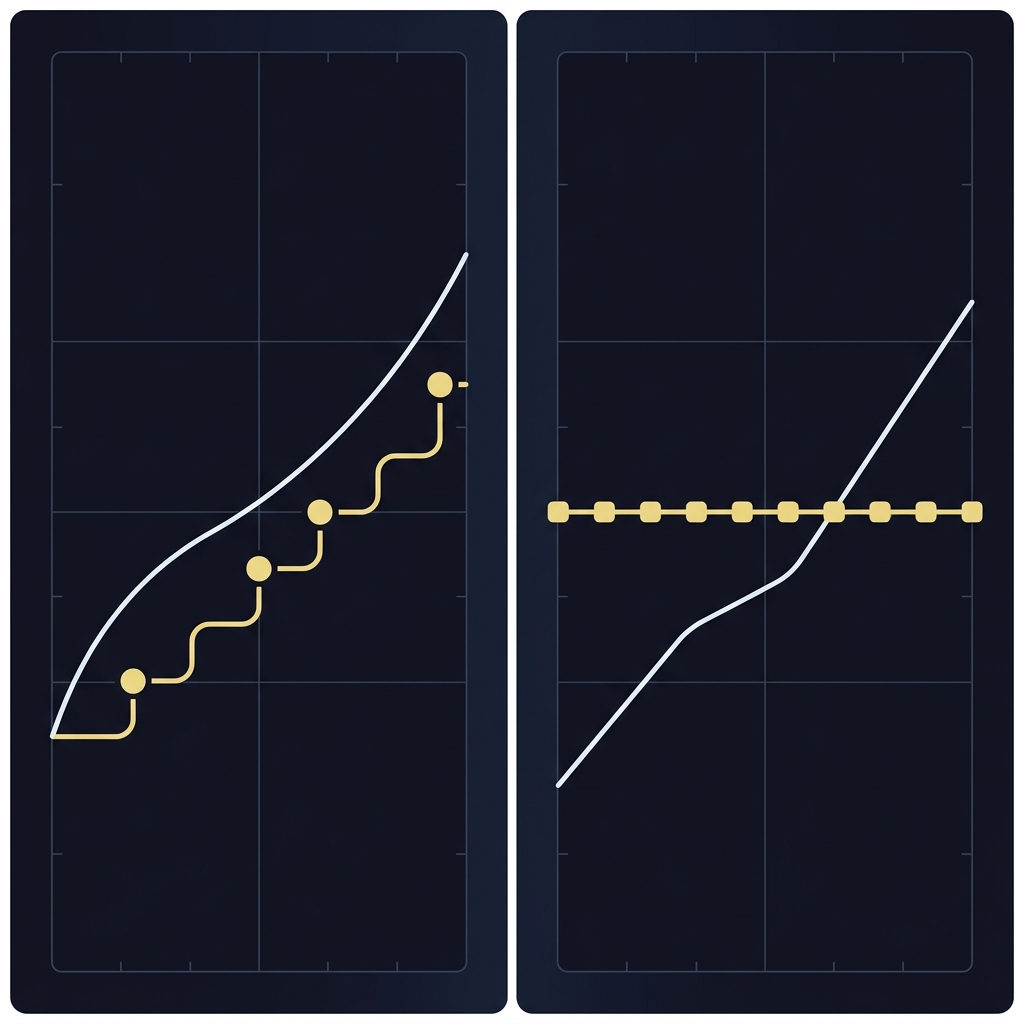
Monitoring best practices include automated alerts for threshold breaches, a defined review cadence after any material breach, and a short post event analysis that records what happened, why, and what corrective steps are recommended. A typical cadence might be daily alerts, a quick operational check after a breach, and a weekly rule health review during stressed periods.
Real world scenarios and calculation examples
Example 1: single position MDD walkthrough
Consider a single position with a simple price series. Compute the running high water mark at each timestamp and the percent drop to any later trough. The largest percent drop you find in that series is the position-level maximum drawdown. This method is the same used for portfolio and single asset MDD calculations in standard references Investopedia calculation example.
In practice, apply the same technique to intraday ticks or end of day prices depending on your monitoring frequency. Intraday series often reveal deeper, shorter drawdowns that a daily series misses, so match the data cadence to the rules you plan to enforce.

Example 2: portfolio with tiered drawdown rules
Imagine a portfolio that sets three thresholds: at 5 percent drawdown reduce new position size by 25 percent, at 10 percent pause new positions, and at 15 percent restrict existing trade risk to cash neutral until a formal review. Walk through the same price series and mark the row where the running high water mark produces a drawdown that crosses each threshold. That trace shows how the step downs would have changed portfolio behavior during the same adverse run. Drawdown constrained optimization literature supports designing thresholds that map to desired probability and utility outcomes Drawdown measure in portfolio optimization.
Compare how trailing stops on each position would have behaved on the same series. Trailing stops may have preserved more of a run in a trending decline, or they may have been triggered earlier in choppy reversals, depending on the stop distance. Document those differences and include execution assumptions when you present results.
Putting rules into action: checklist and next steps
Short checklist to adopt MDD rules
1) Define your monitoring frequency and record the decision. 2) Choose a portfolio drawdown cap and map it to step down actions. 3) Set fixed risk per trade so position sizes align with portfolio objectives. 4) Backtest rules across multiple regimes and include conservative slippage assumptions. 5) Implement alerts and a review cadence for breaches. These steps create a repeatable process to adopt drawdown rules backed by simulation and operational controls Drawdown constrained optimization background.
Who should sign off on changes depends on your environment. For a funded challenge program, define a small governance group and a clear restart process after a pause. Treat rules as hypotheses to be tested and refined rather than permanent prescriptions.
Maximum drawdown is the largest decline from a historical peak to the lowest subsequent point in a value series, showing the worst peak to trough drop and recovery challenge.
Choose a frequency that matches operational needs, commonly daily for reporting, with intraday monitoring if you need finer control; document the choice and use it consistently in tests.
No, trailing stops can lock in gains but do not guarantee better returns or execution certainty; they can be subject to slippage and whipsaw in volatile markets.
References
- https://www.robeco.com/en-int/insights/2024/10/the-formula-maximum-drawdown
- https://www.investopedia.com/terms/m/maximum-drawdown-mdd.asp
- https://www.wallstreetprep.com/knowledge/maximum-drawdown-mdd/
- https://www.morningstar.com/articles/understanding-maximum-drawdown-fund-analysis
- https://www.fundedplays.com
- https://www.quantt.co.uk/resources/maximum-drawdown-explained
- https://www.cmegroup.com/education/articles-and-reports/trailing-stop-orders.html
- https://www.finra.org/investors/insights/stop-loss-and-stop-limit-orders-use-caution
- https://papers.ssrn.com/sol3/papers.cfm?abstract_id=872398
- https://www.fundedplays.com/challenges
- https://www.fundedplays.com/blogs
- https://www.fundedplays.com/blogs/how-fundedplays-evaluations-work