
Quick answer and what this number means
TLDR probability band, mariners astros prediction
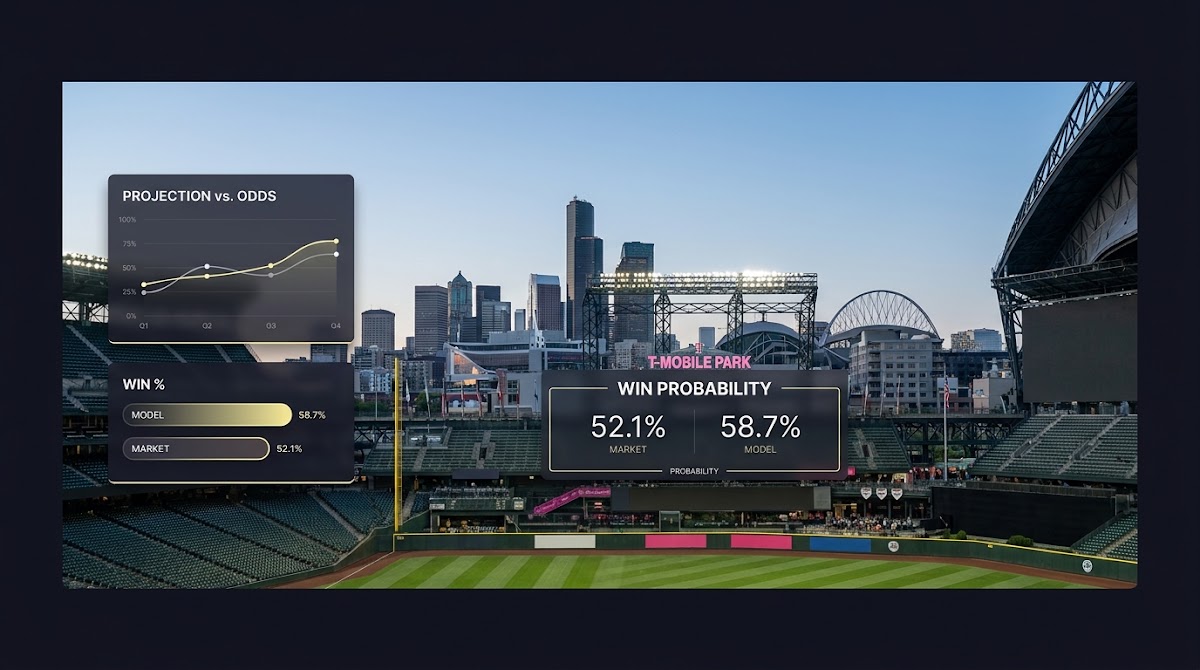
Short answer: using a simple triangulation of public futures prices and leading projection systems, the Seattle Mariners’ World Series chance in early 2026 sits in a single-digit to low-teens percentage band rather than as an outright favorite. This estimate reflects early-market futures prices that typically put the Mariners in a competitive mid-tier and converts those odds to an implied probability, while leaving room for model adjustments as the season unfolds. For a snapshot of market pricing that informs this band see the VegasInsider futures odds page VegasInsider futures odds
Why a range instead of a single number? Projection systems and markets each carry different, legitimate sources of uncertainty. Models embed injuries, depth-chart assumptions and Monte Carlo variance, while markets reflect supply and demand, public sentiment and betting liquidity. Presenting a band captures both model uncertainty and market movement rather than overclaiming precision.

This short estimate is not a guarantee. Probabilities update as player availability and performance data change, and the same framework that produced this band can be re-run with new FanGraphs or PECOTA updates to reflect in-season developments.
How World Series odds are calculated: models and markets
Overview of model building blocks
The modern approach uses player-level projections aggregated to a team depth chart to form expected runs scored and allowed, then converts those expectations into season outcomes through repeated simulation. FanGraphs documents that their Playoff Odds system projects runs, adjusts for schedule strength and runs many Monte Carlo season simulations to produce playoff and title probabilities, which is the backbone of many public model outputs FanGraphs Playoff Odds methodology. For live projections see the FanGraphs Playoff Odds page FanGraphs Playoff Odds
One practical consequence of this process is that small changes to projected run-scoring or run-allowing can shift playoff odds meaningfully after simulation, because the Monte Carlo engine translates those run expectations into win totals and knockout series outcomes. Models therefore spend a lot of effort on accurate depth-chart assignments and batter and pitcher projections.
A disciplined triangulation of early-2026 market futures and projection models places the Mariners' World Series chances in a single-digit to low-teens percentage band, subject to change with injuries and sustained performance trends.
How markets translate prices to implied probability
Markets express expectations as prices rather than probabilities, but it is straightforward to convert common futures formats into an implied chance by taking the reciprocal of decimal odds and then normalizing across outcomes if needed. Market prices can deviate from model outputs for several reasons: liquidity constraints, public narratives, or the presence of sharps and market makers trading on idiosyncratic information. Because the 2026 postseason uses a 12-team bracket with byes for top seeds, the path to a title involves multiple elimination rounds that markets implicitly price when setting futures odds; the structure of that bracket matters to how a season projection maps into a World Series probability MLB postseason format, explained
Market and model snapshot for the Mariners in early 2026
Public futures market picture
At the time of this early-season snapshot public futures boards place the Mariners in a competitive mid-tier with double-digit prices that correspond to a single-digit to low-teens percentage implied probability for a World Series win. Using market-implied conversion provides a baseline probability band to compare against model outputs VegasInsider futures odds

FanGraphs and PECOTA style projections often produce similar but not identical probability estimates because they differ in depth-chart handling and player projection inputs. FanGraphs' Playoff Odds run many season-level simulations from their projected runs and schedule strength, which generates a distribution of outcomes that can be summarized as a title probability FanGraphs Playoff Odds methodology
PECOTA uses player-level forecasts aggregated into team projections and then simulated seasons to arrive at playoff and championship odds, and it is useful to view PECOTA as a complementary model rather than a direct competitor when triangulating a probability range PECOTA introduction and FAQ. See PECOTA standings here
Practice triangulating model and market odds with virtual challenges
Compare model outputs and market prices each week to see how new injuries or a hot streak move the band.
Key inputs that move the Mariners' World Series chances
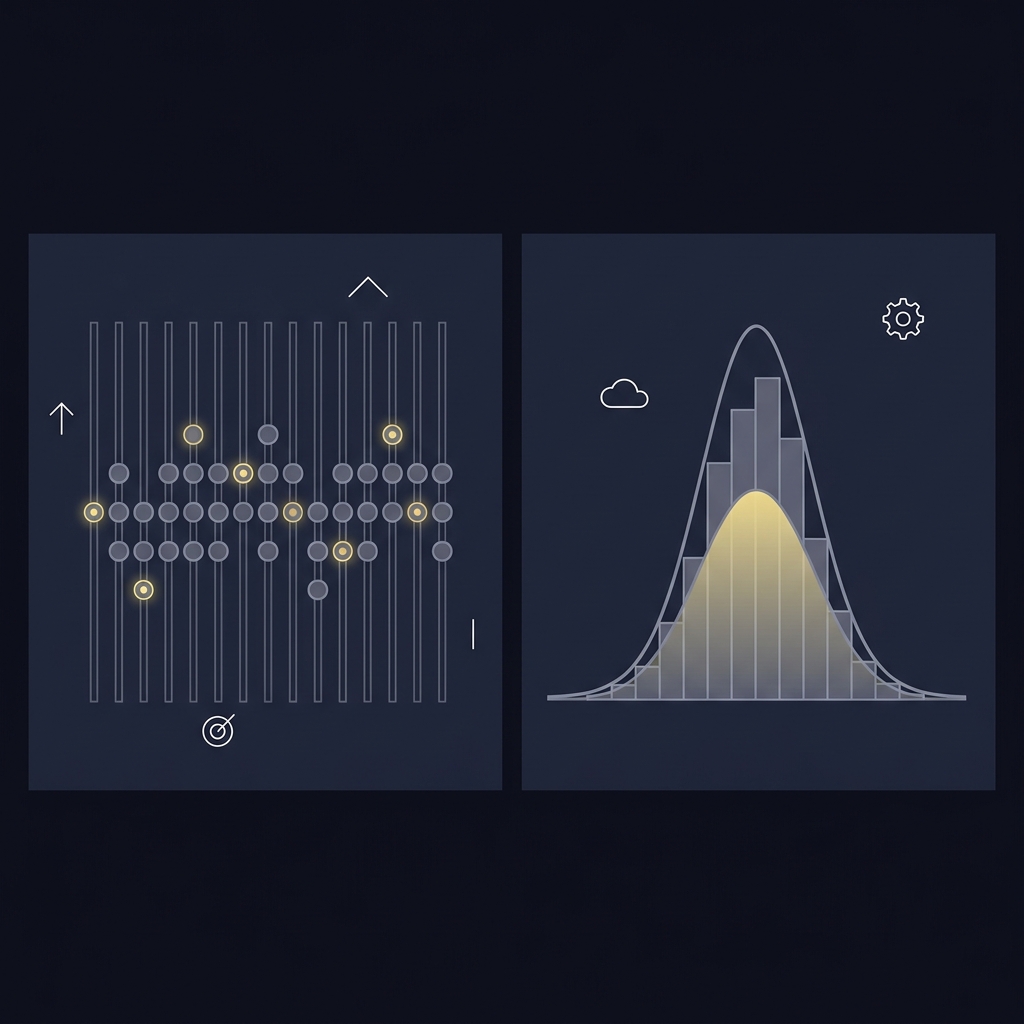
Health and roster availability
In-season injuries and roster availability are among the fastest-moving, high-impact inputs to projection systems and futures prices, because the loss or return of a regular starter changes both projected runs and perceived depth instantly. For up-to-date injury and roster status consult official IL and team reports, which materially influence both models and market pricing Seattle Mariners Injuries: current IL and roster status
Underlying performance: run-differential and BaseRuns
Run-differential and BaseRuns-style measures remain robust tools for isolating true team quality. These metrics strip away some of the randomness in win totals and provide a foundation for forecasting future runs scored and allowed, which models then convert to playoff and World Series probabilities BaseRuns primer

Schedule and matchup effects
Schedule strength and matchup sequencing are second-order but relevant adjustments in simulation-based systems: who you play and when affects win expectations across a season, and because the MLB postseason bracket requires multiple elimination steps, schedule-adjusted run expectations enter directly into a team’s simulated path to the World Series FanGraphs Playoff Odds methodology
A practical framework to triangulate a defensible Mariners probability
Step-by-step triangulation method
Step 1, gather the inputs: pull the latest FanGraphs Playoff Odds and PECOTA projections and a market-implied probability from public futures boards. Treat each as a noisy measurement of the same latent quantity. FanGraphs provides season-simulation outputs, PECOTA provides a complementary player-level projection set, and futures markets give the price that traders are accepting right now FanGraphs Playoff Odds methodology
Step 2, normalize to comparable probability units: convert market odds to implied probability, and take the percentage outputs from each model. If the inputs report different central measures, use the median or mean consistently to avoid mixing medians with means. One practical choice is to take the model point estimate and the market implied probability as three input points for a weighted average.
How to weight model outputs versus market prices
Step 3, choose weights: a sensible default is to give models and market each weight proportional to their typical information content. For example, you might weight FanGraphs 30 percent, PECOTA 30 percent and the market 40 percent when markets are liquid and no clear injury news exists. If there is a sudden roster change, increase the weight on the information source that captures it best, often the injury report or the model that updates depth charts fastest PECOTA introduction and FAQ (see evaluation guide).
Step 4, compute a weighted average and present a small range around it to capture model disagreement. Averaging tends to reduce overconfidence because it blends procedural errors and different assumptions rather than relying on a single engine.
Combine three probability inputs into a weighted probability
Adjust weights to taste
Step 5, report the result as a band and document the inputs and weights used. A transparent log of each update helps avoid hindsight bias and lets you see which inputs drove major swings in the estimate.
What head-to-head results against the Astros tell us
Matchup context versus structural team quality
Direct head-to-head records against the Houston Astros can inform specific matchup narratives but are generally less predictive than deeper indicators like run-differential and BaseRuns. Historical series results often reflect timing, rotation matchups and randomness that do not persist across a full playoff series, so treat head-to-head as context rather than a primary signal BaseRuns primer
When head-to-head matters and when it does not
Head-to-head matters most when it reveals repeatable, structural advantages such as an opponent’s weakness against a particular handedness or a recurring bullpen mismatch, or when a late-season head-to-head series carries clear playoff implications. In those situations, fold the evidence into your triangulation with modest weight rather than allowing it to dominate the estimate.
Common pitfalls when estimating World Series chances
Mistaking short runs for true talent
Small-sample swings in win totals can mislead; run-differential based measures like BaseRuns help correct for this by focusing on the underlying process generating runs rather than the noisy win column. Relying on raw wins early in the season risks overfitting to luck-driven streaks BaseRuns primer
Overreacting to market noise
Markets can move for reasons unrelated to underlying team quality, such as public narratives or large one-off bets. If you see a sharp market move without a clear, model-updating roster or health signal, pause and check whether models also move before updating your probability band VegasInsider futures odds
Rules of thumb to avoid common mistakes
Favor stable indicators like run-differential and depth-chart health over very short-term streaks. When in doubt, widen your probability band instead of tightening it; an honest wider range better reflects uncertainty than a narrow point estimate.
Practical scenarios: best case, base case, and worst case for the Mariners
Best case scenario and key triggers
Best case starts with roster health, above-expectation contributions from depth pieces, and sustained positive run-differential over a multimonth window. If model updates from both FanGraphs and PECOTA move strongly higher while markets follow, you could reasonably see the Mariners' title probability climb well above the initial mid-tier band, though any rise should remain conditional on sustaining those inputs FanGraphs Playoff Odds methodology
Base case probability band
The base case uses the early-season market baseline and the central model outputs to produce a defensible band that reflects agreement or disagreement between those sources. Using the triangulation approach described earlier yields a midpoint estimate plus or minus a few percentage points to capture model spread, which is a useful operational starting point for ongoing monitoring VegasInsider futures odds
Worst case scenario and warning signs
Worst case features sustained injuries to starters, a material negative swing in run-differential and depth that fails to cover missed innings. Those signals often produce rapid downward revisions in both model outputs and market prices; track injury reports closely since they are a common early-warning sign Seattle Mariners Injuries: current IL and roster status
Watch the weekly updates from FanGraphs Playoff Odds and PECOTA, monitor market futures for price moves, and track changes in run-differential trends and official injury reports. Those indicators together provide the data needed to re-run the triangulation and keep your probability band current FanGraphs Playoff Odds methodology and MLB coverage of PECOTA (see Funded Plays).
For most readers a cadence of weekly to biweekly updates is sensible during the season, or immediately after material roster news such as an IL move involving a starter. Keep a short log of inputs and weights so each update is transparent and reproducible PECOTA introduction and FAQ
They use similar building blocks but differ in player-projection inputs and depth-chart handling; FanGraphs emphasizes schedule-adjusted Monte Carlo simulations while PECOTA focuses on player-level forecasts aggregated to team outcomes.
Use both; markets provide a live price and models provide structured projections. Averaging them with sensible weights reduces overconfidence and captures different information sources.
Revise promptly if the injury affects a regular starter or rotation depth; update your triangulation inputs and widen the probability band to reflect uncertainty during recovery.
References
- https://www.vegasinsider.com/mlb/odds/futures/
- https://blogs.fangraphs.com/2024-playoff-odds-are-live/
- https://www.fangraphs.com/standings/playoff-odds/fg/mlb
- https://www.mlb.com/news/mlb-postseason-format-explained
- https://www.vegasinsider.com/mlb/odds/futures/
- https://www.baseballprospectus.com/pecota/
- https://www.baseballprospectus.com/standings/
- https://www.fundedplays.com/challenges
- https://www.mlb.com/mariners/injuries
- https://blogs.fangraphs.com/a-primer-on-baseruns/
- https://www.fundedplays.com/blogs
- https://www.fundedplays.com/blogs/how-fundedplays-evaluations-work
- https://www.fundedplays.com
- https://www.mlb.com/news/pecota-2026-mlb-projected-standings-and-playoff-odds