

Managing Risk Across Multiple Live Positions: Why portfolio-level thinking matters
When you are Managing Risk Across Multiple Live Positions, the risk story changes from individual trade odds to how those trades add up together. Looking at each position in isolation can understate the chance of large portfolio losses when positions move together, so it helps to think in aggregate and measure downside at the portfolio level.
Institutional frameworks embed portfolio aggregation for this reason, using measures that capture tail losses across correlated positions rather than summing standalone estimates. A practical consequence is to replace naive per-position checks with a routine that reports gross and net exposure, concentration, and a coherent tail metric each day Basel Committee report.
Download the live-portfolio daily checklist
Download or adapt the daily checklist in the workflow section to make this process routine and repeatable for your live positions.
Three readable ideas follow: quantify exposure, model correlation-aware tail loss, and enforce rules for sizing, hedging, and rebalancing so that no single market swing creates outsized portfolio damage.
What changes when you hold several live positions at once
Multiple live positions create two practical effects. First, gross exposure can be much larger than your net stake if many positions align in the same direction. Second, correlations between positions can fluctuate, meaning diversification that looked solid in calm markets may dissolve when stress arrives. Both effects make aggregate downside larger than simple per-trade sums suggest IMF Global Financial Stability Report.

Why single-position metrics can be misleading
A single-position risk measure like a per-trade loss limit does not capture the chance that several positions move against you at once. If positions share common drivers, their joint loss distribution will have fatter tails than implied by independent risk estimates. That is why aggregation and correlation-aware metrics are central to robust portfolio risk management ECB Financial Stability Review.
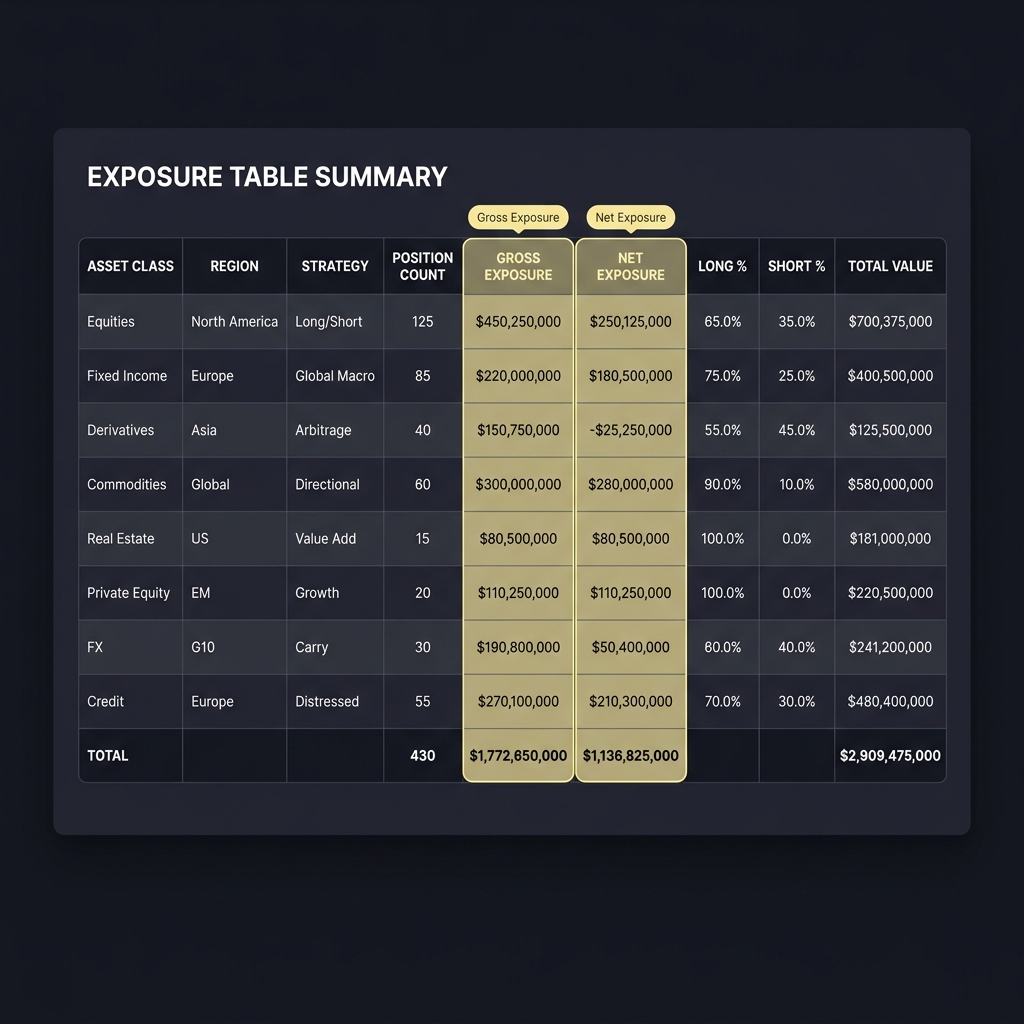
Gross exposure is the sum of absolute position sizes and shows how much nominal market exposure you hold across all trades. Net exposure is the algebraic sum that accounts for directional offsets. Tracking both helps you see where apparent neutrality masks large gross risk.
For example, three concurrent positions that offset some directions can still leave large gross exposure if the offsets are incomplete or become correlated under stress. Keeping a simple daily table of each position, its notional size, and sign gives a fast view of gross and net numbers.
Concentration limits are practical caps by underlying, sector, or correlated group. Set simple rules such as a maximum share of gross exposure per underlying or a cap on exposures within a sector to avoid single-source shocks producing outsized portfolio moves Basel Committee report.
Quick exposure calculation across three positions can be done with a small spreadsheet: list each position, its direction, and notional; compute gross as the sum of absolute notionals and net as the signed sum; then compute each position's percent of gross exposure to spot concentrations.
Managing Risk Across Multiple Live Positions: Expected Shortfall, VaR and portfolio tail risk
Expected Shortfall (ES) measures the average loss in the worst tail of the loss distribution and is preferred by many modern frameworks because it is coherent and aggregates sensibly across positions. ES captures the severity of tail events rather than just a cutoff point, which helps when you need to budget for large but plausible losses Basel Committee report. See a practical overview of stress-testing and expected shortfall Stress Testing & Scenario Analysis.
Value at Risk (VaR) still offers a simple, interpretable threshold: the loss level not expected to be exceeded with a given confidence. VaR is useful as a shorthand but can hide catastrophic outcomes beyond the threshold, so treat it as a complement rather than a substitute for ES.
Control aggregate exposure by measuring gross and net exposure, computing a coherent tail metric like Expected Shortfall, testing correlation stress scenarios, and enforcing rules for sizing, hedging, rebalancing, and escalation.
Model inputs matter: to compute portfolio ES you need a loss distribution for each position, a correlation matrix for how positions co-move, and a consistent time horizon. These inputs determine how sharply aggregated tail metrics will grow when positions become more correlated.
Modeling correlations and stress scenarios across positions
Correlations tend to rise in market stress, which reduces the benefit of diversification exactly when you need it most. The practical implication is that correlation estimates from calm periods understate joint downside in stressed markets, so scenario testing should include elevated correlation states IMF Global Financial Stability Report and guidance on stress testing Stress Testing in the Investment Process.
Start with two quick scenario tests. First, run a historical stress replay that applies past stress shocks to your positions to see portfolio outcomes. Second, run a correlation-shock scenario in which you increase pairwise correlations by a predefined amount and recompute ES to see sensitivity. For a practical how-to on stress replays see How to Stress Test Your Portfolio.
Use scenario outputs to set decision rules rather than as a single forecast. If a correlation-shock scenario doubles your ES, that scenario should trigger explicit actions such as reducing new position size, applying hedges, or raising the rebalancing frequency ECB Financial Stability Review.
Sizing positions and drawdown limits when Managing Risk Across Multiple Live Positions
Translate your portfolio risk budget into single-position sizes by allocating a share of permitted ES or drawdown to each position. Start with a clear portfolio drawdown limit, for example a percentage of equity you will not breach, and back out per-position notional sizes that keep the aggregated ES inside that limit.
Gross and net exposures matter because a neutral net position can still imply large gross risk. Size positions with an eye to gross exposure and concentration caps, not only on net balance, to avoid hidden risk accumulation. This means lower per-position caps for correlated groups and tighter limits where liquidity is thin.

Concentration triggers are simple rules that reduce new position size or require hedging when thresholds are breached. Examples include blocking new positions in an underlying if it exceeds a set percent of gross exposure, or requiring a hedging overlay when sector concentration rises above a trigger level.
Combine quantitative sizing with qualitative checks. Review position liquidity, recent correlation trends, and any upcoming events that could synchronise moves across positions before making new commitments.
Conditional hedging: options overlays and portfolio protection
Protective option overlays like puts or collars act as portfolio-level shields that cap tail losses in exchange for premium cost. A protective put provides downside insurance, while a collar limits losses and gains by pairing a put with a covered call. Both approaches reduce extreme loss risk but require paying premium or accepting capped upside Cboe Options Institute.
When applied at the portfolio level, size option hedges against aggregate exposure rather than hedging each position independently. That usually reduces cost and complexity because one overlay can protect many correlated positions, but the overlay must be carefully sized to match portfolio-wide risk.
Trade-offs are real: hedges carry an explicit carry cost and potential performance drag in calm markets. Use conditional hedging when scenario analysis shows material tail reduction per dollar of premium, and document the implementation plan to avoid ad hoc or panic hedging.
Rules-based rebalancing to support Managing Risk Across Multiple Live Positions
Rules-based rebalancing keeps total risk near target and prevents drift where winning positions grow and dominate exposure. Common triggers include time-based schedules, threshold rebalancing when weights shift by a set amount, and risk-budget based adjustments that restore ES allocation targets.
Implement rebalancing with attention to trade costs and platform constraints. Decide beforehand whether a threshold will trigger full or partial rebalancing and whether trades will be staggered to reduce execution impact. Evidence supports that consistent rebalancing helps stabilise risk over time Vanguard research.
Run daily ES and scenario checks for live portfolios
Use as an operational template
Practical choices include a monthly full rebalance with intra-month threshold checks, or a continuous risk-budget based approach where trades execute to restore target ES shares. Factor in taxes, fees, and platform constraints in the chosen cadence.
Monitoring liquidity and execution risk when multiple positions are open
Liquidity becomes more important when positions run concurrently because exits or hedges may be larger relative to market depth. Scarce liquidity in stress can widen bid-ask spreads and increase slippage, reducing the practical effectiveness of hedges and exits IMF Global Financial Stability Report.
Quick monitoring checks to add to live routines include current bid-ask spreads, visible market depth, and trade size as a percentage of average daily volume. Predefine execution protocols for larger exits including limit orders, staggered execution, or working with liquidity partners where available.
Stop-loss policies, coordinated exits and stop design
Design stop rules with a portfolio perspective: instead of isolated per-trade stops, track cumulative drawdown and let coordinated exits restore the portfolio to acceptable risk levels. This prevents simultaneous forced exits of correlated positions that can lock in larger losses.
Staggered or conditional exits are alternatives to identical stops across correlated positions. For example, a first stop may trim size while a deeper portfolio drawdown triggers broader reductions. Document stop logic and where possible backtest the rules on historical stress to see their practical behavior Basel Committee report.
Common mistakes when managing multiple live positions
Typical errors include relying on single-position metrics, summing independent risks, and ignoring correlation and liquidity dynamics. These mistakes often lead to underestimating true portfolio downside and taking inadequate protective measures during stress IMF Global Financial Stability Report.
Other frequent missteps are reactive hedging without predefined rules and allowing position drift to concentrate exposure. Corrective actions are straightforward: predefine hedging rules, use ES-based aggregation, set concentration controls, and rehearse execution plans so responses are measured not panicked.
A step-by-step workflow for live monitoring and risk control
Daily checklist, intraday refreshes, and escalation gates form the backbone of a live risk routine. Start the day by reporting gross and net exposure, concentration by group, and a refreshed ES estimate on the chosen horizon. Include quick liquidity checks for any positions scheduled for change.

If ES or concentration triggers breach limits, escalate to a decision gate: either tighten exposures through rebalancing, apply a conditional hedge, or execute coordinated exits depending on the documented rules. Make the escalation path explicit and limit ad hoc decisions.
Embed scenario analysis into the routine at a cadence that fits your activity level. Weekly or event-driven scenario replays that stress correlations help preempt large losses and should be part of the operational playbook Basel Committee report.
- Morning report: gross/net exposure, top concentrations, ES estimate.
- Pre-trade check: quick correlation and liquidity review before adding size.
- Trigger check: if ES or concentration exceeds threshold, follow escalation gates.
- Execution rule: prefer limit or staggered orders for large trades.
Practical examples and scenarios
Scenario 1, concentrated correlated move across three positions. Picture three positions with exposure to a single driver. A stress replay that raises correlations can show much larger portfolio losses than separate per-position checks. Use ES and scenario analysis to reveal this hidden vulnerability and to test whether a rebalancing or hedge action brings the portfolio back within limits Basel Committee report.
Scenario 2, applying a protective collar at the portfolio level. Suppose scenario analysis shows unacceptable tail loss but you wish to limit implementation cost. A collar sized to cover the bulk of aggregate exposure can cap losses while reducing premium outlay compared with buying puts across multiple positions. The trade-off is capped upside and some premium or carry cost, so document the expected drag and re-evaluate if market conditions change Cboe Options Institute.
Decision points to highlight: if ES falls within acceptable range after a hedge or rebalance, the operation worked. If not, escalate to deeper rebalancing or staged exits. Track outcomes to refine future triggers and sizing rules.
Decision criteria: choosing when to hedge, rebalance, or exit
Use explicit quantitative triggers such as ES breach, concentration trigger, correlation shock, or liquidity squeeze combined with implementation cost thresholds. If hedging cost is low relative to the reduction in ES per dollar of premium, hedging may be appropriate. If cost is high, prefer rebalancing or selective exits.
Qualitative judgment still matters. Consider upcoming events that could synchronise moves, market depth for potential exits, and operational limits on trading. Always document the rationale for hedges versus rebalances and review outcomes to improve future rules IMF Global Financial Stability Report.
Conclusion: building a coherent multi-position risk routine
Managing Risk Across Multiple Live Positions requires a consistent portfolio lens: quantify gross and net exposure, compute a coherent tail measure like Expected Shortfall, stress correlations, and enforce rules for sizing, hedging, and rebalancing. These steps reduce the chance that multiple concurrent positions create outsized losses when markets move together.
Start small with clear drawdown limits and a short daily checklist, then iterate by adding scenario analysis and conditional hedges as you learn how your positions behave under stress. Discipline in execution and documentation will make the routine sustainable and effective over time.
Expected Shortfall averages losses in the worst tail and captures severity beyond a cutoff, while VaR gives a threshold not expected to be exceeded at a chosen confidence level.
Consider options overlays when scenario testing shows material ES reduction per dollar of premium and when you can accept the premium cost or capped upside as part of the plan.
There is no single cadence; common approaches include monthly rebalances with intra-month threshold checks or continuous risk-budget adjustments, chosen based on trade costs and activity level.
References
- https://www.bis.org/bcbs/publ/d457.pdf
- https://www.imf.org/en/Publications/GFSR/Issues/2024/04/Global-Financial-Stability-Report-April-2024
- https://www.ecb.europa.eu/pub/financial-stability/fsr/html/index.en.html
- https://www.fundedplays.com/challenges
- https://www.cboe.com/learn/strategies/protective-put/
- https://institutional.vanguard.com/content/dam/inst/vanguard-has/insights/whitepapers/20_07_The_case_for_rebalancing.pdf
- https://ryanoconnellfinance.com/stress-testing-scenario-analysis/
- https://genesis-rm.com/blog/how-to-stress-test-your-portfolio
- https://www.msci.com/documents/10199/1637462/Stress_Testing_in_the_Investment_Process_Aug2010.pdf/b98c0ccd-b7bc-4ffc-b220-112fcdbe2130?version=1.0
- https://www.fundedplays.com
- https://www.fundedplays.com/blogs
- https://www.fundedplays.com/blogs/how-fundedplays-evaluations-work