
What the rulebook says and why umpire variability matters
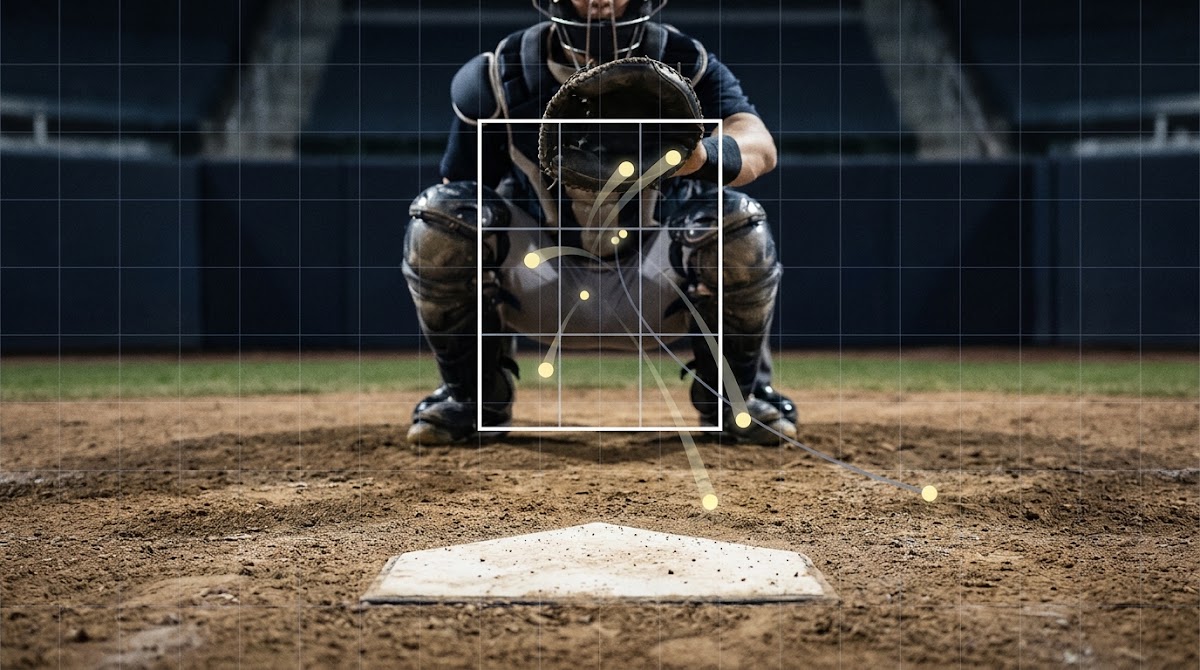
The Official Baseball Rules give a single formal description of the strike zone, a baseline that modelers use when comparing actual calls to a standard visual reference Official Baseball Rules.
In practice, however, how that zone is applied varies between umpires in consistent ways, and those differences can alter the run environment by shifting strike and ball calls at the edges of the zone; foundational analyses show measurable impacts on game outcomes when umpire fixed effects are included in scoring models Umpire strike zones and their impact on game outcomes.
To keep this discussion clear, define three terms we will use repeatedly: an edge called-strike is a strike called on a pitch near the border of the rulebook zone; zone width refers to a tendency to call strikes wider or narrower than the rulebook width; and K% and BB% are strikeout rate and walk rate respectively, the two primary pathways by which called-ball and -strike patterns change expected runs.
Statcast records the spatial data for every pitch, mapping each delivery against a rulebook baseline so analysts can compute where calls depart from the official zone. That pitch-level positioning is the raw input many public dashboards use to quantify per-umpire deviations from the rulebook baseline.

Public methodologies build on that tracking to summarize umpire behavior. One widely used approach creates metrics for accuracy, consistency, and estimated run impact by comparing calls to Statcast-measured locations and quantifying how edge calls shift outcomes over time Methodology: How Umpire Scorecards Quantifies Accuracy and Run Impact. You can also explore the Umpire Scorecards site for raw data and dashboards Umpire Scorecards.
Common, model-ready metrics include an edge called-strike rate, which isolates strikes on borderline pitches; measures of zone width and height to show directional bias; and a per-umpire run impact estimate that converts calling patterns into expected runs allowed or saved. These are the core numbers many modelers pull to incorporate umpire effects into totals adjustments.
quick data collection checklist for umpire analysis
Use with Statcast and Umpire Scorecards dashboards
Edge called strikes do two practical things. First, they push hitters into more two-strike counts and create more chase opportunities, which tends to increase strikeout rates. Analytics guides explain how altered chase and two-strike dynamics translate into higher K% when umpires reward pitches at the border Plate Discipline and the Strike Zone. Additional analysis of umpire accuracy trends is available from other public writeups Umpire accuracy update.
Second, when an umpire calls fewer strikes on the edges, more borderline pitches are taken as balls, which raises BB% and increases baserunners and run expectancy for those plate appearances. The same analytical resources show how plate-discipline shifts in called strikes and balls move walk rates and therefore baserunner counts.

Because K% and BB% feed into run-scoring models, small but persistent changes in those rates from umpire behavior can cascade into meaningful adjustments of projected totals; modelers often translate expected K% and BB% shifts into run equivalents using conversion tables or run models built on play-by-play data. See how Funded Plays approaches evaluations in our write-up how Funded Plays evaluations work.
Mechanics: how edge calls change K%, BB% and expected runs
Edge called strikes do two practical things. First, they push hitters into more two-strike counts and create more chase opportunities, which tends to increase strikeout rates. Analytics guides explain how altered chase and two-strike dynamics translate into higher K% when umpires reward pitches at the border Plate Discipline and the Strike Zone.
Second, when an umpire calls fewer strikes on the edges, more borderline pitches are taken as balls, which raises BB% and increases baserunners and run expectancy for those plate appearances. The same analytical resources show how plate-discipline shifts in called strikes and balls move walk rates and therefore baserunner counts.
Because K% and BB% feed into run-scoring models, small but persistent changes in those rates from umpire behavior can cascade into meaningful adjustments of projected totals; modelers often translate expected K% and BB% shifts into run equivalents using conversion tables or run models built on play-by-play data.
Mechanics subnote: edge calls, counts, and sequencing
Edge calls also affect pitch-sequence dynamics. A called strike on pitch one or two changes hitter approach for subsequent pitches, making chase strikes more likely later in the at-bat and reinforcing strikeout pathways without changing pitcher talent. This sequencing effect is part of why even modest edge biases can matter beyond a single plate appearance.
A practical framework to incorporate umpire tendencies into totals models
Step 1, identify the assignment: before any math, confirm which umpire will work home plate and pull their historical edge metrics across an appropriate sample period, using both accuracy and consistency measures to judge reliability.
Step 2, convert umpire metrics to expected K% and BB% shifts by mapping edge called-strike rate and zone width tendencies to the same plate-discipline measures used by your run model; many modelers prefer short, stable multipliers rather than one-off conversions to limit overfitting Methodology: How Umpire Scorecards Quantifies Accuracy and Run Impact.
Practice conservative umpire adjustments with a checklist
Try a conservative umpire adjustment checklist on your next projection: verify the assignment, check edge-call consistency, and scale any K% or BB% shift conservatively before combining with park and weather.
Step 3, translate K% and BB% shifts into runs using your chosen run conversion. This can be a simple lookup table from historical plate-level data or a more complex run expectancy model; the key is to apply the same conversion consistently and to test it on a holdout sample when possible.
Step 4, integrate the umpire-derived run delta with park, weather, and matchup signals rather than replacing them. Treat the umpire number as an additive input and weight it relative to other stable factors. For additional model notes and related posts see our blog index Funded Plays blog.
Step 5, scale conservatively. Reserve the largest adjustments for umpires whose edge metrics and run impact estimates consistently exceed typical variance across multiple seasons and sample windows.
Decision criteria: when to adjust totals and how large an adjustment to make
Thresholds for action should rest on two dimensions: effect size and reliability. Only consider nontrivial adjustments when an umpire’s edge-call rate and run-impact estimate consistently exceed expected variance for your chosen sample window Methodology: How Umpire Scorecards Quantifies Accuracy and Run Impact.
For marginal cases there are three conservative options: partially scale the adjustment, add a hedged exposure rather than a full stake, or do not adjust and monitor in-play data for live opportunities to exploit a developing pattern.
Confirm the home-plate umpire assignment, pull stable edge-call metrics, convert those to expected K% and BB% shifts, translate to a run delta using your run model, and then scale and combine that delta conservatively with park and weather factors while monitoring sample size and consistency.
Small sample sizes are the most common source of error: an unusual month or a hot streak can create illusions of an umpire effect that vanish when more data are added. When sample size is limited, prefer partial scaling, cross-validation with holdout games, or avoiding dependence on an umpire signal until more data accumulate How to Use MLB Umpires to Bet Totals (2024 Guide).
How Umpire Tendencies Affect MLB Totals
One practical decision rule is to set a minimum historical period and number of borderline pitches observed before applying a full adjustment; if either threshold is unmet, scale back the effect or defer to in-play adjustment strategies.
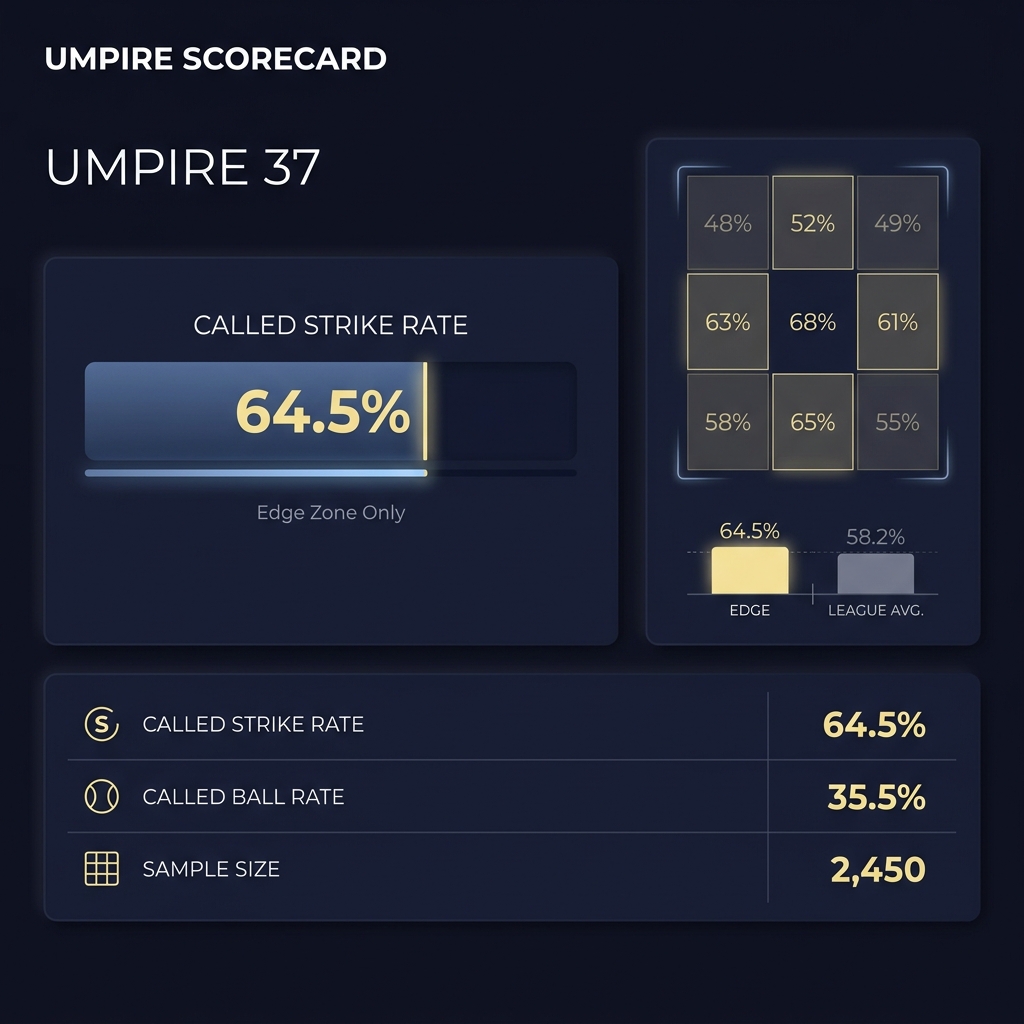
One practical decision rule is to set a minimum historical period and number of borderline pitches observed before applying a full adjustment; if either threshold is unmet, scale back the effect or defer to in-play adjustment strategies.
Common mistakes and pitfalls when using umpire data
Overreacting to single-game data is a frequent error. A single blown zone in one game does not establish a pattern; modelers should require multi-game confirmation before altering totals materially Methodology: How Umpire Scorecards Quantifies Accuracy and Run Impact.
Confusing accuracy with consistency is another trap. An umpire can be accurate relative to the rulebook over a season yet inconsistent in how they apply the zone game to game, which weakens the predictive value of a single-season average and suggests more conservative scaling or additional stability checks.
Ignoring matchup and contextual variables that interact with umpire behavior reduces model quality. Park factors and weather remain primary drivers of run environments, and umpire signals should be blended, not substituted, for these established inputs How to Use MLB Umpires to Bet Totals (2024 Guide).
Practical scenarios: reading an assignment and adjusting a projected total
Scenario A, narrative first: suppose an assignment shows a known extreme edge-caller working behind the plate at a hitter-friendly park. The modeler first confirms the umpire’s historical edge metrics and consistency, then maps the expected K%/BB% shift to a run delta, and finally blends that delta with the park factor to decide whether to move the published total.
In that scenario the checklist is: verify assignment, confirm multi-season consistency, convert edge rate to K%/BB% shifts, translate to runs with your model, then scale the change relative to park and weather. Guidance published for bettors recommends reserving larger bets for cases where umpire metrics are extreme and robust across samples How to Use MLB Umpires to Bet Totals (2024 Guide).
Scenario B, narrative second: a neutral umpire is assigned and weather forecasts suggest a high-run environment. In that case the umpire signal is weak, so the prudent action is to let park and weather dominate the adjustment while keeping the umpire input as a marginal modifier that you can monitor during live play.
For borderline assignments, partial scaling is a practical approach: apply half of the modeled run delta, place smaller exposure, or use hedged positions to reduce sensitivity to potentially noisy umpire signals. Always track outcomes to refine future scaling rules.
What automation and ABS could change for umpire effects
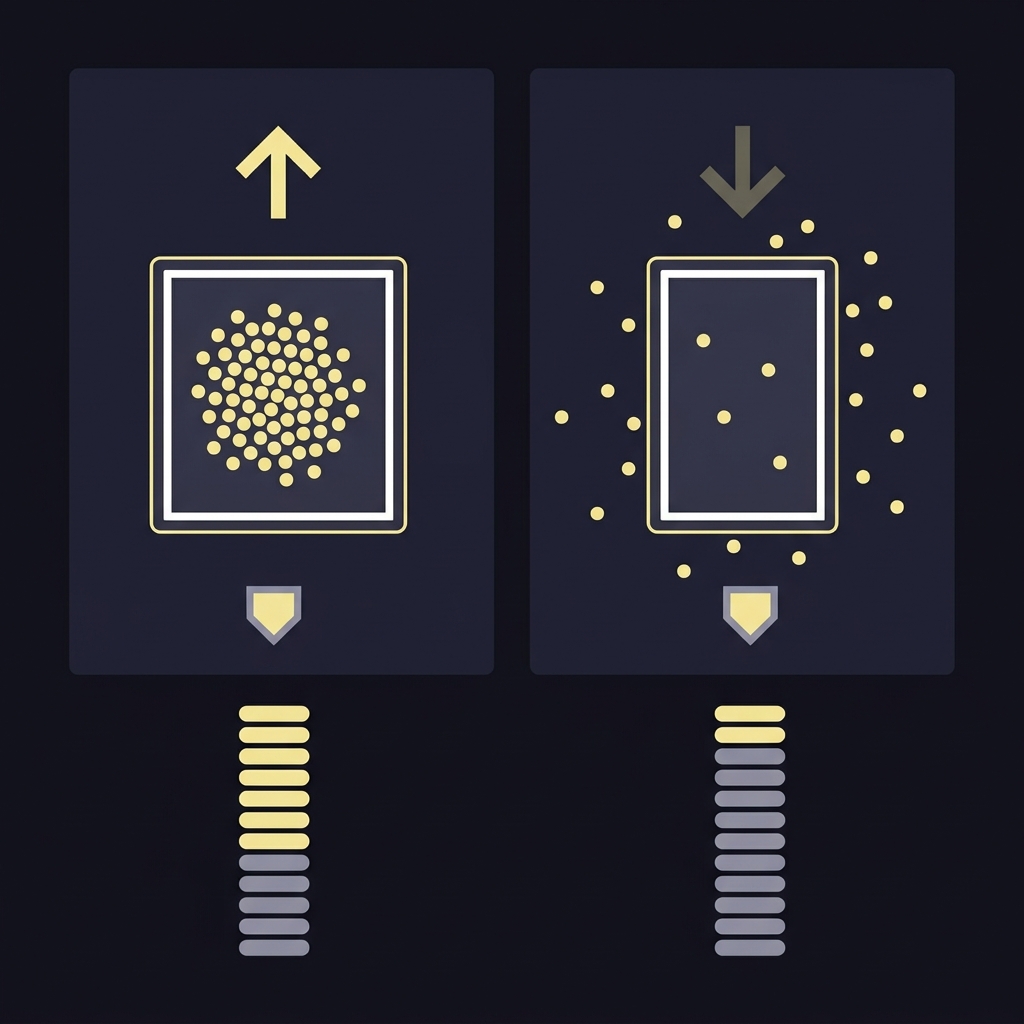
Triple-A testing of an Automated Ball-Strike challenge system in 2024 suggests the potential for narrower per-umpire variance if such systems are broadly adopted, which would reduce the size of extreme individual umpire effects on called zones ABS challenge system returns to Triple-A for 2024 season. Reporting on related evaluation changes is available from broader coverage of umpire oversight coverage of MLB evaluation changes.
If automation were adopted at scale, modelers would likely see smaller umpire fixed effects and more stable conversions from K% and BB% shifts to runs, but until any MLB-wide rollout is confirmed it remains sensible to include per-umpire inputs in short-term totals modeling and to monitor developments closely.
Conclusion and concise checklist for making responsible adjustments
Umpire variations are measurable and can alter K% and BB% in ways that matter for run totals; modern Statcast-based dashboards and scorecards let modelers convert those patterns into run-impact estimates for inclusion in totals projections Plate Discipline and the Strike Zone.
Quick checklist: verify the assignment, confirm consistency and adequate sample size, and scale any adjustment conservatively while combining it with park and weather inputs; continue monitoring ABS developments since automation could change the long-term role of human umpire signals ABS challenge system returns to Triple-A for 2024 season.
Umpire effects vary, but measurable edge-call tendencies can shift K% and BB% enough to justify conservative adjustments; the exact impact depends on consistency and sample size.
Public dashboards that use Statcast data, including Umpire Scorecards, provide edge called-strike rates, zone tendency measures, and run-impact estimates modelers can use.
If MLB adopts automated ball-strike systems broadly, extreme per-umpire variance would likely fall, but modelers should monitor adoption before changing long-term model structure.