
What counts as a turnover in the NFL and why the definition matters
Official rule definition
Under the league's official rules, the set of events considered turnovers is narrow and clear: an interception or an opponent-recovered fumble is recorded as a turnover, and that definition drives how teams and analysts count takeaways and giveaways in every game. For clarity on the formal language and consistent event definitions, refer to the published NFL rule text, which sets the baseline for all statistical tracking and analysis NFL rulebook.
Treat fumble recoveries as approximately 50/50 in small samples and regress interception rates toward career or league baselines, using turnover-worthy play metrics as priors; blend observed counts with those priors using weights tied to sample size and corroborating process evidence.
How turnover differential is recorded and used
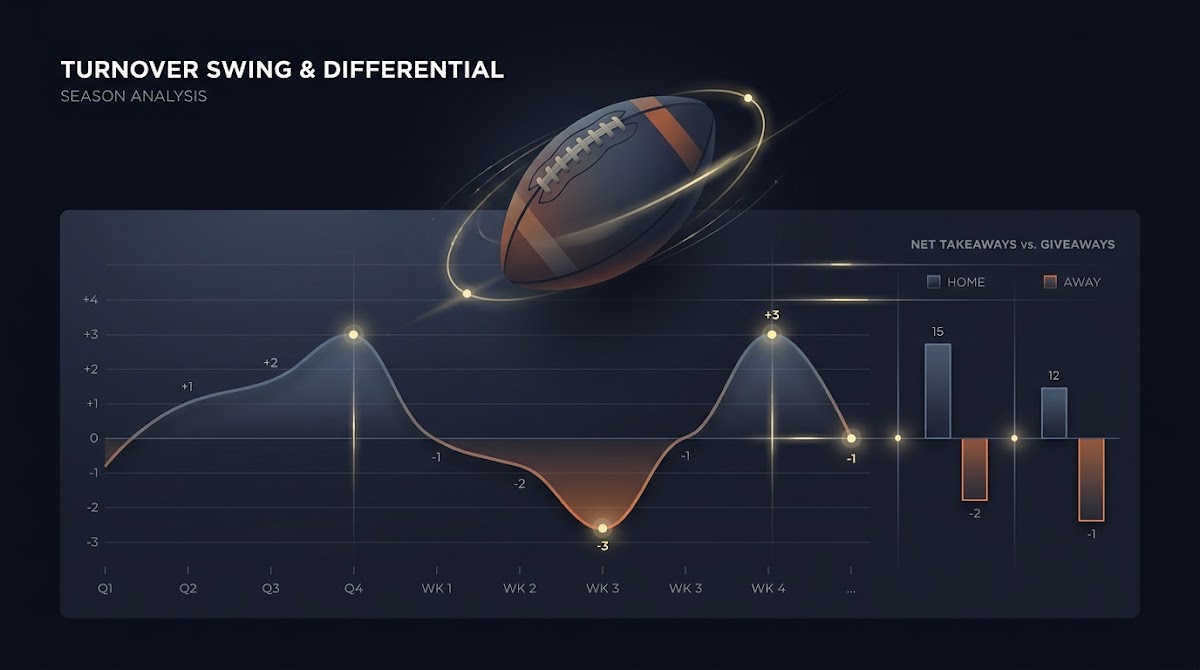
Turnover differential is simply takeaways minus giveaways, reported at the game level and aggregated across a season to summarize how often a team comes out ahead or behind in turnover exchanges. That differential is the common shorthand analysts use when discussing how turnovers influence win probability and season records, because it compresses the asymmetric impact of takeaways and giveaways into a single number.
Understanding the formal definition matters because analytics rely on a consistent event set: if you include recovery luck or special teams fumble nuances inconsistently, your comparisons across teams or weeks become noisy and harder to interpret. The league's record compilations demonstrate that turnover differential is a standard comparative statistic for teams and seasons NFL Record & Fact Book. For team-level season summaries and per-game turnover margin data see the turnover margin per game listings on TeamRankings.
How turnover luck shows up in single games and short samples
One-score games and variance
Turnover events are particularly influential in one-score games because a single interception return or sudden fumble recovery can swing expected points dramatically; consequently, short samples of games often produce misleading signals about a team's underlying quality. When analysts look at a single-week result, the turnover split can dominate the narrative even when it is largely driven by a single stochastic bounce.
Why a few plays can swing results
It helps to picture turnovers as low-frequency, high-impact events. In a short stretch of games, a pair of unusually favorable fumble recoveries or a lucky interception return can convert marginal losses into wins, creating an outsized impression of team strength that may not hold when the sample grows. That short-run volatility is one reason to be cautious in attributing skill to outcomes produced by limited events, as league records show a strong game-level association but not guaranteed persistence NFL Record & Fact Book.
Fumble recoveries are mostly random: what the evidence says
Recovery probabilities and lack of persistence
The best practical summary from several empirical examinations is that fumble recoveries behave much like roughly 50/50 events: the ball bounces, players wrestle, and the eventual recovery outcome exhibits little team-level persistence, so season-to-season fumble edges tend to wash out unless supported by process evidence. Analysts frequently treat raw fumble recovery records as noisy and apply strong regression toward a 50% baseline when forecasting FiveThirtyEight analysis of fumble recoveries and related examinations such as Examining Luck in NFL Turnovers.
Because recovery outcomes are close to coin flips, models that accept a team's raw fumble recovery percentage at face value risk overfitting. Practical forecasting responds by normalizing fumble recovery inputs toward a 50% expectation unless there is repeated, observable evidence to suggest a true deviation.

Apply the turnover normalization framework in a structured challenge
Apply the normalization rule to short samples: treat fumble recoveries as coin-flip outcomes unless you can document a persistent process that explains an edge.
That normalization is straightforward to implement in a weekly model and reduces the influence of lucky stretches on projected win probability and season records.
Interceptions: separating repeatable skill from noisy totals
Why raw interception counts can mislead
Interceptions include both demonstrable skill components and a substantial random component; raw interception totals often fluctuate year to year, which makes them a poor standalone measure of a quarterback's mistake rate or a defense's ball-hawking ability. Analysts looking at interception totals should remember that year-to-year variation is common and that raw counts can mislead if used without adjustment.
Turnover-worthy plays as a more stable metric
A more stable approach is to track turnover-worthy plays, which attempt to capture the underlying situations where a turnover was likely (for example, poorly thrown balls, loose handoffs in chaotic traffic, or throws into tight coverage). When available, turnover-worthy play metrics give a better read on repeatable quarterback or offensive risk-taking behavior because they separate the opportunity set from the recovered outcome PFF on turnover-worthy plays.
For modelers, the tradeoff is clear: use turnover-worthy play tagging to estimate a baseline interception risk, then blend that with observed interception outcomes to form a regression-adjusted forecast rather than treating raw interception counts as the final word.
Turnover differential and winning: the observed relationship
League-level correlations
Across games and seasons, teams that win the turnover battle do win a larger share of contests; this association is robust in league compilations and is a staple of descriptive analysis. The correlation between turnover differential and win percentage is one reason analysts often report turnover margin as a key explanatory variable when recounting season outcomes NFL Record & Fact Book.
Why correlation is not persistence
However, the existence of a strong correlation at the game and season level does not mean extreme turnover margins are a permanent team characteristic. Correlation identifies an association for the period measured but does not imply that teams with extreme differentials will keep that gap; season-to-season regression is common and expected.
That distinction matters when projecting future records: a team that has benefited from a large turnover margin in one season should not be assumed to retain the same advantage the next year without corroborating evidence of a real process advantage such as a consistently disruptive scheme or demonstrable personnel advantage.

Why extreme turnover margins tend to regress from season to season
Persistence analysis and expected regression
Empirical studies of turnover persistence demonstrate that season-to-season turnover margins regress markedly: teams with extreme positive or negative differentials typically move back toward league averages, especially when fumble recovery luck is a substantial component of the observed edge. This pattern appears in multiple analyses that separate recoveries from opportunity metrics How to predict NFL turnovers and in machine-learning efforts that explore predictability Empirical Prediction of Turnovers.
Sources of regression: randomness vs role changes
Regression comes from a combination of pure randomness, especially on fumble recoveries, and structural changes such as shrinking play-sample noise, opponent adjustments, or personnel turnover. That mix means that a big turnover season should prompt a cautious adjustment to valuations rather than an uncritical upgrade in team quality.
A practical forecasting framework for adjusting turnover luck
Normalize fumble recoveries
Step 1: When sample sizes are small, normalize observed fumble recovery percentages toward 50%. Treat raw recovery ratios as noisy and shrink them aggressively toward the 50% baseline unless you have multi-season or process-level evidence to justify weaker shrinkage.
Regress interception rates toward baselines
Step 2: For interceptions, blend observed interception rates with career or league baselines. If turnover-worthy play metrics are available, use them to set a prior for expected interception risk and apply Bayesian shrinkage toward that prior.
Combining adjustments into model inputs

Step 3: Combine the normalized fumble expectation and the regression-adjusted interception risk into a single turnover expectation for your model inputs. Use weighted blending where weight on observed counts increases with sample size and corroborating signals.
Numbered steps, summarised:
- Normalize fumble recoveries toward 50% when sample sizes are small.
- Shrink interception rates toward a career or league prior, using turnover-worthy plays if available.
- Blend the two adjusted components into a composite turnover expectation, with weights tied to sample size and process evidence.
Quick model checklist to apply turnover normalization rules
Use as a spreadsheet checklist
Use a simple spreadsheet template to track the inputs, priors, and final blended turnover expectation week by week; the template helps with transparency and repeatability when applying the normalization rules. See the Funded Plays blog for model documentation and examples.
Decision criteria: when to treat turnover splits as meaningful
Sample size thresholds
Adopt minimum sample thresholds before treating observed turnover edges as skill: a few games are not enough. A conservative rule is to require multiple-game samples or season-level repetition plus supporting process indicators before giving observed turnover margins heavy weight in season projections.
Contextual signals that indicate skill
Contextual signals that increase confidence include repeated forced fumbles by the same defenders, systematic scheme tendencies that produce turnover-worthy situations, or consistent quarterback decision patterns that produce a higher rate of turnover-worthy plays. When those process signals appear consistently, downweighting is less necessary because you have direct evidence of a repeatable mechanism PFF on turnover-worthy plays.
When process indicators are absent, favor shrinkage and conservatism in projections: treat turnover splits as likely temporary unless corroborated by further data.
Common mistakes and traps when interpreting turnover data
Overfitting to a short run of turnovers
A frequent error is to adjust lines or season expectations aggressively after a short hot or cold streak of turnover outcomes. Because fumble recoveries and some interception outcomes contain large random components, such adjustments typically overreact and degrade forecasting accuracy.
Confusing correlation with causation
Analysts also sometimes interpret the strong correlation between turnover margin and wins as a causal guarantee and then attribute wins or losses primarily to luck or skill depending on the observed split. That confuses descriptive association with predictive persistence and can mislead roster or coaching evaluations; treat correlation as a guide but seek process validation before changing long-term assessments Analysis on turnover randomness.
Examples and scenarios: applying the adjustments to real games
Short-case: week-to-week line adjustment
Scenario: A team won last week on two recovered fumbles and one interception return. Before taking a stronger position on the team in next week's line, regress last week's fumble recovery outcomes toward 50% and blend the interception observation with the quarterback's turnover-worthy play rate rather than taking the raw turnover margin at face value. Doing so reduces the influence of what may have been a lucky stretch on the public line.
Season-case: projecting record after an outlier turnover season
Scenario: After a season with an extreme +14 turnover margin, project next season's margin by shrinking the observed value substantially toward league average and by examining whether forced turnover mechanisms were consistent. If forced fumbles and turnover-worthy play rates did not support the edge, attribute most of the margin to regression when estimating likely next-season records Method for predicting turnover regression.
Trackable metrics to update during the season include turnover-worthy play rates, forced fumble counts by defender, and changes in coaching or scheme that would plausibly alter turnover generation; these signals let you reduce the chance of mistaking luck for repeatable advantage.
How to measure and track turnover-worthy plays in your model
Data sources and tagging plays
Start with play-by-play feeds and, where available, third-party tags that identify turnover-worthy situations. Tagging should capture the pre-recovery event characteristics that increase turnover likelihood: poor throws into tight coverage, high-contact runs with loose ball indicators, and plays with contested receptions.
Integrating play-level indicators into team metrics
Aggregate tagged plays into rates per attempt or per offensive play, and use those rates as priors for expected interception risk rather than raw interception counts. This approach yields a more stable input for regression because it separates opportunity from final outcome PFF on turnover-worthy plays.
Long-term implications for team evaluation and roster decisions
How turnover luck affects perceived team value
Extreme turnover seasons can distort evaluations of coaching and personnel if decision-makers treat the observed edge as a skill signal without adjustment. For example, relying on a single-season turnover differential to justify major roster or cap moves risks overvaluing what may be temporary luck.
Using adjusted turnover views in scouting and planning
By contrast, adjusted turnover metrics that normalize recoveries and regress interception counts produce more stable inputs for scouting, contract decisions, and long-range planning. They help separate sustainable skill from episodic fortune, though analysts should continue to monitor forced fumble skill and ball-hawking roles as open empirical questions that merit ongoing observation Study on turnover persistence. For practical model templates and documentation see how-fundedplays-evaluations-work and the site blog.
Key takeaways and a short checklist for bettors and analysts
How Turnover Luck Affects NFL Results
One-paragraph summary: Turnover luck matters a great deal in single games and short samples, especially because fumble recoveries are approximately coin flips, while interceptions mix skill and noise. Winning the turnover battle correlates strongly with wins, but extreme margins usually regress. Apply normalization for fumbles and regression toward career or league baselines for interceptions, and give weight to turnover-worthy play metrics when available.
Actionable checklist
Checklist for application: normalize fumbles toward 50% in short samples; shrink interception rates toward priors, preferably using turnover-worthy plays; require corroborating process signals before treating an edge as repeatable; and document your priors and blending weights in a model template to ensure transparent adjustments. These practical steps help avoid overreacting to short-run turnover noise Turnover prediction guidance. For additional resources see the Funded Plays homepage.
A turnover is recorded when the offense loses possession via an interception or an opponent-recovered fumble; turnover differential is takeaways minus giveaways.
Yes for small samples: shrinkage toward a 50% baseline is appropriate unless multi-season or process-level evidence suggests a genuine deviation.
Yes, turnover-worthy play metrics help separate opportunity from outcome and provide a more stable indicator of repeatable interception or mistake risk.
References
- https://operations.nfl.com/the-rules/2024-nfl-rulebook/
- https://operations.nfl.com/football-ops/nfl-record-and-fact-book/
- https://www.teamrankings.com/nfl/stat/turnover-margin-per-game
- https://fivethirtyeight.com/features/fumble-recoveries-are-random/
- https://harvardsportsanalysis.org/2014/10/how-random-are-turnovers/
- https://www.pff.com/news/nfl-what-are-turnover-worthy-plays
- https://thepowerrank.com/2015/09/03/how-to-predict-nfl-turnovers/
- https://pmc.ncbi.nlm.nih.gov/articles/PMC5969004/
- https://statsbylopez.com/2018/10/24/are-nfl-turnovers-mostly-random/
- https://www.fundedplays.com/challenges
- https://www.fundedplays.com
- https://www.fundedplays.com/blogs
- https://www.fundedplays.com/blogs/how-fundedplays-evaluations-work