
What return on investment (ROI) really means
The simple ROI formula and how to read it
At its simplest, ROI is a ratio comparing what you gained to what you spent. The common formula is (Gain − Cost) ÷ Cost and results are usually expressed as a percentage. This simple ratio is useful because it reduces an outcome to a single, comparable number, but readers should treat that number as a starting point not a final decision metric, because the formula does not show timing, attribution or uncertainty. For a clear primer on the formula and typical use cases, see the Investopedia ROI guide Investopedia ROI guide.
Reading the formula well means translating it into the business context: what counts as gain, and what counts as cost. Net gain can be revenue, value of leads, retained customers valued by a lifetime proxy, or any agreed benefit measure. Cost can include media, creative and production, labor, tooling and third-party fees. A number produced without explicit definitions of the numerator and denominator is easy to misinterpret.
Why time horizon and cost scope matter
Two common mistakes undermine the numeric value of ROI: unclear time horizons and inconsistent cost scope. The same campaign can look excellent if you count only first-week revenue, or mediocre if you include recurring revenue recognized over a year. Similarly, excluding labor or tool costs can overstate returns. To make ROI decision-quality, always state the evaluation window and list which cost components were included.
There is also a difference between nominal ROI and incrementality-aware ROI. Nominal ROI applies the basic formula to observed revenue and costs. Incrementality-aware ROI adjusts the numerator for what would have occurred without the activity, often via tests or models. Treat the simple ratio as a diagnostic that points to where incrementality checks are needed.
Start right: define objectives, KPIs and the evaluation window
How to set measurable objectives
Begin every initiative with a short statement of objectives and measurable KPIs. A clear objective might be to increase trial signups by 15 percent over three months, or to improve average revenue per user by a defined dollar amount over six months. Stating objectives at kickoff creates a shared success definition and makes later ROI calculations auditable and comparable across phases. Project management guidance recommends this practice to improve benefits realization and to enable consistent tracking across project phases, as outlined by the Project Management Institute Project Management Institute guidance.
Turn objectives into one-line KPIs mapped to the eventual ROI numerator. Examples: expected incremental revenue, number of qualified leads with an estimated lifetime value, or a proxy like trial-to-paid conversion multiplied by average contract value. Capture how you will recognize revenue over time so revenue timing is transparent. Documenting these choices up front avoids later reinterpretation that can make ROI numbers irreproducible.
Checklist step 1: name the objective. Step 2: pick one primary KPI and up to three supporting KPIs. Step 3: agree the evaluation window and revenue recognition rule. These concrete actions shorten review cycles and reduce rework when analysts later reconcile costs and outcomes.
Standardize KPIs and evaluation windows
Copy this KPI checklist into your kickoff notes: objective, primary KPI, supporting KPIs, evaluation window, revenue recognition rule.
Choosing KPIs and matching them to ROI
Choose KPIs that map cleanly to money where possible, because ROI compares gain to cost. When money is not immediately measurable, use credible proxies and describe the conversion from proxy to monetary value. For example, use average lifetime value to convert new customer counts into a revenue proxy. When proxies are used, include conservative assumptions and a sensitivity range so decision makers can see how assumptions affect ROI.
For teams tracking many activities, prioritize KPIs that are auditable from raw sources such as CRM records or billing systems. Avoid KPIs that need heavy manual estimation unless manual steps are explicitly documented and scheduled for review. The goal is reproducibility: another analyst should be able to rerun the calculation from the inputs and get the same result.

Assemble cost categories before you compute anything. Typical items to include are media spend, creative and production costs, labor, tooling and third-party fees. Decide whether to include fixed overhead or only incremental costs. Exclude sunk costs and clearly state exclusions so reviewers know which line items were intentionally left out. The basic ROI calculation depends on cleanly defined cost boundaries.
When different teams report costs in different currencies, time zones or invoice cycles, standardize to a single baseline. Use the same time window you selected for outcomes and convert currencies or amortize multi-month invoices so costs align with the evaluation window. These baseline choices should be written into the assumptions log for auditability.
Reconciliation is a step-by-step process: align time windows, pull raw exports from sources, deduplicate events, and reconcile totals to finance or billing records. Common sources are ad platforms, analytics exports, CRM systems and finance ledgers. Automating extracts and checks reduces manual errors and speeds repeatable reporting. Guidance on building reproducible reports and dashboards can help teams centralize and share these reconciled views Build and share reports in Looker Studio.
Practical reconciliation steps start with a mapping table that links each outcome metric to its raw data source, a note explaining any transformations, and a reconciliation cell that compares the transformed metric to the finance number. Where numbers disagree, record a reason and remediation steps so the issue is fixed before it reaches decision makers.

Attribution and incrementality: making ROI decision-ready
When simple attribution is enough and when to test for incrementality
Standard user-level attribution can be useful for quick diagnostics but becomes less reliable as privacy changes limit identifier continuity. When attribution is likely to overstate impact, plan an incrementality check to measure the portion of observed gain that is causally linked to the activity. Industry research in 2025 highlights combining experiments and modeling as a way to improve confidence in incremental estimates as user-level signals become constrained Nielsen ROI Report 2025.
Decide whether to run a holdout or another experiment based on the expected effect size, cost of running the experiment, and the campaign timeline. Small experiments are inexpensive but may lack statistical power. Large holdouts cost potential short-term gains but provide clearer causal estimates. Use a simple decision rule: if the possible overstatement of benefit materially changes the allocation of budget, invest in an experiment.
Produce reliable ROI by defining KPIs and evaluation windows at kickoff, reconciling costs and outcomes to finance, documenting assumptions, and validating incrementality with experiments or models before making budget changes.
Combining experiments and modeling for reliable estimates
Controlled experiments, when feasible, give causal evidence. Aggregated models such as marketing mix modeling provide a complementary view that estimates channel-level contribution when user-level tests are impractical. Combining both approaches produces more robust incremental ROI estimates because experiments validate model assumptions while models extend findings where experiments cannot run.
When experiments are not practical, document the limitations of attribution-based ROI and use sensitivity ranges or conservative adjustments to reflect uncertainty. An explicit incrementality assumption is better than an implicit one because it forces discussion of worst-case and best-case outcomes and reduces the chance decisions are made on overstated returns.
Build dashboards and set a review cadence
Core dashboard metrics and leading indicators
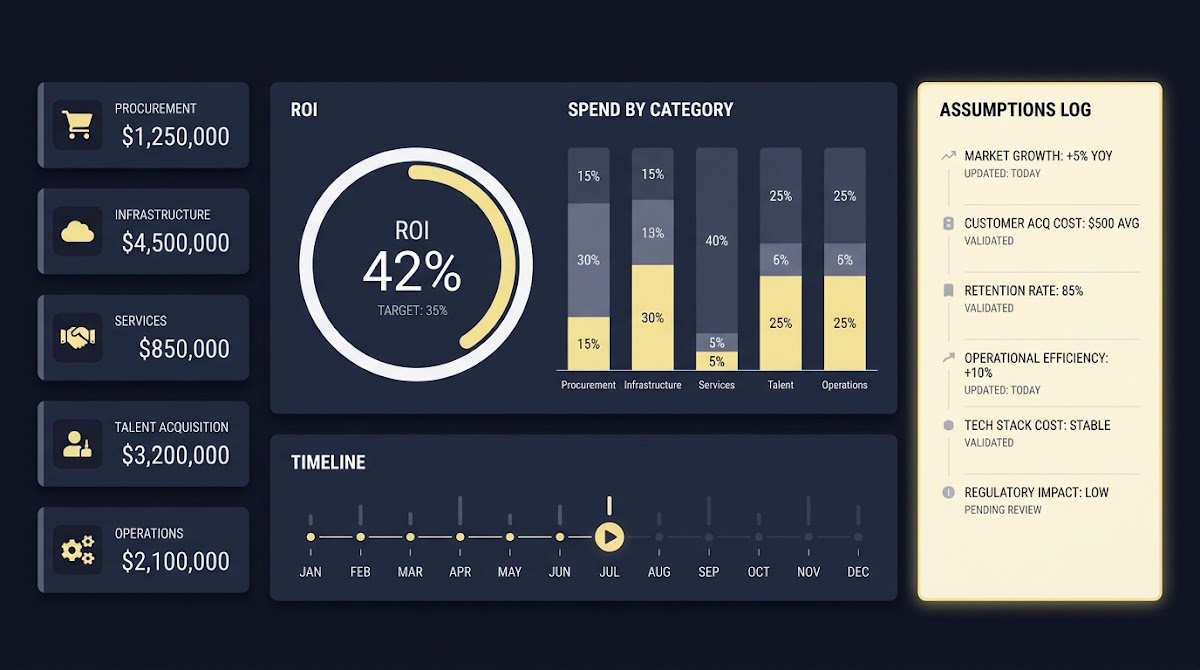
A concise ROI dashboard should include costs by category, the primary revenue or conversion metrics that feed the numerator, computed ROI and an incrementality or confidence signal when available. Leading indicators such as CTR, conversion rate and average order value help surface problems early. Design dashboards to show both totals and recent trends so reviewers can spot drift quickly.

Automate reconciliations where possible and include links to raw exports and the assumptions log so analysts and auditors can verify calculations. A well-constructed dashboard functions as a control plane that both reports performance and documents the provenance of the inputs Build and share reports in Looker Studio.
How often to review ROI and what to watch for
Set a review cadence that matches campaign velocity. Fast digital campaigns with daily spend may need weekly checks; longer brand or product efforts may be monthly. Frequent reviews catch data-quality issues early and allow teams to adjust spend before ROI deteriorates. Under budget pressure, leadership expects timely, disciplined measurement and clear explanations for changes in performance Gartner CMO spend guidance.
During reviews watch for sudden drops in conversion rates, large unexplained gaps between platform-reported spend and finance records, and mismatches between short-term revenue and the revenue recognition rules you documented. Treat these signals as triggers to pause decisions until reconciliations confirm the inputs.
Interpreting results and making decisions
Decision criteria: thresholds, confidence and next steps
Pair an ROI percentage with confidence signals and incrementality evidence before changing spend or strategy. For example, require both a positive ROI and either an experiment showing incremental lift or a strong model-based incrementality signal before scaling. Use the basic ROI formula as a comparator, but require documented assumptions and a confidence note alongside the number so decision makers understand risk. The core ROI formula remains useful when paired with transparent assumptions and incrementality-aware methods Investopedia ROI guide.
A practical decision framework: if ROI is negative, stop or reallocate immediately; if ROI is positive but confidence is low, run an experiment or apply a conservative scaling; if ROI is positive and confidence is high, scale with guardrails. Tie thresholds to business context and budget pressure rather than arbitrary percentiles.
a short validation checklist for ROI decisions
use before approving budget changes
How to account for timing and uncertainty
Delayed or recurring revenue requires explicit treatment. If revenue is recognized over months, present a time-adjusted ROI or include a note that the reported ROI covers only the initial recognition window. When uncertainty is material, show a sensitivity range, for example a low, base and high ROI reflecting conservative, expected and optimistic assumptions about conversion and retention.
Record revenue timing and uncertainty assumptions in an assumptions log and include that log as a linked document in the dashboard so future reviewers can understand how numbers were produced, and so the team can rerun scenarios if new information arrives.
Common mistakes and data-quality pitfalls to avoid
The most frequent calculation and interpretation errors
Several recurring errors undermine ROI work: mixing time windows for costs and outcomes, omitting cost categories like labor or tooling, double-counting revenue across channels and ignoring the need for incrementality testing. These mistakes produce numbers that look precise but are not decision-quality.
Quick indicators that something is wrong include unusually high ROI compared to similar efforts, large month-to-month swings without a clear cause, or mismatches between platform-reported outcomes and CRM or finance records. When you see these, stop and reconcile before changing budgets.
Quick fixes and prevention steps
Guidance on automated reporting can speed this work and reduce human error Build and share reports in Looker Studio.
When teams inherit messy reports, run a short remediation sprint: map inputs, reconcile totals to finance, and create a minimal reproducible dashboard. That effort pays back quickly because clean inputs lead to decisions that are more likely to produce the expected outcomes.
A step-by-step ROI worked example and checklist
Walkthrough: from objectives to dashboard
Example campaign: a three-month online trial promotion aiming to generate paid subscriptions. Objective: 1,000 incremental paid trials converting at 10 percent to paid within 30 days. Primary KPI: incremental paid subscriptions. Evaluation window: 90 days for acquisition plus 30 days for initial conversion recognition. Costs: media $40,000, creative and production $10,000, labor allocated $5,000, tooling and fees $2,000. Total cost $57,000. Clarifying these assumptions first prevents later disputes.
Outcomes: observed new paid subscriptions attributed to the campaign 150. Convert subscriptions to immediate recognized revenue by applying an average first-payment amount of $120. Gain equals 150 times $120, or $18,000. Using the basic formula, ROI = (18,000 - 57,000) ÷ 57,000 = -0.684, or -68.4 percent. For a clear reference on the formula and interpretation use the Investopedia ROI guide Investopedia ROI guide.
That nominal result indicates this campaign as structured lost money on immediate recognition. Before deciding to halt all activity, check incrementality. If a holdout experiment shows that without the campaign only 20 of the observed 150 subscriptions would have occurred, the incremental gain is 130 subscriptions, or $15,600. Incremental ROI then becomes (15,600 - 57,000) ÷ 57,000 = -0.726, still negative but slightly different. The incrementality check changed the numerator and therefore the decision context.

Printable checklist for the calculation and review
ROI checklist to copy: 1) Define objective and primary KPI, 2) Set evaluation window and revenue recognition rule, 3) List included costs and baselines, 4) Pull raw exports and reconcile to finance, 5) Compute nominal ROI and document formula, 6) Run or evaluate incrementality checks, 7) Populate dashboard with leading indicators, 8) Set review cadence and decision thresholds.
Keep the checklist in a shared place and require that every ROI report includes the completed checklist and assumptions log. That simple discipline makes numbers auditable and reduces debates about methodology during reviews.
Summary: practical next steps and best practices
Quick recap
Use the basic ROI formula as a concise comparator, but pair it with clean data, documented assumptions, incrementality testing or modeling, and regular dashboard reviews. The formula remains a useful baseline, and combining it with experiments or aggregated models improves decision quality in privacy-constrained environments.
Prioritize actions that increase trust: set KPIs and cost baselines at kickoff, automate reconciliations, and establish a review cadence. These steps protect ROI under budget pressure and reduce the chance of costly mistakes.
Where to focus first
Start with one campaign and run the checklist end to end so the team learns the reconciliation steps and documentation process. Once the process is reproducible, scale the same discipline to other initiatives. Consistency in definitions, data quality and cadence turns ROI from a debated number into a reliable decision tool.
Measurement is a discipline as much as a technique. Clear objectives, auditable inputs and a willingness to test incrementality are the practical foundations for trustworthy ROI reporting.
The basic formula is (Gain minus Cost) divided by Cost, expressed as a percentage. It requires explicit definitions of gain and cost to be meaningful.
Run an incrementality test when attribution uncertainty could change budget decisions, when expected effect size is material, or when privacy limits reduce user-level signals.
Review cadence depends on campaign velocity: weekly for high-frequency digital activity, monthly for longer initiatives, and always after data reconciliations reveal anomalies.
References
- https://www.investopedia.com/terms/r/returnoninvestment.asp
- https://www.pmi.org/learning/thought-leadership/pulse/pulse-of-the-profession-2024
- https://support.google.com/looker-studio/answer/9053467
- https://www.nielsen.com/insights/2025/roi-report/
- https://www.gartner.com/en/newsroom/press-releases/2024-05-29-gartner-cmo-spend-survey-2024
- https://www.fundedplays.com/challenges
- https://www.fundedplays.com
- https://www.fundedplays.com/blogs
- https://www.fundedplays.com/blogs/how-fundedplays-evaluations-work
- https://www.digitalapplied.com/blog/marketing-mix-modeling-2026-mmm-vs-attribution-playbook
- https://www.measured.com/faq/marketing-mix-modeling-2026-complete-guide-for-strategic-marketers/
- https://business.google.com/en-all/think/measurement/marketing-mix-modeling-measurement-roi/