

How to Track Prop Performance by Market Type: definition and why it matters
How to Track Prop Performance by Market Type begins with a simple point: not all proposition bets are the same, and treating them as interchangeable hides important differences in expected outcome distributions and risk profiles. Many jurisdictions now classify proposition wagers into clear market types such as player props, team props, and game-event props, and using those labels helps make comparisons fairer and more actionable; see the Massachusetts Sports Wagering Catalog for a practical example of a regulator catalog that lists permitted proposition wager categories Massachusetts Sports Wagering Catalog.
Player props typically depend on individual athlete performance, for example a running back's rushing yards. Team props relate to team-level outcomes, such as whether a team covers a points spread. Game-event props cover discrete events in a match, for example which team scores first or whether a certain event happens by a half. Each market type has distinct statistical properties: player props often show higher variance tied to individual usage, team props aggregate across players and can be more stable, and game-event props are often binary with different payout structures.
See FundedPlays Challenges for structured evaluation workflows
Follow the step-by-step workflow in this article to make your tracking reproducible and regulator-aware, so your comparisons across player, team, and game-event markets are based on auditable data and clear metrics.
Segmenting by market type matters because common KPIs respond differently to sample structure. A raw hit rate that looks good in a small set of high-variance player props can be misleading when compared to a larger set of low-variance team props. Similarly, ROI and expected value behave differently when stakes and payout structures vary by market. Treating market type as a core analysis dimension avoids mixing apples and oranges and supports decisions that reflect the underlying risk and payout patterns.
For readers focused on reproducible analytics, establishing a clear taxonomy is the first operational step. Label every record with the market type at capture, and ensure that the label maps to any regulator taxonomy you follow. This makes aggregation, filtering, and reporting consistent over time and reduces the chance of accidental misclassification when you merge records from different sources.

Regulatory market segmentation: how regulators define prop categories and why you should follow that structure
Regulatory catalogs in some jurisdictions now describe permitted proposition wager categories with clear labels, which provides a stable backbone for analysis. When records use the same categories named by regulators, merging datasets and preparing audit-ready reports becomes significantly easier; consult the Massachusetts Sports Wagering Catalog for an example of how a regulator presents permitted prop categories Massachusetts Sports Wagering Catalog. See also state system requirements Chapter 57 System Requirements.
Why follow regulator labels rather than ad hoc internal names? First, regulator-aligned labels improve comparability across platforms and providers. If you obtain event data, market sheets, or third-party records that reference the same regulator taxonomy, your joins and filters are less likely to introduce miscounts or mislabels. Second, regulator labels help when an external audit or review requests documentation; matching your internal taxonomy to public catalogs simplifies cross-checks and reduces back-and-forth.
Standardized labels also aid reproducible analytics. When you build queries, analysis scripts, or pivot logic against a fixed taxonomy, you reduce brittle code paths and get more stable results month to month. That stability is valuable when computing moving averages, rolling ROI, or when presenting a monthly report to stakeholders who expect consistent definitions over time.
In practice, start by comparing your internal market names to the regulator catalog you follow, then create a mapping table. Use that mapping at data ingestion so every record contains both the raw source label and the standardized regulator label. A small upfront mapping step saves hours later when you reconcile totals or investigate outliers.
Collecting auditable wager records: what fields to capture and how to store them
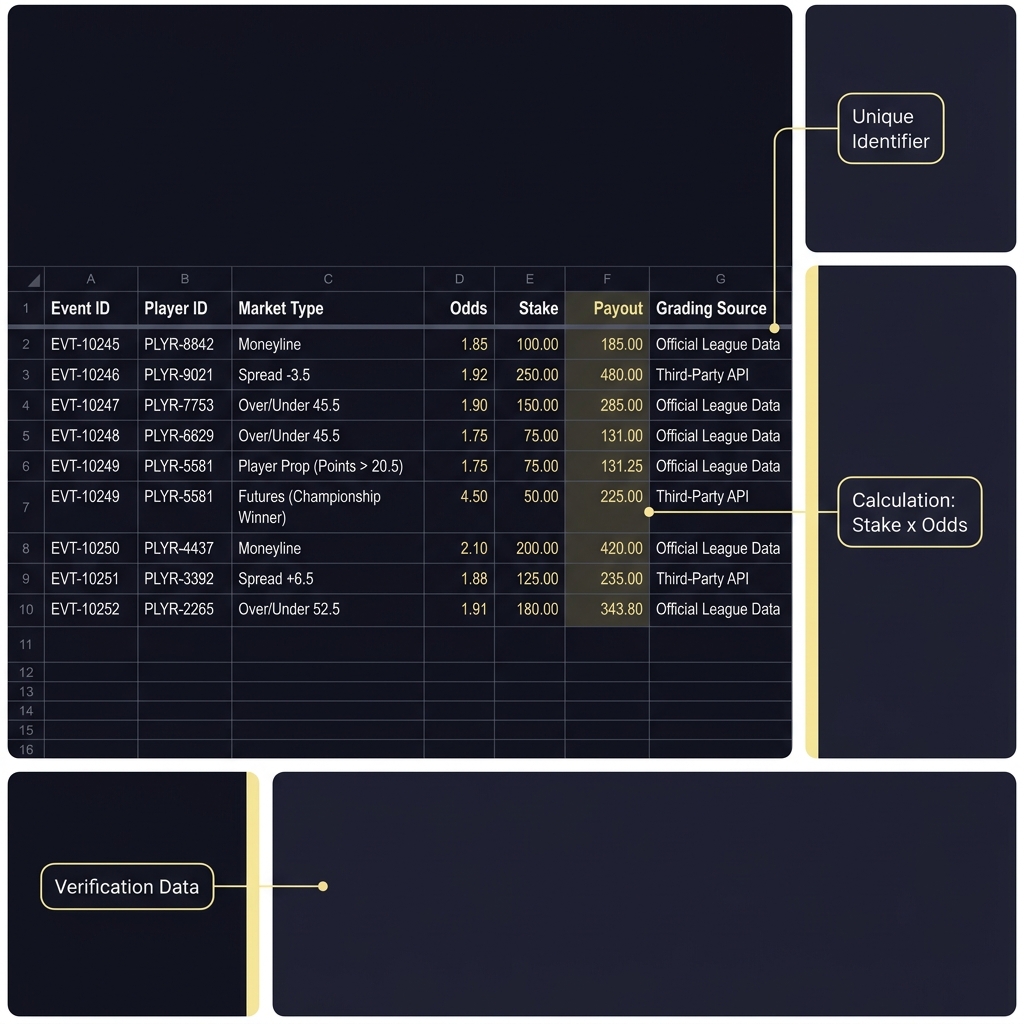
An auditable record set mirrors industry standards for event wagering systems: capture the minimum fields that enable replay, verification, and KPI calculation. At a minimum, record timestamp, market type tag, event id, participant identifiers, odds, stake or risked amount, potential payout, settled payout, outcome, grading source, and a version or export id to link to the data file. These fields support reproducible reporting and traceable calculations, which aligns with the requirements industry standards describe for maintaining comprehensive wager records GLI-33 standards for event wagering systems.
Design a simple data model you can implement in a spreadsheet or a light database. A spreadsheet row should represent one accepted proposition, and columns should include a unique wager id, received timestamp in UTC, market type, event id, participant id or description, line or odds, stake, decimal payout factor, settlement status, settled amount, grading timestamp, and grading source. Keep a column for notes and for the original raw label if you map names to a regulator taxonomy.
Structure prop tracking by defining a regulator-aligned market taxonomy, capturing a minimum auditable record set for each wager, grading outcomes from an authoritative source, computing EV, ROI, and hit rate by market, and producing smoothed rolling metrics in a repeatable monthly report.
Practical storage tips: keep a master workbook with dated exports and a change log. When you update records because of grading corrections, append a new export rather than overwriting old files so you maintain a versioned trail. Exportable formats such as CSV are preferred for long-term portability. If you use a lightweight database, ensure you can export snapshots and that the schema is documented so reviewers can reconstruct calculations from a given date.
When working in a spreadsheet, use separate tabs for raw imports, a cleaned master table, and a pivot or analysis sheet. Keep grading provenance in the master table and add a checksum or file hash column for each import if you need stronger auditability. These practical steps make it easier to demonstrate that your metrics follow a reproducible workflow and that each KPI can be traced back to source records.
Grading outcomes: verifying results with official league statistics
To grade proposition outcomes reliably, link each wager to an authoritative event id and use official league statistics as the grading source. Official systems such as the NFL Game Statistics and Information System (GSIS) provide authoritative player and game results that serve as a defensible source for settling player and team props NFL Game Statistics & Information System (GSIS).
The basic grading procedure is straightforward: first, record the official event id with every wager at capture. When the event settles, fetch the relevant official statistic for the prop, record the grading timestamp, and write the grading source into the outcome record. For example, if you accept a player yardage prop, store the player's official ID and the event id so the resolved statistic can be matched without ambiguity.
Handle corrections and delayed updates by keeping a grading update queue. If an official source posts a correction, update the settled outcome, record the correction timestamp, and keep the original settled record as an archived row. This ensures the audit trail shows initial settlement, the correction, and who made the change. That provenance is essential when metrics such as EV or ROI are computed from settled payouts and need to be reconciled to official records.
When multiple official sources exist for a league, pick one as your primary grading feed and document that choice. When disputes arise, your documented grading source and timestamps act as the tie-breaker and provide a reproducible path back to the official record used for KPI computation.
Core metrics to compute by market: EV, ROI and hit rate explained
Expected value, ROI, and hit rate are complementary metrics for understanding prop performance by market. Expected value measures the long-run edge you expect based on outcome probabilities and payouts, so it is the go-to metric for assessing whether a market offers structural profitability; use a clear EV formula when computing this metric and reference canonical definitions as needed Expected Value (EV) definition and examples.

Define EV per wager as EV = probability_of_win * payout - probability_of_loss * stake. For a decimal-odds system, a compact form uses the implied probability from odds and the payout multiplier to compute expected net return. Compute EV for every settled wager and aggregate by market type to see which segments produce a positive expected edge over time. Pair EV with a clear note on how you estimated outcome probabilities so the aggregation is reproducible.
Return on investment is defined as net profit divided by total amount risked, and it helps compare actual returns across markets where stake sizes or payout factors differ; for a reminder on ROI definitions see established financial references Return on Investment (ROI) definition and examples.
Hit rate is the simple share of winning wagers in a sample. Hit rate is informative but incomplete on its own: a high hit rate with low payouts can produce negative EV, while a lower hit rate with larger payouts may yield positive EV. Use hit rate together with EV and ROI to get a balanced view. For example, compute per-market EV, ROI, and hit rate, then prioritize markets with stable positive EV and acceptable volatility for further capital allocation or strategy refinement.
Time-series smoothing and visualization: using moving averages and rolling metrics
Performance series for props are often noisy, especially in player prop markets with smaller sample sizes. Smoothing noisy time series such as rolling ROI or hit rate helps reveal trends without overreacting to single-event variance. Moving averages are a simple, reproducible smoothing approach you can implement in spreadsheet tools; see Microsoft Support for practical instructions on calculating moving averages in Excel Calculate a moving average in Excel.
Build a rolling ROI series by computing ROI over a moving window of N wagers or over a fixed time window, then plot the series alongside a moving average of the same metric. A rolling approach preserves the sequence of results, while a simple centered moving average can highlight longer-term drift. Choose window sizes deliberately: shorter windows are more responsive but noisier, longer windows reduce noise but lag changes.
When you create charts, include raw points and the smoothed line so readers can see both the underlying data and the trend. Annotate charts with the window size and the computation method so anyone reviewing the workbook can reproduce the smoothing. This annotation is especially important for auditability and for communicating why a trend line was chosen.
Putting it together: a step-by-step workflow to analyze props by market
Combine the pieces into a monthly workflow: define the market taxonomy, ingest and clean records into an auditable master table, grade outcomes with an official source, compute per-market EV, ROI, and hit rate, then generate rolling metrics and visualizations for review. Stick to a fixed workbook layout or database export format so monthly snapshots are comparable and traceable.
monthly review checklist for prop tracking
run after each monthly import
Make the monthly report reproducible by committing the master table snapshot and the analysis workbook to versioned storage. For implementation notes see our blog and keep the artifacts together so any metric can be reconstructed from the stored artifacts.
Document thresholds and review rules in the workbook. For example, flag markets with sample sizes below your minimum or with EV divergences that exceed tolerance. The monthly review should produce a short action list: investigate grading corrections, adjust market focus, or perform deeper statistical analysis on markets with unstable signals.
Common mistakes and pitfalls when tracking prop performance
Mislabeling market types is a frequent error that skews comparisons. If a player prop is mislabeled as a team prop in your master table, aggregated ROI or hit rate by market will be distorted. Avoid this by enforcing a mapping from raw labels to regulator-aligned taxonomy at ingestion and by validating counts after each import. These data quality practices echo industry expectations for auditable record-keeping and traceability GLI-33 standards for event wagering systems.
Another common pitfall is using raw noisy series without smoothing. Small samples and high-variance outcomes produce wild swings in ROI and hit rate. Use moving averages or rolling windows to reduce noise and annotate the smoothing parameters so reviewers understand the trade-offs. The Microsoft Support guidance provides practical steps to calculate moving averages in Excel if you need a reproducible spreadsheet approach Calculate a moving average in Excel.
Missing timestamps, double-counting payouts, and overwriting historical exports are other frequent problems. Always keep a versioned export and never overwrite a raw import. When corrections occur, append corrected rows and record the correction timestamp and source so your audit trail shows the change history.
Practical examples and scenario walkthroughs: player, team and game-event markets
Walkthrough A: player prop series and EV aggregation. Start by extracting every player prop row with the player id, event id, stake, odds, and settlement. Compute an implied probability from the odds and calculate EV per wager. Aggregate EV across the player prop market to see whether the portfolio shows positive or negative expected edge. If you see a sizeable negative aggregate EV, examine whether a small subset of large-stake wagers or grading corrections explains the loss, and preserve the export files used for that review.

Walkthrough B: team prop ROI comparison and smoothing. Collect team prop records, compute ROI per wager and then compute a rolling ROI over a window of your choice. Chart the rolling ROI and add a moving average to highlight trend. Compare team prop rolling ROI to player prop rolling ROI but do so only after matching for sample size and timeframe, otherwise differences in stakes or event count will bias the comparison.
When signals diverge across markets, ask whether differences originate from payout structures, grading rules, or sample composition. Keep a saved outputs checklist for each walkthrough: the cleaned export, the grading log, the per-market metric table, and the visualization file. These artifacts ensure you can reproduce the conclusions and present a defensible narrative for any decision that relies on the analysis.
Conclusion and next steps: making your prop tracking repeatable
Tracking prop performance by market type is both a data discipline and an operational habit. Prioritize implementing the minimum record set, align your market labels with regulator catalogs, and create a monthly review that includes EV, ROI, and smoothed rolling metrics so you make decisions from reproducible evidence rather than short-term noise GLI-33 standards for event wagering systems.
Start with the first 30 days by standardizing your taxonomy and automating raw imports. In the next 60 days, lock down grading provenance and implement rolling metrics. By 90 days, the goal is a repeatable monthly report and an audit trail that supports reproducible conclusions. Treat metrics as probabilistic indicators and retain your audit artifacts so you can explain how any metric was derived when you or an auditor asks for the underlying records.
Include unique wager id, timestamp, market type, event id, participant id, odds, stake, payout, outcome, grading timestamp, and grading source.
Regulator labels improve comparability, simplify audits, and reduce classification errors when merging data from different sources.
Use EV to assess long-run edge based on probabilities and payouts, and ROI to compare realized returns relative to risked amounts; use both together for context.
References
- https://massgaming.com/sports-wagering/sports-wagering-catalog/
- https://www.maine.gov/dps/sites/maine.gov.dps/files/inline-files/Chapter%2057%20System%20Requirements%20.pdf
- https://gaminglabs.com/wp-content/uploads/2024/06/GLI-33-Event-Wagering-Systems-v1.1-1.pdf
- https://operations.nfl.com/stats-and-research/nflgsis/
- https://www.investopedia.com/terms/e/expected-value.asp
- https://www.fundedplays.com/challenges
- https://www.investopedia.com/terms/r/returnoninvestment.asp
- https://support.microsoft.com/en-us/office/calculate-a-moving-average-0ad7b27e-72eb-4b9e-87c9-37b4579b5d09
- https://www.fundedplays.com/blogs/how-fundedplays-evaluations-work
- https://www.fundedplays.com/blogs
- https://www.fundedplays.com
- https://www.publicgaming.com/news-categories-m/company-news/3463-gaming-laboratories-international-gli-publicly-releases-gli-33-event-wagering-technical-standard