

What a slump is and why discipline matters, How to Stay Disciplined During Long Slumps
A slump, in prediction contexts, is a sustained period when outcomes fall below expected levels of performance. It may look like a string of losing predictions, a drop in hit rate, or repeated negative unit returns, yet it is not always a sign that the underlying approach has failed.
Understanding the difference between short term variance and a true slump is essential. Short term variance is the normal ebb and flow of results around an average, while a prolonged slump can be a signal that rules are being broken, that model inputs have drifted, or that emotional choices have crept into the process.
Commit to a single checklist to protect your process
Commit to a simple checklist that keeps rule following and measurement first when outcomes go against you. Use it as a precommitment to pause reactive changes.
Discipline matters because it preserves your edge. When you follow predefined rules, track performance objectively, and avoid reactive size increases or last minute changes, you reduce the chance that temporary outcomes turn into permanent losses. Discipline keeps the focus on process rather than outcome, which is the only reliable way to evaluate and improve decision making over time.
For people using structured challenge platforms, process adherence aligns with how performance is assessed. See how Funded Plays evaluations work. Treat slumps as data rather than personal failure, and let rules and records guide corrective action.
How long slumps form: common causes and timelines
Slumps begin for many reasons, and those reasons can be grouped into external and internal categories. External causes include variance and changing external conditions that affect the predictive signal. Internal causes include model drift, unconscious rule breaking, and emotionally driven decisions that increase exposure or reduce selectivity.
Signals that a slump is becoming prolonged include sustained drawdown, a persistent fall in hit rate, and a growing deviation between expected value and realized outcomes. These signals should be tracked rather than judged emotionally.
Use precommitted rules, objective tracking, and staged recovery steps so decisions are procedural, not emotional.
When diagnosing the cause, separate what you can measure from your feelings about recent results. A useful checklist includes checking for data pipeline changes, reviewing recent rule violations, evaluating whether new information was weighted improperly, and confirming calculation routines are unchanged.
Typical timelines vary by strategy and sample size. For high frequency approaches, meaningful patterns may show in a few hundred decisions. For lower frequency or larger stake strategies, it may take many more outcomes to detect structural problems. The key is to look for consistent signals across multiple metrics rather than a single bad day.
External vs internal causes
External causes are often outside your control and include market style shifts, changes in team behavior, or altered event correlations. Internal causes arise from within your process, like model parameters slowly drifting, forgotten updates to data sources, or gradual relaxation of entry and sizing rules.
Typical timelines and signals that a slump is prolonged
An honest process check separates these causes. If the same model or rule set performed reliably in a properly sized sample before the slump, and nothing external changed, then internal process degradation is more likely. Conversely, if the environment changed in ways your model did not account for, adapt the model systematically and test changes carefully.
Look for a sustained trend rather than isolated losses. Key signals that a slump is prolonged include a falling hit rate over weeks, an increase in average loss size relative to average win size, and breaches of your preestablished drawdown thresholds. If multiple signals appear together, treat the situation as structural until diagnostic checks prove otherwise.
Finally, avoid jumping from diagnosis to overhaul. Use a short diagnostic plan before making large changes. The aim is to determine whether you are observing expected variance or a genuine degradation of your edge.
A simple framework to stay disciplined during long slumps
Discipline becomes manageable when it is procedural. The framework here rests on three pillars: rules, measurement, and a recovery plan. Each pillar turns judgment into procedure, which reduces the role of emotion when outcomes are poor.

Rules define what you will do and what you will not do. Measurement makes performance visible and audit ready. The recovery plan states the conditional steps you take at specific triggers. Together these pillars create a repeatable, low emotion response to slumps.
Core pillars: rules, measurement, and recovery plan
Start with clear rules that cover entry criteria, position sizing, and exit conditions. Complement the rules with measurement that tracks unit returns, hit rate, and adherence to the rules. Finally, a recovery plan lists the exact actions you will take at drawdown thresholds, such as scaling position size or pausing new exposure for a fixed period.
Document each pillar so it is easy to follow. The goal is to replace impulse with instruction. When the next bad run arrives, you will not need to decide from scratch; you will follow the documented protocol.
How to implement the framework step by step
Implementation works best with timeboxed tasks. On day zero of a slump, run a quick diagnostic checklist that confirms data integrity and rule adherence. Within the first week, update the measurement dashboard and review short term patterns. At defined drawdown points, execute the recovery steps you precommitted to.
Make the framework part of your setup before you place predictions. A precommitment reduces the temptation to change approach midstream, and the recovery plan offers a calm path to test fixes without overreacting.
Set clear rules before you place predictions
Clear rules remove ambiguity and protect discipline under pressure. Types of rules should include entry rules, size rules, and exit rules. Entry rules define the minimum expected edge for a pick, size rules cap exposure, and exit rules determine when to accept losses or lock in gains.
Write rules in an enforceable format, using simple, testable conditions. For example, an entry rule might be: only place a prediction when expected value meets or exceeds a predefined threshold and the underlying data sources are verified. A sizing rule might be: no more than 2 units on any single pick, and daily exposure limited to 6 units.

Store rules where they are visible before each session, such as a pinned document or the top of your tracking spreadsheet. Make a habit of reading them before you begin, so the first action you take in a session is rule following rather than reactive decision making.
Types of rules: entry, size, and exit
Entry rules can be quantitative, like thresholds on expected value, or qualitative, like avoiding events with incomplete information. Size rules should relate to bankroll or virtual account size. Exit rules can be time based, such as closing positions before a certain time, or event based, such as trimming exposure when adverse conditions increase.
Rules should be specific and simple enough to check quickly. Avoid overly complex exceptions that you will forget under stress. Simpler rules are easier to follow and to audit after the facts.
How to document rules so you can enforce them
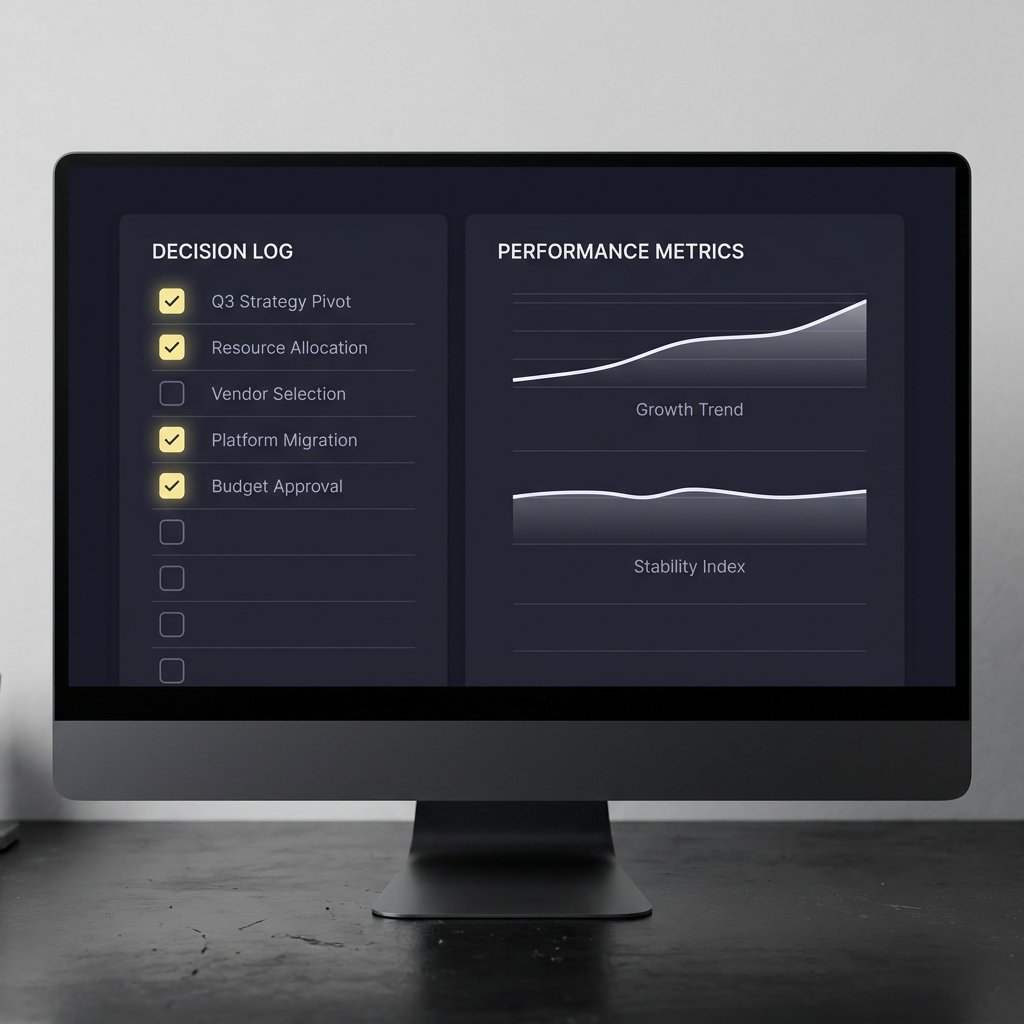
Use a short template that captures rule type, rationale, and trigger conditions. Keep the template at the top of your decision log or tracking sheet. When you violate a rule, note the violation and the reason, then review it weekly so you can learn whether rules need refinement or enforcement improved.
Consistent documentation is the only reliable way to identify whether slumps stem from broken rules or from normal variance. Treat the log as evidence, not judgment.
Bankroll and risk management for slumps
Bankroll rules protect optionality during extended losing periods. The primary goal in a slump is to preserve capital and keep the ability to learn and adapt. Conservative position sizing and strict drawdown limits are central to that goal.
When hit rate falls or volatility rises, reduce size proportionally to protect capital. For example, apply a scaling rule where position size is reduced by a set fraction after predefined drawdown thresholds. See bankroll reset examples.
How to size positions during a slump
Position sizing should be rule based and tied to both bankroll and strategy variance. Use smaller fixed unit sizes or percent of bankroll sizing to limit exposure. Avoid increasing unit size to chase losses, as that behavior amplifies risk and undermines discipline.
If you use multiple strategies, allocate capital by expected value and historical volatility so no single approach can produce catastrophic drawdown. Cross strategy limits reduce the chance that correlated downsides destroy your account.
Setting drawdown limits and step back rules
Predefine drawdown limits that trigger action. A simple plan could set a first threshold where you scale sizes down, a second threshold where you pause new predictions and conduct a diagnosis, and a third threshold where you consider a temporary break or structural review. Each threshold should have a specific, non emotional action tied to it.
Step back rules are not failure. They are protective measures that create time and space to learn. A time limited pause can stop reactive mistakes and let you return with clear, evidence based changes rather than rushed adjustments.
Build a measurable process and tracking system
Measurement turns feelings into facts. Track a handful of core metrics consistently: unit returns, hit rate, ROI per strategy, and variance measures. Log decisions with their rationale so you can separate process adherence from outcome luck. See our blog for templates.
quick metric for average return per decision
use this to monitor per decision returns
Daily entries should capture the pick, units staked, rationale, rule adherence, and outcome. Weekly summaries should show aggregated metrics and highlight rule violations. Over time, these records create a learning loop that makes future decisions more objective.
What to track and why it matters
Key metrics include total return by unit, hit rate, ROI by strategy, and distribution measures like average win and average loss. Also track qualitative items, such as whether the decision met documented entry criteria, and whether any rule exceptions occurred.
Tracking both process and outcome provides context. A low hit rate with consistent rule adherence may still be acceptable if unit returns remain positive. Conversely, a decent short term outcome with many rule exceptions is not sustainable.
Simple tools and templates for tracking
A basic tracking layout includes date, event, selection, units, expected value or confidence level, rule checkboxes, and outcome. Add a short notes column for rationale and any deviations. Use conditional formatting to flag rule violations and drawdown thresholds so visual cues help maintain discipline.
Automate what you can, but avoid complexity that prevents daily updates. The simpler and faster the log, the more likely you will keep it current during pressure.
Emotion regulation techniques that preserve discipline
Emotional pressure increases when outcomes go against us. Practical, short term tactics help you avoid reactive mistakes, and longer term habits reduce the risk of future drift; see sports psychology guidance.
Start with in the moment tactics like breathing, pausing before placing a bet, and time boxing decisions. These actions create a brief cognitive gap that reduces impulsive choices.
Quick in the moment tactics
When you feel the urge to overbet or deviate from rules, pause for a fixed period, such as five minutes, and run a short checklist: does this pick meet entry criteria, is size within limits, and is there a documented rationale. If any answer is no, do not proceed.
Use physical cues to enforce pauses, like standing up, stepping away from the screen, or switching tasks for a short time. Small interruptions are effective at breaking habitual reactions and restoring rule based thinking.
Habit level practices to reduce emotional drift
Longer term practices include journaling, scheduled breaks, and accountability partnerships. A weekly journal entry reflecting on decisions, rule adherence, and feelings helps identify patterns. Scheduled breaks after reaching a session limit prevent fatigue driven mistakes.
An accountability partner or peer review can help you stay honest about exceptions and rule violations. Share summaries with a trusted peer who can point out patterns you may miss when emotionally involved.
Common cognitive biases and pitalls that break discipline
Losing streaks amplify predictable biases. Awareness and simple countermeasures greatly reduce their harm. The most common errors during slumps include recency bias, loss chasing, and confirmation bias. See The Psychology of Losing Streaks.
Each bias pushes behavior away from long term edge. Recognize them early and use structured counters so you do not have to rely on willpower alone.
Biases most likely during losing streaks
Recency bias makes recent outcomes feel more important than they are. Loss chasing tempts you to increase size or relax rules to recover losses quickly. Confirmation bias leads you to overweight information that supports your desired action and to ignore contrary signals.
Spot these biases by reviewing the decision log and checking for pattern changes. If you see more exceptions or size increases after losses, a bias is likely active and needs correction.
How to spot and neutralize each bias
Neutralize recency bias by lengthening your evaluation window and using precommitted metrics. Counter loss chasing with hard limits that require a cooling off period after losses. Reduce confirmation bias by seeking disconfirming evidence as part of your decision checklist.
A short exercise to discover your dominant bias is to review ten consecutive losing decisions and note what rule changes or emotions accompanied each one. The pattern will usually point to a primary bias to address.
Practical daily routines and checklists to enforce discipline
Routines turn good intentions into repeatable actions. A short morning setup and pre decision checklist primes you to follow rules. An end of day review consolidates learning and surfaces rule exceptions for weekly reflection.
Morning setup and pre decision checklist
Your morning setup should include reviewing the rule set, scanning key metrics from the tracking system, and confirming data sources are current. The pre decision checklist should be three to five items long, for example: expected value threshold met, position sizing within limits, no recent rule violations that would block the pick.

Read the checklist aloud before the first prediction and keep a visible copy during your session. This simple ritual reduces rushed choices and primes adherence to rules.
End of day review and weekly reflections
At the end of each session, record outcomes, note any rule violations, and add short rationales for exceptions. Weekly reflections should aggregate the daily logs and focus on process metrics rather than single outcomes. Use the weekly review to decide whether any rules need refinement or if testing is required.
Keep the weekly review time boxed so it does not become an avoidance activity. The goal is steady improvement, not perfection.
Scenario examples: short slump, extended slump, and recovery path
Concrete scenarios help map abstract rules to real action. Below are three typical cases and the disciplined responses that match each.
Short slump: stay the course
In a short slump caused by variance, follow the rules and maintain size. Confirm data integrity, ensure no rule breaches occurred, and continue tracking. A short slump usually resolves if the edge is intact and rules were followed.
Do not change strategy based on a small sample. Instead, reinforce the habit of logging decisions and reviewing outcomes after the next scheduled evaluation point.
Extended slump: slow down and diagnose
If the slump is prolonged, first scale sizes down according to your drawdown plan. Pause new high exposure positions and run a diagnostic checklist that includes checking for model drift, recent rule exceptions, and external condition changes. Only after identifying a plausible structural cause should you test targeted changes at small scale.
Document the diagnostic process and its conclusions so you can evaluate whether fixes actually improve the metrics that mattered before you implemented them.
Recovery path: staged increase and confidence rebuilding
Recovery should be staged and metric driven. After your metrics show improvement and rule adherence is high, increase exposure gradually. Use fixed step sizes and require a set number of positive outcomes or a return to prior performance bands before restoring full size.
Build confidence with small wins and clear data. Track wins as evidence of process recovery rather than treating them as a license to abandon disciplined sizing and rules.
When to pause, adapt, or change your strategy
Pausing or changing a strategy should be the result of rule defined triggers, not frustration. Concrete triggers could include exceeding a predefined drawdown threshold, repeated rule violations, or a statistically significant drop in key performance metrics over a sustained period.
When you decide to test a change, use safe testing techniques like small sample tests, holdout samples, or A B style experimentation. Keep changes isolated so you can attribute effects to the change rather than to noise.
Decision criteria for pausing
Set clear pause triggers such as a third consecutive breach of a specific rule, a drawdown beyond your second threshold, or a sudden and sustained increase in variance. When a trigger fires, follow the stated pause actions without negotiation, then perform the diagnostic checklist.
Document the decision to pause and the evidence that led to it. This record helps prevent emotional backtracking and supports calm, evidence based decisions about next steps.
How to test strategy changes safely
Test changes on small, time limited samples and compare outcomes against holdout data. Use identical logging and tracking so the new approach is evaluated by the same metrics as the old one. Avoid wholesale replacement of a strategy based on a tiny sample or an emotional reaction.
Only expand a successful test gradually and keep the decision tied to pre specified metrics that demonstrate improvement in process and return measures.
Rebuilding confidence and long term resilience after a slump
Confidence returns through small wins and by rebuilding a track record of disciplined decisions. Choose low risk, high clarity opportunities that let you demonstrate rule adherence and measurable improvement.
Turn slump lessons into permanent process improvements by updating your rules, tracking templates, and recovery plan. Use the decision log to identify recurring issues and fix them at the process level.
Small wins and gradual scaling
Plan a staged return to full size, tied to metrics such as consecutive period returns, normalized hit rate, or reduced variance. Each stage should be a time boxed step with objective improvement criteria before advancing.
Reward adherence to process rather than short term outcomes. Reinforce the behaviors that led to better metrics, and keep the log of decisions as a narrative of the rebuild so you can reference what worked.
Learning loops and continued improvement
Set quarterly reflections where you review the full history of rule changes, tests, and outcomes. Use those sessions to refine the rule set and to plan experiments that address observed weaknesses. Continuous improvement reduces the likelihood that the same slump pattern repeats.
Resilience is not a personality trait. It is a practice built by repeated adherence to process, careful measurement, and disciplined scaling of exposure.
Summary action plan and next steps
Below is a compact action plan you can copy and use immediately. It focuses on rules, tracking, and pause triggers so you have a single page to follow when slumps start.
Action plan: 1) Write three enforceable rules covering entry, size, and exit. 2) Implement a daily tracking log with required fields. 3) Set two drawdown thresholds and actions for each. 4) Use a cooldown rule that pauses new exposure after a set number of violations. 5) Schedule weekly reviews to check process metrics.
Five next steps: create or update your rule document, build the tracking sheet, set drawdown limits, identify an accountability partner, and run a short diagnostic on your recent decisions. Also visit the Funded Plays homepage for resources. Remember that slumps are an opportunity to test your process under stress, not proof that you must abandon the plan.
Consider structured changes only after predefined drawdown triggers or after diagnostics show structural issues. Use small, time limited tests before full adoption.
Use a short pre decision checklist each session that confirms entry criteria, size limits, and rule adherence before placing predictions.
Rebuild with staged, low risk steps tied to objective metrics and by reinforcing rule adherence and documented small wins.
References
- https://www.fundedplays.com/challenges
- https://www.fundedplays.com/blogs/how-fundedplays-evaluations-work
- https://www.fundedplays.com/blogs
- https://www.fundedplays.com
- https://www.sportsprediction.asia/blog-detail/369/bankroll-reset-after-a-losing-streak-how-to-bounce-back-smarter.html
- https://www.peaksports.com/sports-psychology-blog/how-to-overcome-a-losing-streak-in-sports/
- https://www.piwi247.com/en/blogs/betting-tips/psychology-of-losing-streaks-stay-disciplined/