

Definition and why separating skill from short-term luck matters
When people ask how to separate skill from short-term luck they mean something specific: skill is repeatable, above-baseline predictive performance that persists across enough independent opportunities, while short-term luck is random variation that can make outcomes look better or worse than the average in a limited window. Calling a short run evidence of skill risks committing to a strategy that will fail once chance evens out, so a clear distinction matters for decisions about continuing a method, allocating resources, or qualifying participants in challenge-style evaluations.
Short-term variance and regression to the mean are the mechanics behind many false positives. Random sequences produce streaks; the next run often moves back toward the long-term average, which is why single winning streaks are unreliable signals. Being explicit about uncertainty and using preplanned evaluation rules reduces the chance of mistaking luck for consistent performance, and it helps stakeholders avoid overinterpreting short-term outcomes, an approach underscored in discussions of publication bias and uncertainty communication PLoS Medicine article.
See how Funded Plays defines evaluation and qualification
Keep reading for a short diagnostic checklist that helps you move from a noisy short run to a defensible assessment of predictive skill.
Transparent reporting and preregistered evaluation plans make claims about skill more credible by constraining data-driven selection and clarifying what counts as success. Clear plain-language communication about uncertainty also helps decision-makers understand how much confidence to place in a result and why immediate action based on a short sample may be premature UK Government guidance on communicating uncertainty.
The short-term variance problem: intuition and simple examples
Streaks and hot hands are easy to see but hard to interpret because randomness creates runs that look meaningful. Imagine flipping a fair coin repeatedly; by chance you will see short sequences of heads or tails that feel like patterns, but those sequences do not indicate a change in the underlying process. The same intuition applies to predictions: stochastic outcomes can produce apparent streaks even when a predictor has no repeatable edge.
Sample size determines how much variability you should expect. Small samples have wide sampling variability, so observed performance can be far from the long-run average; larger samples shrink that variability and make departures from baseline easier to interpret. When you see a strong-looking result from only a handful of trials, treat it as provisional and plan a confirmatory, out-of-sample check rather than acting as if the result proves skill ASA statement on p-values and context.
Core metrics: strictly proper scoring rules and what they reveal
To judge probabilistic forecasts, use strictly proper scoring rules because they reward honest probability statements and penalize hedging that masks uncertainty. Proper scores encourage forecasters to state their true estimated probabilities instead of inflating certainty, which helps separate well-calibrated forecasts from lucky, overconfident guesses.
Combine proper scoring rules, calibration checks, robust intervals or Bayesian posteriors, and out-of-sample verification; treat short runs as provisional until these diagnostics consistently indicate above-baseline performance.
Two widely used proper scores are the Brier score and the log score. At a high level, the Brier score measures the squared difference between forecast probabilities and outcomes, so lower values indicate better probabilistic accuracy; the log score penalizes assigning vanishing probability to events that occur and thus rewards sharp, well-supported probability distributions. These scoring rules, combined with visual checks, help you see whether forecast probabilities systematically match observed frequencies or simply fit a short run by chance Journal article on proper scoring rules.
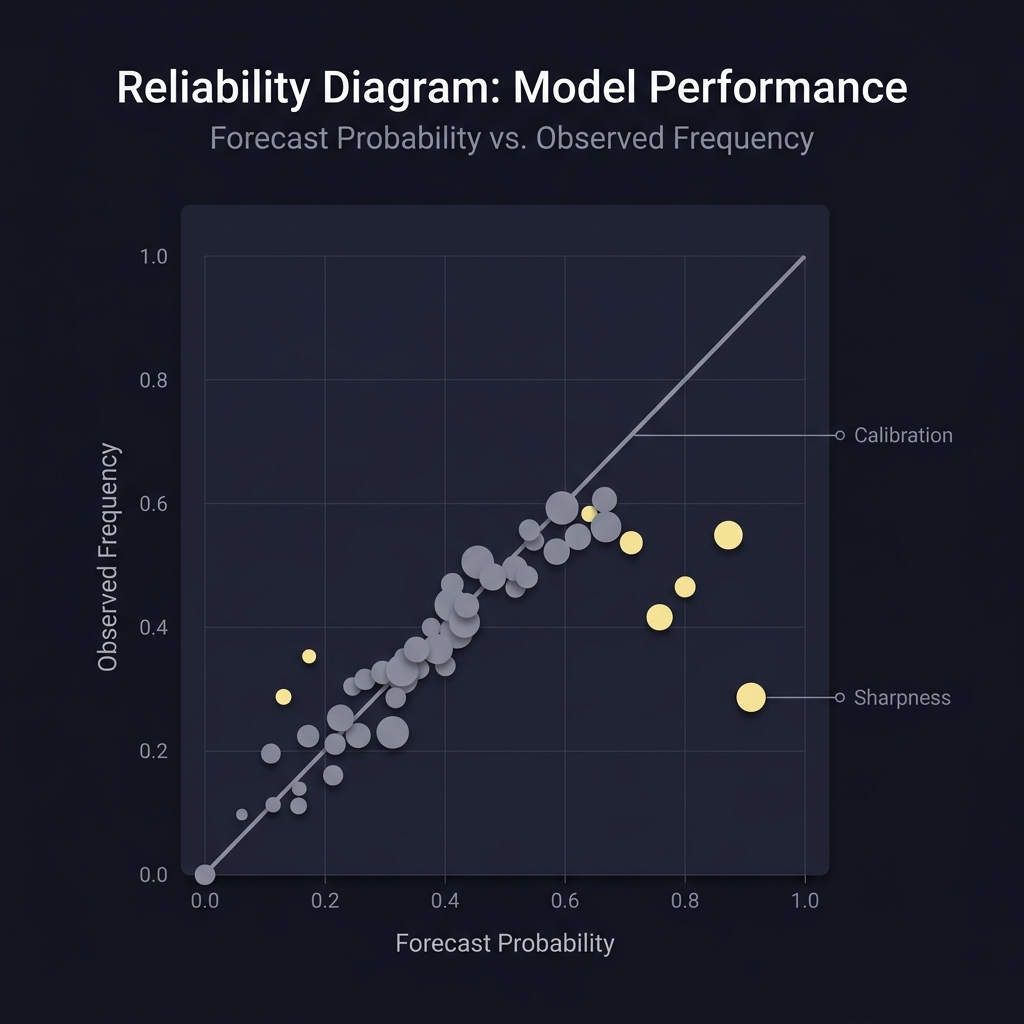
Reliability diagrams complement scores by showing calibration and sharpness visually. A reliability diagram plots observed frequencies against forecast probabilities in bins, revealing whether probabilities are well calibrated and whether the forecaster provides informative, nonvague probabilities. Using scores and reliability diagrams together is a practical way to detect whether stated probabilities reflect skill rather than short-term noise.
Calibration and sharpness diagnostics in practice
Reading a reliability diagram is straightforward if you know what to look for. The diagonal line represents perfect calibration: points near that line show that, for example, forecasts of 60 percent align with outcomes that happen 60 percent of the time. Systematic deviations above or below the diagonal indicate miscalibration.
Sharpness describes how concentrated a forecaster's probability distribution is. A forecaster who always predicts 50 percent for every binary outcome is perfectly calibrated but not sharp, because the probabilities carry no information. Good forecasting combines calibration with sharpness: probabilities should track frequencies and be meaningfully different from baseline uncertainty. These diagnostics together make it harder for a lucky streak to masquerade as repeatable skill Journal article on proper scoring rules.
Binary outcomes: better confidence intervals and exact tests
When outcomes are binary, the naive Wald confidence interval can mislead, especially with small samples or when observed rates are near 0 or 1, because it relies on a normal approximation that is unstable in those settings. Using better-behaved intervals and exact tests gives more reliable inference about whether an observed success rate plausibly exceeds a baseline.
The Wilson score interval often performs better than the Wald interval because it adjusts for small samples and yields intervals that behave more sensibly near the extremes. Exact or binomial tests provide an alternative by using the binomial distribution directly rather than relying on approximations, which helps control false conclusions in small-sample settings Statistical Science article on interval estimation for binomial proportions.

Use intervals and tests together: report the Wilson interval to show the plausible range for a success rate and, if needed, run an exact binomial test to assess whether results deviate from a baseline rate with appropriate caution. This combined approach gives a clearer picture of whether a short run is consistent with skill or more likely attributable to chance.
Bayesian updating: combining prior beliefs with observed results
A Bayesian framework gives a coherent way to combine prior expectations about baseline performance with observed outcomes to estimate the probability that a predictor truly has skill. Instead of a binary accept-or-reject decision, Bayesian updating yields a posterior distribution that expresses uncertainty about the true ability after seeing data.
For binary outcomes, a Beta-Binomial conjugate model is a common, transparent choice: the prior Beta distribution encodes baseline belief about success probability, observed successes update that prior to produce a posterior Beta distribution, and the posterior credible interval summarizes plausible values for the true success probability. This approach moderates noisy short-term results by blending them with prior information, and it is important to report and check sensitivity to different reasonable priors Book on Bayesian data analysis.
Avoiding bias: selection, multiple testing, and out-of-sample verification
Selection and publication bias make random findings appear important because analysts or platforms may examine many strategies and only highlight the winners. Unchecked, this process inflates the apparent prevalence of skill and misleads stakeholders about the reliability of reported results. The phenomenon has been discussed in the context of research reproducibility and false positives PLoS Medicine article.
a short reproducible preregistration and holdout workflow for forecast evaluation
Use the checklist before any exploratory analysis
Practical defenses are preregistration of evaluation plans, predefined success criteria, and keeping a strict holdout or out-of-sample set for final verification. These steps reduce the temptation to mine data for positive-looking runs and make it possible to credibly report whether results persist when tested on fresh data.
Multiple testing is another risk: trying many combinations of features, parameters, or selection rules will produce some apparent successes by chance. Control strategies include limiting tested hypotheses, adjusting for multiple comparisons, or reserving a final verification set whose results are not used to tune the strategy.
A decision framework: when to act on observed performance
Decisions should combine effect size, uncertainty, and the practical cost of being wrong. Rely on effect sizes and confidence or credible intervals rather than single p-values, and set action thresholds tied to the consequences of Type I and Type II errors in your context. The ASA guidance recommends framing results with effect sizes and intervals, not just p-values, to prevent overinterpreting noise ASA guidance on p-values and context.
Use staged commitments and monitoring rules: consider a probationary period of limited exposure while collecting out-of-sample evidence, and escalate allocation only if performance persists. Document decision rules in advance and record follow-up results so that initial assessments are revisited with new data rather than left as final judgments.
Typical mistakes and common pitfalls
Common errors include overinterpreting small samples, cherry-picking favorable periods, ignoring calibration diagnostics, and relying on a single p-value as proof of skill. Each mistake increases the chance that apparent performance is an artifact of noise rather than a repeatable advantage PLoS Medicine article.
Corrective actions are simple and practical: increase the evaluation horizon where possible, preregister analysis plans to prevent selective reporting, check calibration with reliability diagrams, and prefer robust intervals or Bayesian posteriors to single significance tests. These steps make it harder for luck to masquerade as skill and easier to recognize genuine predictive ability.
Designing robust evaluations for skill-based platforms
Core design elements for a fair evaluation include predefined objectives, a clear evaluation horizon, a holdout or out-of-sample verification step, and transparent rules for qualification. These features limit opportunities for selection bias and make evaluations reproducible and comparable across participants.

Platform reward or qualification structures can change behavior and thus influence apparent skill. It is important to align incentives so that they reward consistent, well-calibrated forecasting rather than short-term risk-taking that produces noisy wins. Publishing methods and results reduces the chance that only successful runs are shown and supports external checking of claims UK Government guidance on communicating uncertainty.
Practical scenarios and worked examples (procedural, no invented numbers)
To check forecast calibration with a reliability diagram, follow a simple procedure: collect forecast probabilities and outcomes, choose reasonable probability bins, compute the observed frequency of the event in each bin, and plot observed frequency against forecast probability. Inspect whether points sit near the diagonal and whether bins have enough cases to make the frequencies meaningful; document binning choices and perform sensitivity checks on bin sizes to ensure conclusions are not driven by arbitrary choices Journal article on proper scoring rules.
To use Wilson intervals to judge a run of binary results, the workflow is conceptual: collect the number of trials and observed successes, compute the Wilson score interval that gives a plausible range for the true success probability, and compare that interval to a baseline rate. If the interval excludes the baseline in a practically meaningful way, the run provides stronger evidence of skill; if not, treat the result as inconclusive and plan an out-of-sample check Statistical Science article on interval estimation.
For a conceptual Bayesian update workout, state a transparent prior expressing reasonable baseline belief, observe new trial outcomes, update to the posterior distribution, and summarize the posterior credible interval or the posterior probability that the success rate exceeds a baseline. Report how sensitive the posterior is to alternative priors and document why the chosen prior is appropriate for the domain Book on Bayesian data analysis.
Reporting results clearly: transparency and plain-language uncertainty
When you publish evaluation results, include effect sizes, confidence or credible intervals, calibration diagnostics, and the original evaluation plan. Avoid presenting lone p-values as the deciding fact and instead provide context about design choices and limitations so readers can judge how robust the evidence is. The ASA recommends emphasizing effect sizes and intervals to reduce misinterpretation of random variation ASA guidance on p-values and context.
For nontechnical audiences, use plain-language templates such as: "Our method achieved a success rate that is plausibly between X and Y based on our evaluation, and the calibration plot shows whether probabilities matched outcomes. We preregistered the evaluation plan and confirmed results on a holdout set." Replace placeholders with actual intervals and brief notes on limitations to keep communication honest and useful. (See our blog.)
Conclusion: key takeaways and a short checklist to verify skill
Before you call a result evidence of skill, apply three quick checks: use proper scoring rules to assess probabilistic forecasts, verify performance out of sample, and inspect intervals or Bayesian posteriors for plausible effect sizes. No single short run proves skill; consistent evidence across these diagnostics makes a stronger case for repeatable performance Journal article on proper scoring rules.
Next steps are pragmatic: preregister your evaluation, run calibration and interval diagnostics, and communicate uncertainty clearly to stakeholders. These practices reduce false positives and make it easier to identify genuine predictive skill over time.

Short runs are unreliable; use scoring rules, calibration checks, and an out-of-sample verification period before concluding performance is due to skill.
No. Report effect sizes, confidence or credible intervals, and follow a transparent evaluation plan rather than relying only on p-values.
Both have roles: Bayesian updating gives a posterior probability and sensitivity to priors, while Wilson intervals and exact tests provide robust frequentist checks for binary results.