

What compliance monitoring in a dashboard actually means
Definitions: logs, events, traces, telemetry
At its core, compliance monitoring in a dashboard is about translating policy requirements into reliable, queryable signals that reflect system activity. A compliance dashboard collects logs, events, traces, and related telemetry then presents those items as evidence that rules were followed or breached. The term audit records describes the chronological, system-generated entries that form the backbone of any rule compliance dashboard; these records are the primary evidence used during investigations and audits.
The AU controls in established frameworks define what makes an audit record trustworthy and useful. For example, AU-focused guidance explains why systems must generate sufficient detail about who did what, when, and from where so that dashboards can support investigations and compliance reporting Security and Privacy Controls for Information Systems and Organizations (SP 800-53 Rev. 5).
Logs are structured or semi-structured records of discrete events, events can be higher-level occurrences derived from logs, and traces capture request flows across services. Telemetry is the umbrella term that unites these data types to allow correlation and richer analysis. When you design a compliance view, think of telemetry as the raw material that, when standardized and correlated, lets you answer questions about authentication events, privilege changes, access to sensitive resources, and configuration changes.
Why dashboards need immutable audit evidence
Dashboards used for compliance must expose an authoritative, tamper-resistant view of historical events because investigations and regulatory reviews rely on immutable evidence. Establishing a documented audit log management process that covers what to log, how long to keep it, and who can access it is a foundational control for defensible monitoring CIS Critical Security Controls v8.1.
Centralized collection and strong protections for audit data reduce the risk that evidence is lost or altered. Immutable archives or append-only stores, combined with access controls and integrity checks, let teams link dashboard signals back to raw audit records during incident response and compliance verification.
A practical framework for monitoring compliance in dashboards
Step 1: Define logging requirements and rule-to-signal mappings
The first step is authoring a log management process that maps each compliance rule to the specific events or combinations of events that indicate compliance or a violation. Document what must be logged for each rule, the minimal fields required for investigations, and the retention period that satisfies governance needs. This documented process aligns with established guidance for audit log management and provides the baseline for reliable dashboards CIS Critical Security Controls v8.1.
Practical rule-to-signal mappings are explicit. For example, a rule that prohibits privilege escalation without approval can map to an observable signal like a privileged role assignment event plus the absence of an approval record within a given timeframe. For authentication rules, map the rule to failed and successful authentication attempts, multi-factor triggers, and session terminations so the dashboard shows both normal behavior and exceptions.
Checklist, step, and ownership fields are useful in the log management document. A simple checklist item might read, ‘Record user identifier, source IP, timestamp, action, and request identifier for every privileged role change.’ By standardizing the fields you collect, you make downstream correlation and long-term retention more tractable.
Step 2: Centralize and standardize telemetry
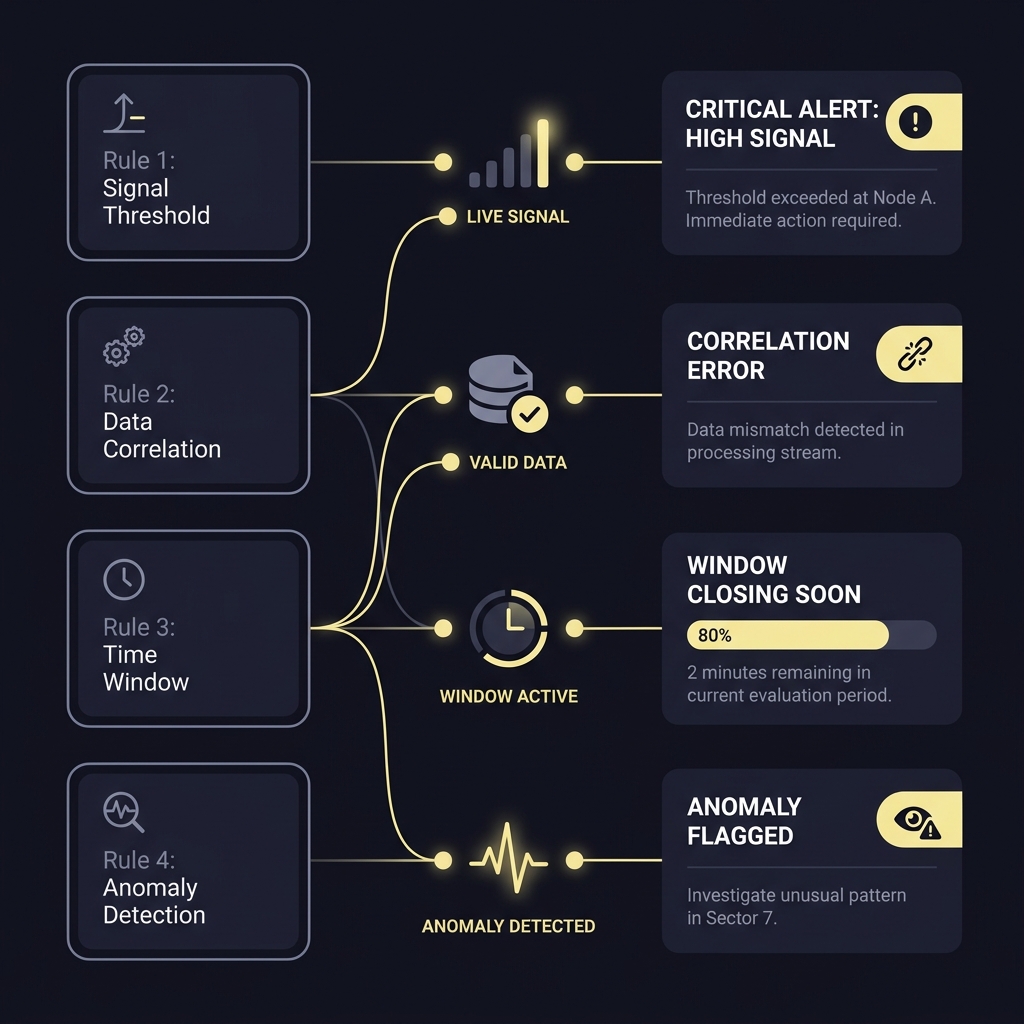
Centralized collection simplifies querying and reduces blind spots. When telemetry from applications, infrastructure, identity systems, and network devices flows into a central store, you can build dashboard views that combine authentication, privilege changes, and access events in one place. Increasingly, teams adopt standardized telemetry schemas and protocols to improve correlation between logs, metrics, and traces Cloud Native Observability 2024. See how to centralize log management with Cloud Logging for practical implementation notes.
Standardization helps you avoid situations where the same concept is logged with different field names or formats across systems. Define a minimal schema for audit records and require telemetry producers to include those fields. This reduces manual mappings in the dashboard and ensures that rule-to-signal mappings remain accurate as services evolve.
Centralization also supports consistent protection, retention, and access control policies. A central log store makes it feasible to implement integrity checks and role-based access so that only authorized investigators can view or export raw audit records during reviews.
Audit your logging coverage and prioritize improvements
Audit your current log coverage against the checklist in step one, and use that gap list to prioritize which systems to instrument next.
Step 3: Protect, retain, and make audit views immutable
Protecting audit data requires multiple layers: write-once or append-only storage for raw logs, cryptographic integrity checks such as checksums or signing, and strict access controls for both the storage and the dashboard that surfaces the data. These protections ensure that audit records remain reliable evidence years after they were generated.
Retention policies should be explicit and documented so teams know the minimum retention for particular event classes. The CIS guidance recommends establishing a documented audit log management process that covers retention and regular review obligations, providing both operational clarity and compliance proof points CIS Critical Security Controls v8.1.
Finally, consider layering immutable, append-only archives on top of your active central store for long-term preservation. These archives serve as the authoritative source for investigations and support legal or regulatory requirements to hold evidence for defined periods.

Turning rules into signals: alerting and prioritization
Mapping rules to thresholds and behavior-based detections
Converting rules into alerts requires explicit mappings between a rule and observable signals. Some rules map to direct thresholds, such as the number of failed authentications within a time window. Others need behavior-based detections that look for anomalies relative to baseline patterns, for example unusual privilege changes outside of normal maintenance windows.
Use concrete mapping templates. Each mapping should state the rule, the exact telemetry fields relied on, the detection logic, and an initial severity rating. The goal is that any engineer or reviewer can follow the mapping and reproduce how an alert was generated without ambiguity.
Translate each rule into explicit logging and detection requirements, centralize and standardize telemetry so signals can be correlated, protect and retain raw audit records, and operate SLO-driven alerting with documented runbooks to keep detection actionable.
SLO and error-budget approaches to reduce false positives
High-performing teams use SLO-driven approaches to prioritize alerts and reduce noise. By defining service-level objectives for detection quality and using an error budget to govern the rate of allowable false positives, teams can focus tuning efforts on the most impactful signals and avoid alert fatigue 2024 Accelerate State of DevOps Report.
An SLO-based approach treats alerting as a product: set an objective for mean time to triage and an acceptable false-positive rate, then iterate on detection logic and thresholds to meet those objectives. This creates a measurable feedback loop that reduces burnout and improves the signal-to-noise ratio for compliance alerts.
Runbooks and use-case driven alert tuning
Alert tuning without operational procedures is incomplete. Documented runbooks and playbooks let responders act quickly when a compliance alert fires. The SANS survey emphasizes the importance of alert tuning, runbooks, and defined investigation workflows for keeping monitoring actionable and reducing time-to-triage 2024 SANS SOC Survey.
Make runbooks concise and copy-paste ready. For each alert include the detection logic, initial triage steps, expected evidence to collect, escalation paths, and common false-positive causes. Schedule regular tuning cycles tied to runbook reviews so the runbooks evolve as the detection logic improves.
How to decide what to monitor and how to prioritize alerts
Risk and materiality criteria for selecting signals
Prioritization starts with risk and materiality. Use criteria such as business impact, likelihood of occurrence, legal or regulatory requirements, and investigation value to rank which rules to instrument first. Events that directly affect sensitive data or critical controls should typically receive higher priority for instrumentation and longer retention.
Document a simple matrix that teams can apply when deciding what to monitor. For example, assign scores for impact and likelihood, and calculate a priority score that teams can use to plan instrumentation work in quarterly sprints.
Balancing retention costs with regulatory needs
Retention tradeoffs are practical realities. Store high-value audit records in append-only archives with longer retention while keeping short-term, high-volume telemetry in cheaper, queryable stores with shorter retention windows. Document minimum retention durations aligned to governance needs and the regulatory landscape to avoid ad hoc decisions during incidents.
When you must reduce retention for cost reasons, prioritize preserving fields that are critical to investigations, such as user identifiers, timestamps, and request or transaction identifiers. Those minimal fields let you reconstruct events even if verbose payloads are discarded sooner.

Ownership and escalation paths for compliance alerts
Define clear ownership for each alert type so that every dashboard item ties to an accountable team. Ownership includes initial triage responsibilities, escalation paths, and the expected time-to-triage. This reduces ambiguity and ensures that alerts are actionable rather than informational noise.
Escalation paths should be typed by severity and impact. Low-severity alerts can be routed to platform owners for scheduled reviews while high-severity alerts go to a defined incident response channel with immediate on-call notification. Ensure that these ownership models are documented and discoverable from the dashboard metadata.
Telemetry and tooling patterns for reliable compliance dashboards
Standardizing telemetry with OpenTelemetry or similar
Adopt standardized telemetry formats to unify logs, metrics, and traces. See OpenTelemetry logging for recommendations. Standardization simplifies cross-system correlation and reduces the effort needed to maintain rule-to-signal mappings as services change. Observability reports show a trend toward using standard telemetry to improve queryability and correlation across systems Cloud Native Observability 2024.
Standard schemas make it easier to enforce required audit fields at ingestion, so the dashboard can reliably surface authentication events, privilege changes, and access logs without manual field normalization. This is particularly valuable in environments where many teams produce telemetry independently.
standardize telemetry with OpenTelemetry and a central immutable log store
keep ingestion schema minimal to reduce producer friction
Central log stores, immutable append-only archives, and correlation
Central log stores are the foundation for cross-system correlation. A design pattern that combines a queryable central store for active investigations with an immutable append-only archive for long-term preservation gives you both operational agility and forensic readiness. NIST AU controls describe the need for generating and protecting audit records to support correlation and review Security and Privacy Controls for Information Systems and Organizations (SP 800-53 Rev. 5). See centralized logging best practices like those documented by Logz.io Centralized Log Management Best Practices and Tools.
Ensure that correlation keys such as request identifiers or session IDs propagate across services and are captured in logs. That practice turns isolated log entries into an evidence trail that dashboards can visualize for investigators.
Integrations: SIEM, observability backends, and investigative tooling
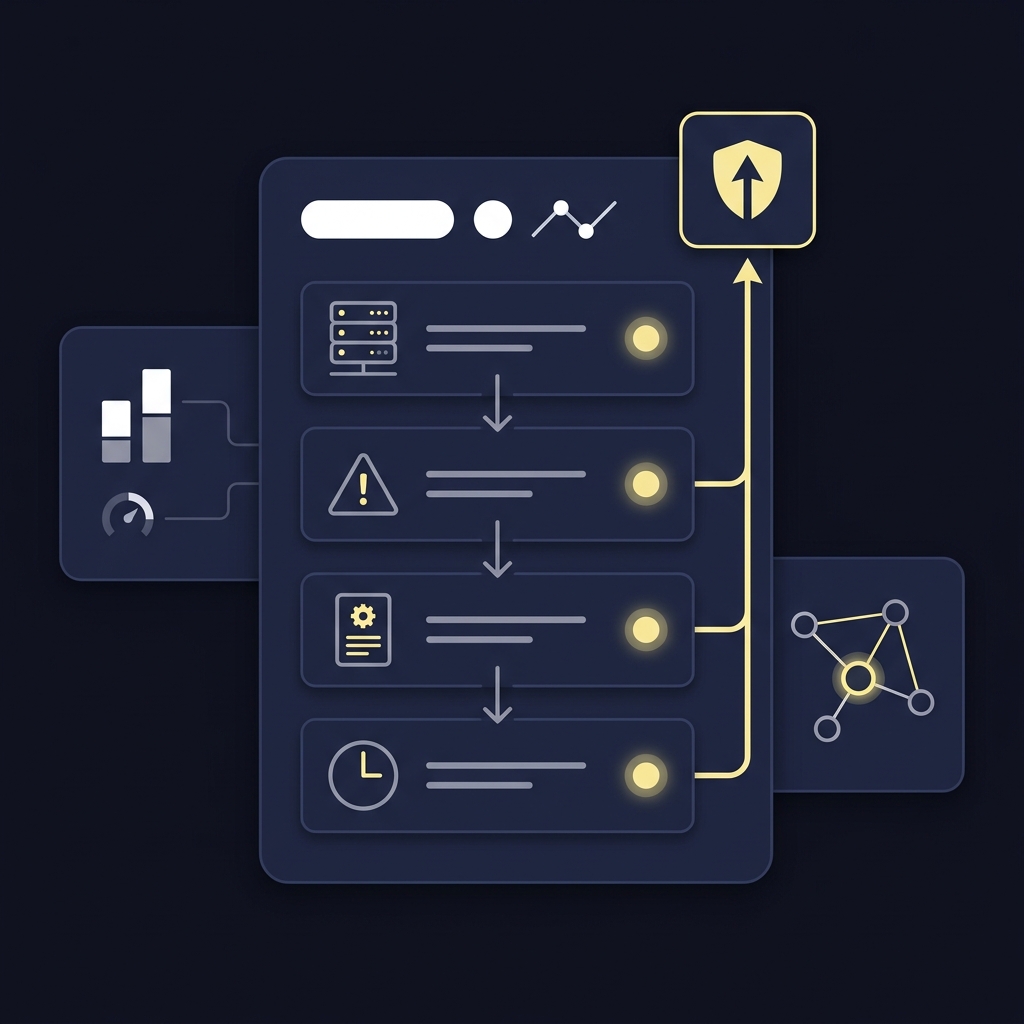
Integrate central telemetry with investigative tooling so analysts can pivot from a dashboard alert into raw audit records and traces without friction. Preserve provenance metadata during these handoffs so investigators can show how a dashboard signal maps to the original audit record.
When integrating systems, ensure that provenance information and integrity metadata travel with the event or are easily retrievable from the archive. This supports both internal investigations and external audits where demonstrating chain of custody is necessary.
Common mistakes and how to avoid them
Symptom: alert fatigue and noisy rules
One common mistake is creating alerts without a tuning plan or runbooks. Without ongoing tuning, alerts proliferate and responders ignore them. The SANS SOC survey highlights alert tuning and documented runbooks as essential to keeping alerts actionable 2024 SANS SOC Survey.
Remedy this by scheduling regular tuning cycles, using SLO-based prioritization to focus effort, and retiring alerts that do not provide investigation value. Clear runbooks reduce time-to-triage and make it easier to validate whether an alert should be adjusted or kept.
Symptom: missing telemetry that breaks investigations
Another frequent error is missing or inconsistent telemetry, which creates blind spots during investigations. When essential fields are not collected, correlation falls apart and investigators spend excessive time reconstructing events. CIS guidance recommends documenting which events must be logged and enforcing those requirements centrally CIS Critical Security Controls v8.1.
Mitigate instrumentation gaps by defining minimal schemas, adding checks at ingestion that reject or enrich incomplete events, and prioritizing instrumentation work for signals with the highest investigation value.
Symptom: weak protections for audit data
Insufficient protection or unclear retention rules can render audit logs unusable for compliance. If logs can be altered or deleted without trace, dashboards lose credibility as sources of evidence. A defensible approach combines append-only storage, integrity checks, and access controls so audit records remain reliable.
Operationalize protections with automated integrity verification, role-based access, and regular audits of retention settings. These steps make dashboards not only useful day to day but also defensible during formal reviews.
Practical playbooks and next steps to improve your compliance dashboard
Runbook example for a privilege-change alert
Runbook: Privilege-change detection
Detection logic: alert when a privileged role change event occurs outside scheduled maintenance windows or without an associated approval record. Initial triage steps: confirm user identity, retrieve the privileged change event, check for approval artifacts, and collect related authentication events for the same user around the change. Escalation: if approval is missing and change affects critical systems escalate to on-call security and platform owners.
Keep the runbook concise and include quick commands or links to the dashboard queries that retrieve the required raw audit records. See the Funded Plays blog for examples.
A quarterly schedule for log review and alert tuning
Adopt a quarterly cadence that includes scheduled log reviews, alert tuning sessions, and SLO evaluations. In a typical cadence, month one focuses on instrumentation gaps and missed fields, month two prioritizes high-noise alerts for tuning, and month three reviews SLOs and retention policy alignment. Tying work to a regular cadence prevents technical debt from accumulating.
During each quarter run a short retrospective that measures mean time to triage, the number of false positives, and the percentage of alerts covered by runbooks. Use these indicators to prioritize the next quarter's work and refer to how Funded Plays evaluations work for an example review process.
How to measure improvement and close the loop
Define measurable indicators such as mean time to triage, change in false-positive rate, coverage of rules by telemetry, and the percentage of alerts with an attached runbook. Track these over time and use them in retrospective meetings to decide which detections to refine or retire. DORA research shows that teams who measure and iterate on these indicators make tuning more systematic and sustainable 2024 Accelerate State of DevOps Report.
Closing the loop means using measured outcomes to adjust logging requirements, refine rule-to-signal mappings, and update runbooks so the compliance dashboard steadily improves in signal quality and investigative value. For more, see Funded Plays.
Collect authentication attempts, privilege changes, access events, configuration changes, and key system events that provide identity, time, and request context.
Retention depends on regulatory and governance requirements; set explicit minimums per event class and preserve fields essential for investigations even if verbose payloads are truncated earlier.
SLOs make alerting measurable by setting objectives for detection quality and allowable false positives, guiding tuning efforts and improving signal-to-noise over time.
References
- https://csrc.nist.gov/publications/detail/sp/800-53/rev-5/final
- https://www.cisecurity.org/controls/v8-1
- https://www.cncf.io/reports/cloud-native-observability-2024/
- https://dora.dev/research/2024/
- https://www.sans.org/white-papers/2024-soc-survey/
- https://www.fundedplays.com/challenges
- https://opentelemetry.io/docs/specs/otel/logs/
- https://cloud.google.com/blog/products/devops-sre/how-to-centralize-log-management-with-cloud-logging
- https://logz.io/blog/centralized-log-management-best-practices-and-tools/
- https://www.fundedplays.com
- https://www.fundedplays.com/blogs
- https://www.fundedplays.com/blogs/how-fundedplays-evaluations-work