
What account performance metrics are and why they matter - How to Interpret Account Performance Metrics
Quick glossary of core terms
Account performance metrics are standardized indicators that describe ad exposure, engagement, cost, conversions, and the value those conversions produce. Clear, consistent definitions matter because a change in a reported value may reflect a changed formula, a different reporting scope, or a genuine performance shift.
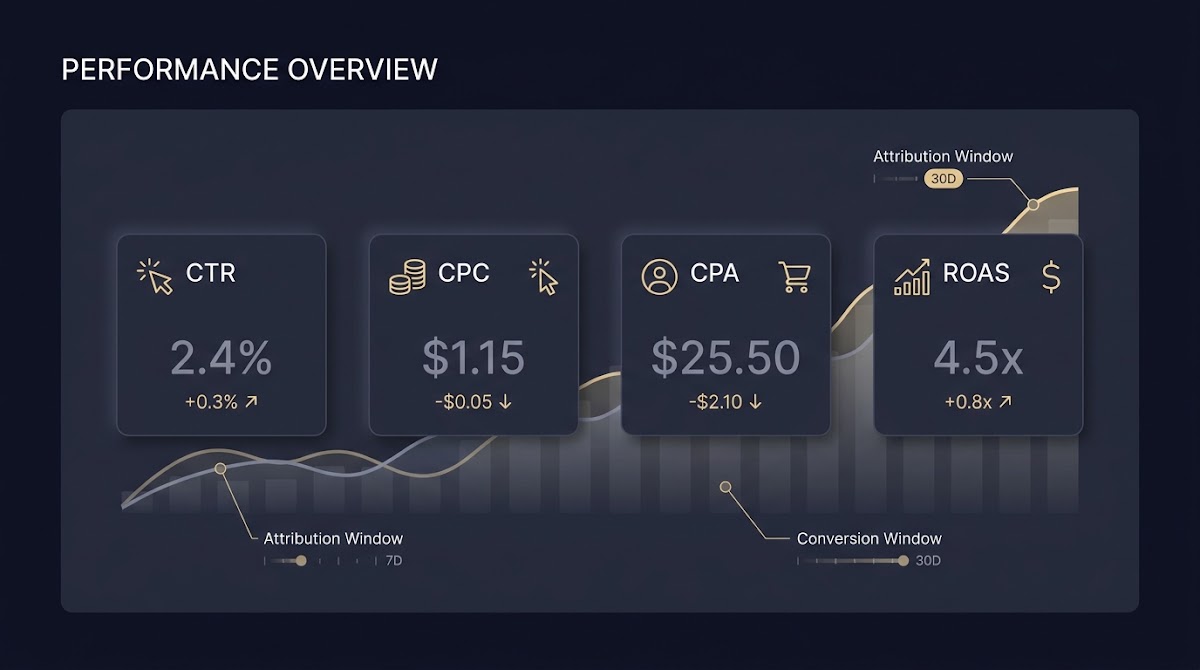
Start with these baseline definitions: impressions measure how often an ad is shown, clicks count direct interactions, click-through rate or CTR is clicks divided by impressions, cost-per-click or CPC is total cost divided by clicks, cost-per-acquisition or CPA is cost divided by conversions, conversions are the counted completion events you define, and return on ad spend or ROAS divides conversion value by cost. Confirm platform formulas and naming before analysis; platform documentation contains the canonical definitions you should use for verification Microsoft Advertising definitions.
How metrics fit into decision making

These KPIs inform different choices: impressions and CTR help evaluate creative and targeting reach, CPC and CPA describe efficiency, conversions and conversion value link activity to business outcomes, and ROAS measures revenue efficiency. Choosing which metric to prioritize should map to your objective, for example using CPA when the goal is efficient user acquisition versus ROAS when revenue per dollar matters. Review the platform conversion-value logic when aligning metrics to goals Google Ads conversion tracking.
Scope and reporting boundaries to check first
Scope and reporting boundaries to check first
Before comparing periods or channels, verify the reporting window, conversion windows, included channels, and whether conversions are deduplicated across devices. Differences in these scopes are the most common reason dashboards disagree and a frequent source of false positives when interpreting trends. Always note the date ranges, attribution window, and whether cross-device deduplication is applied in the report source; platform help centers explain default scopes and how to adjust them Microsoft Advertising definitions.
Core paid-media KPIs: formulas, limits, and common pitfalls
How to calculate each KPI step by step
Calculate CTR as clicks divided by impressions, typically expressed as a percentage. CPC is total cost divided by clicks. Conversion rate equals conversions divided by clicks or sessions depending on your chosen denominator. CPA is cost divided by conversions. ROAS is conversion value divided by cost, and conversion value is the monetized value you attach to a conversion event. Confirm whether an account uses last-click, data-driven, or another attribution method when computing conversion-derived metrics, because that affects denominators and assigned conversion counts Google Ads conversion tracking.
These formulas are straightforward, but reporting limits and definitions vary. For example, a platform may include only last 30-day conversions by default or may attribute conversions across devices differently. When a dashboard shows an unexpected ROAS swing, start by checking whether the conversion value definition or attribution window changed between comparison periods Microsoft Advertising definitions.
Where reporting scopes diverge across platforms
Where reporting scopes diverge across platforms
Common divergence points include attribution windows, whether view-through conversions are counted, cross-device deduplication, and the set of conversion actions included in a report. Two platforms can report different conversion totals for the same time period without either being wrong; they simply apply different scopes. When you reconcile numbers, document for each data source the default attribution model and the conversion actions included so you can compare like with like GA4 attribution documentation.
Practical checks to validate numbers in dashboards
Practical checks to validate numbers in dashboards
Adopt a short validation checklist you can run before acting on a trend: 1) confirm date ranges and timezones; 2) confirm attribution model and conversion windows; 3) compare raw event counts or transaction rows if available; 4) run a sample query against the underlying export or BigQuery table for key metrics; 5) check for recent tag or consent changes. If a sanity check fails, escalate to the platform documentation or engineering owners to avoid misdiagnosis Microsoft Advertising definitions.
Copy this short KPI validation checklist into your dashboard review playbook to make reconciliations routine and repeatable.
Copy the KPI validation checklist
Copy or download the KPI validation checklist to paste into your weekly dashboard review and save time on reconciliation.
Attribution in Google Analytics 4: what a model change looks like
Data-driven attribution explained
Google Analytics 4 defaults to data-driven attribution, which distributes credit across multiple touchpoints based on observed patterns rather than giving all credit to the final touch. That means the same conversion can be reported with different channel credit before and after a model change, even if user behavior did not change. When you see sudden shifts in channel shares, first confirm whether the attribution model or model settings changed About attribution in GA4.
How model changes reassign credit and what that means for reports
How model changes reassign credit and what that means for reports
A change from last-click to data-driven attribution typically reallocates some credit back to upper-funnel channels and touchpoints that previously received little credit. This redistribution can make acquisition channels look weaker or stronger depending on prior attribution assumptions. Treat model change events as an administrative change and avoid immediate budget moves until you compare consistent model outputs and confirm incrementality with experiments where possible About attribution in GA4.
Practical comparison approach: default vs alternative models
Practical comparison approach: default vs alternative models
To diagnose attribution-driven variance, produce a side-by-side table of conversions and conversion value under the default model and under a consistent alternative such as last-click. Export both views for matched date ranges and compute percentage differences by channel. Record the attribution model used in every report so your team can track whether a drift is methodological or behavioral. Documenting model changes preserves comparability over time and reduces reactionary optimization About attribution in GA4.
Using experiments to prove incrementality: conversion lift basics
What conversion lift measures and how it differs from attribution
Conversion lift measures the incremental conversions caused by exposing a randomized test group to an ad treatment versus a control group that does not receive the treatment, producing an estimate of causal impact that attribution models cannot guarantee. Because lift tests randomize exposure and compare outcomes, they isolate incrementality from correlated demand signals, which is essential when attribution models reassign credit across touchpoints Google Ads conversion lift.
Design elements: randomization, test/control, measurement window
Design elements: randomization, test/control, measurement window
Key design elements are strict randomization, adequate sample size, a stable measurement window that covers the expected conversion lag, and control of external campaign changes during the test. Platform-run conversion lift experiments typically automate random assignment but require careful sizing and a stable environment for reliable results. For common pitfalls and design constraints, consult the platform guidance on conversion lift implementation Google Ads conversion lift.
Check reporting scope, attribution model, and conversion windows first; run sanity checks against raw exports; and validate suspected causal impact with a conversion lift experiment or aggregate MMM when appropriate.
Limits and common misinterpretations
Limits and common misinterpretations
Conversion lift tests estimate the average incremental effect for the tested audience and timeframe; they do not necessarily provide a perfect estimate for all segments or future periods. Small or unstable samples, concurrent creative changes, or shifting market conditions can bias lift results. Use lift tests to complement attribution and MMM rather than to replace careful triangulation of measurement methods Nielsen annual marketing report.
Marketing mix modeling: an aggregate, privacy-resilient complement
What MMM estimates and how it differs from attribution and experiments
Marketing mix modeling (MMM) uses aggregated time-series data to estimate each channel's contribution to outcomes while controlling for seasonality, trends, and external drivers. Unlike user-level attribution or randomized experiments, MMM operates on aggregate inputs and remains relatively robust to signal loss from privacy controls, making it a useful complement to channel-level methods A marketer's guide to MMM.
How MMM controls for seasonality and external factors
How MMM controls for seasonality and external factors
MMM incorporates control variables for seasonality, promotions, weather, and macro indicators so the model separates campaign-driven lifts from predictable calendar effects. This helps avoid misattributing seasonal revenue swings to marketing activity and supports budget allocation decisions that consider external factors beyond short-term attribution signals A marketer's guide to MMM.
When to use MMM alongside other methods
When to use MMM alongside other methods
Use MMM when you need cross-channel, aggregate evidence for long-term budget decisions or when signal loss makes user-level attribution unreliable. MMM does not replace lift testing; instead, it provides a Big Picture view that complements experiments and attribution, especially for strategic planning and controlling for external drivers Nielsen annual marketing report.
Trend analysis and segmentation: avoid false signals
Segment by device, geography, audience, and placement
Slicing trends by device, geography, audience cohort, and placement reveals shifts that aggregate metrics hide. For example, a drop in desktop conversions may be offset by mobile gains, or a geo-level ad delivery issue may depress overall CPA. Regularly include at least device, region, and audience segments in your standard reports to surface these patterns early Microsoft Advertising definitions.
Account for lag effects and reporting windows
Account for lag effects and reporting windows
Conversions can lag media exposure, so short reporting windows can undercount outcomes for longer-funnel conversions. When comparing recent periods, align conversion windows and consider cohorting by exposure date to avoid mismatches. Smoothing short-term noise with rolling averages and examining cohort conversion curves reduces overreaction to single-day volatility Nielsen annual marketing report.
How to set up reproducible trend checks
How to set up reproducible trend checks
Create a reproducible query or spreadsheet that produces rolling averages, cohort conversion curves, and side-by-side segment comparisons for defined windows. Save the query and export snapshots for weekly and monthly comparisons so you can trace when a shift first occurred and what changed in attribution, creative, or audience. Establishing reproducible checks reduces ad hoc analysis and improves decision confidence A marketer's guide to MMM.

repeatable smoothing and cohort checks for trend validation
Use rolling means and cohort curves for clarity
Choosing optimization metrics and documenting changes
Map business goals to optimization metrics (CPA vs ROAS)
Select optimization metrics that align with your objective: CPA for acquisition efficiency goals where a fixed cost per user matters, ROAS when you need to maximize revenue per advertising dollar, and conversion rate or LTV-derived targets when long-term value matters. Linking metric choice to clear business outcomes avoids chasing misleading short-term signals Google Ads conversion guidance.
How to incorporate conversion value and lifetime value into metric choice
How to incorporate conversion value and lifetime value into metric choice
If you can estimate conversion value or lifetime value, fold these into conversion definitions and ROAS calculations so the optimization target reflects expected customer value rather than immediate transaction revenue. Where exact LTV is unavailable, use conservative value estimates and document assumptions so future recalibration is traceable A marketer's guide to MMM.
A documentation checklist to preserve comparability
A documentation checklist to preserve comparability
Maintain a measurement ledger that records metric definitions, calculation formulas, attribution models, conversion windows, timezones, and any experiment flags. A short template can live in your analytics repo and should be updated whenever you change a tag, model, or KPI so historical comparisons remain meaningful GA4 attribution documentation.
Common mistakes, a reproducible checklist, and next steps
Most common interpretation errors and how to fix them
Frequent errors include mixing attribution models between reports, ignoring conversion lag, using inconsistent KPI definitions, and overreacting to noisy short-term swings. The fix is procedural: document definitions, run quick sanity checks, and confirm incrementality with experiments before making major budget moves Google Ads conversion lift.

A reproducible weekly and monthly performance review checklist
A reproducible weekly and monthly performance review checklist
Weekly checklist: confirm date ranges and timezones, run the KPI validation checklist, check segment-level trends for device and region, review any active experiments, and snapshot raw event exports for anomalies. Monthly checklist: run attribution comparisons, review experiment outcomes, assess need for MMM or larger-scope analysis, and update the measurement ledger Microsoft Advertising definitions.

Where to look next: experiments, MMM, and documentation best practices
Where to look next: experiments, MMM, and documentation best practices
When attribution and surface signals disagree, prioritize a mixed approach: validate channel claims with conversion lift where feasible, commission an MMM for strategic cross-channel allocation, and keep meticulous documentation to preserve comparability. Combining attribution, experiments, and aggregate modeling produces a more reliable picture than any single method alone Nielsen annual marketing report.
CPA measures cost per acquisition and suits efficiency goals, while ROAS measures return on ad spend and suits revenue-efficiency goals; choose based on the business objective and include conversion value where possible.
Run a conversion lift test when you need causal evidence of a channel's incremental impact and you can randomize exposure with adequate sample size and a stable testing window.
Update the measurement ledger whenever you change attribution models, conversion definitions, tracking tags, or significant campaign structures, and review it at least monthly.
References
- https://learn.microsoft.com/en-us/advertising/reporting/concepts/advertising-metrics-definitions
- https://support.google.com/google-ads/answer/1722022
- https://support.google.com/analytics/answer/10596865?hl=en
- https://support.google.com/analytics/answer/10596866
- https://support.google.com/google-ads/answer/13448195
- https://www.nielsen.com/insights/2024/annual-marketing-report-2024/
- https://www.thinkwithgoogle.com/marketing-strategies/data-and-measurement/guide-to-marketing-mix-modeling/
- https://www.fundedplays.com/challenges
- https://www.fundedplays.com/blogs
- https://www.fundedplays.com/blogs/how-fundedplays-evaluations-work
- https://www.fundedplays.com