
How to evaluate a strategy with limited data: what 'limited data' really means
Definitions and common scenarios, How to Evaluate a Strategy with Limited Data
Start by naming what you mean by limited data. In strategy testing a data set is limited when the number of independent events is small enough that chance produces large swings in measured performance. This happens often in sports prediction when a new prop market has only a few dozen outcomes, or when a player stat appears only intermittently. Calling a data set limited is not a failure, it is a descriptor that tells you to expect high sampling variability and to avoid over-precise claims.
Small sample inference focuses on how sampling error grows as sample size shrinks. Two simple indicators that data are limited are wide outcome swings across short periods and strong sensitivity to single events. Practitioners watching a virtual bankroll or evaluation challenge should treat single wins or losses as weak evidence and rely on methods that quantify uncertainty instead.
Quick bootstrap script outline for beginners
Run with small iterations first
Practical signs of limited data include metrics that move widely when you remove one or two observations, inconsistent results across subperiods, and metrics with standard errors that are a large fraction of the point estimate. Keep these signs in mind before you change risk controls or scale up a strategy.
When you read short-run results as if they were definitive, you risk scaling into a strategy that was only lucky. In challenge-driven platforms where progression depends on performance over a defined horizon, the consequences are practical. Mistaking luck for skill can lead to poor position sizing decisions, larger drawdowns, or repeated failure to meet progression rules.
Evaluation challenges and virtual bankrolls impose fixed objectives and drawdown limits. Those rules mean you should align your evaluation tempo with the platform progression rules. If a challenge requires a small number of events to pass, adopt conservative thresholds and document your assumptions so you can explain decisions later. Transparent rules and holdout testing become more important than raw short-run results.

Conservative choices reduce the chance of overcommitting to an apparently promising strategy. In practice that means smaller initial sizes, staged scaling, and explicit minimum-sample requirements before large allocation changes. Treat early results as a learning phase rather than final proof of a method.
Sampling error is the variation you expect just from chance. With few events this variation can mimic real improvements or declines. The key is to ask how big the observed change is relative to expected sampling error. If the observed difference is small compared with expected variability, it is likely noise.
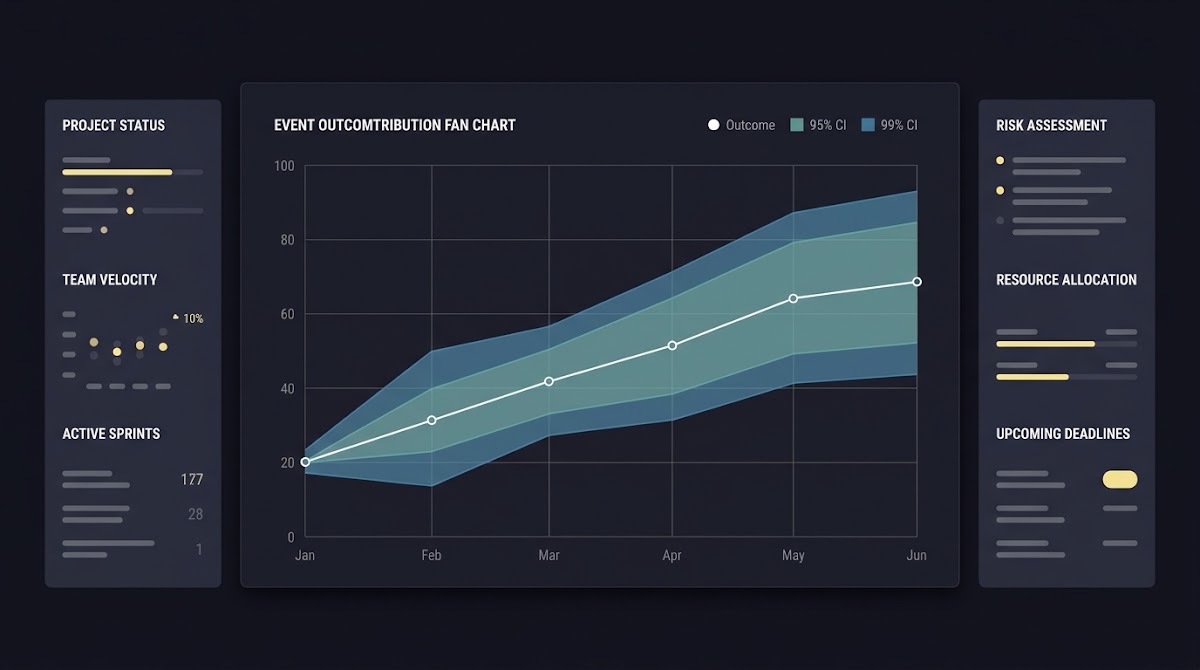
Confidence intervals, or credible intervals in a Bayesian framing, express the range of plausible values for the true metric given your data. With limited data these intervals widen, which is useful because it forces honesty about uncertainty. Presenting ranges instead of single numbers prevents overconfident decisions and helps stakeholders understand the probability of different outcomes.
Evaluate whether intervals are narrow enough to support your intended action and use minimum sample rules, staged scaling, or conservative priors when in doubt.
Bias and variance are two ways estimates can be wrong. Bias pushes results consistently away from the true value, for example because a backtest uses stale assumptions. Variance is high when results change a lot from sample to sample, which is common with small data. Complex models increase variance and often overfit sparse historical windows. Prefer simpler rules early, then add complexity as more evidence accumulates.
A step-by-step framework to evaluate a strategy with limited data
Step 1: Define success metrics and horizons
Decide on one clear primary metric before testing, such as win rate, expected value per event, or maximum drawdown over a horizon. Define the horizon in terms of events or time and ensure it aligns with the platform's progression rules. A pre-specified metric and horizon prevent post-hoc storytelling about what worked.

Set pass and fail thresholds before you look at the full results. Choose conservative cutoffs that reduce the risk of false positives. For example, set a higher minimum win rate or a tighter drawdown cap in early testing so that only robust signals pass initial screening. Document these guardrails so decisions remain transparent.
Select at least two methods to quantify uncertainty: an analytic approximation if available, resampling techniques like bootstrap resampling, and simple simulation. Combining methods helps confirm that uncertainty estimates are not an artifact of one approach. Use the larger uncertainty estimate for conservative decision-making.
Practical techniques you can use right away: bootstraps, cross-validation, and simulation
When to use bootstrap resampling
Bootstrap resampling helps estimate sampling variability when analytic formulas are unreliable or hard to derive. The basic idea is to resample your observed events with replacement and recompute your metric many times. The distribution of those recomputed metrics approximates the sampling distribution you would observe if you could repeat the experiment many times. See an example study of bootstrap methods for more on small-sample bootstrap applications.
Cross-validation approaches for time-ordered events
Standard cross-validation that shuffles data breaks time order and can overstate performance for sequential sports events. Use blocked or rolling cross-validation that preserves temporal order so that you test on later events using earlier events only. This maintains the causal structure and provides more realistic performance checks. For a practical discussion of model evaluation approaches see ML model evaluation.
Explore FundedPlays Challenges and structured evaluation programs
Try a short bootstrap exercise: resample your event outcomes 500 times and plot the resulting metric distribution to see how wide plausible values are. Use that visual as your uncertainty check.
Monte Carlo simulation fills gaps by sampling plausible outcomes from an assumed process. Keep assumptions conservative and test alternative parameter choices. Simulation is not proof, but it helps you understand how extreme runs and drawdowns might look under different realistic regimes. Use simulation to test whether guardrails hold under plausible stress scenarios.
Bayesian updating and using priors sensibly with small samples
Intuition behind Bayesian updating
Bayesian updating combines prior belief and observed evidence into a posterior estimate. With small samples the prior helps stabilize estimates so that early observations do not produce extreme swings. Think of the prior as a mild regularizer that pushes estimates toward reasonable baseline expectations until enough data accumulates to overcome it.
Choosing weakly informative priors
Pick priors that reflect reasonable ranges without being dogmatic. A weakly informative prior nudges estimates toward a plausible center but still allows strong data to move the posterior. Document why you chose a prior and test sensitivity to different reasonable priors to show that conclusions are not driven solely by the prior choice.
How priors reduce extreme swings in early results
In early stages a strong but sensible prior prevents a few lucky wins from producing an overly optimistic estimate. As more events accumulate the posterior converges toward the sample evidence. This property makes Bayesian updating helpful for staged decision rules where you want to avoid sharp shifts in exposure based on a handful of outcomes.
Decision criteria and risk rules to apply when evidence is scarce
Conservative thresholds and minimum sample rules
Require a minimum number of independent events before making a scaling decision. If a platform's progression timeline is short, build internal minimums that exceed the challenge requirement so you avoid premature scaling. Use guardrails such as a minimum effective sample size or a minimum number of wins and losses so decisions rest on more than a few outcomes.
Drawdown limits, position sizing, and stop rules
Use progressive sizing that increases allocation only after passing staged checkpoints. Apply a strict drawdown limit to prevent a lucky streak from encouraging oversized positions. Stop rules and max drawdown protections keep capital or reputation intact while you gather evidence.

Create a simple matrix that maps evidence strength to actions: keep testing with limited exposure, increase size slowly if evidence strengthens, or pause and reassess if signals fade. Make the matrix operational by defining numeric thresholds and the monitoring cadence that triggers re-evaluation.
Common mistakes and cognitive traps when testing on small data
Cherry picking and post-hoc rationalization
Cherry picking appears when you sift results until something looks good and then present that slice as representative. Pre-register test rules and metrics to avoid this trap. Keep a running log of hypotheses that you tried and reject those that were tweaked after seeing outcomes.
Misreading streaks and hot-hand illusions
Short streaks are often not evidence of a persistent skill. Use resampling methods to ask how likely a streak is under a null model of no skill. If the streak is plausible by chance alone, treat it as weak evidence and avoid increasing exposure based on it.
Overfitting to a small historic window
Complex models tend to fit idiosyncrasies in small samples. Prefer simpler decision rules early and add complexity only when new data supports it. Cross-validate with time-aware splits to check that your model generalizes across different subperiods.
How to build small, realistic case studies and scenarios
Constructing synthetic examples
Build synthetic case studies by bootstrapping observed events or constructing simple parametric models that match the main features of your data. Preserve the time structure and any serial dependence that matters. Synthetic examples let you explore how a strategy behaves under repeated sampling without waiting for more real events.
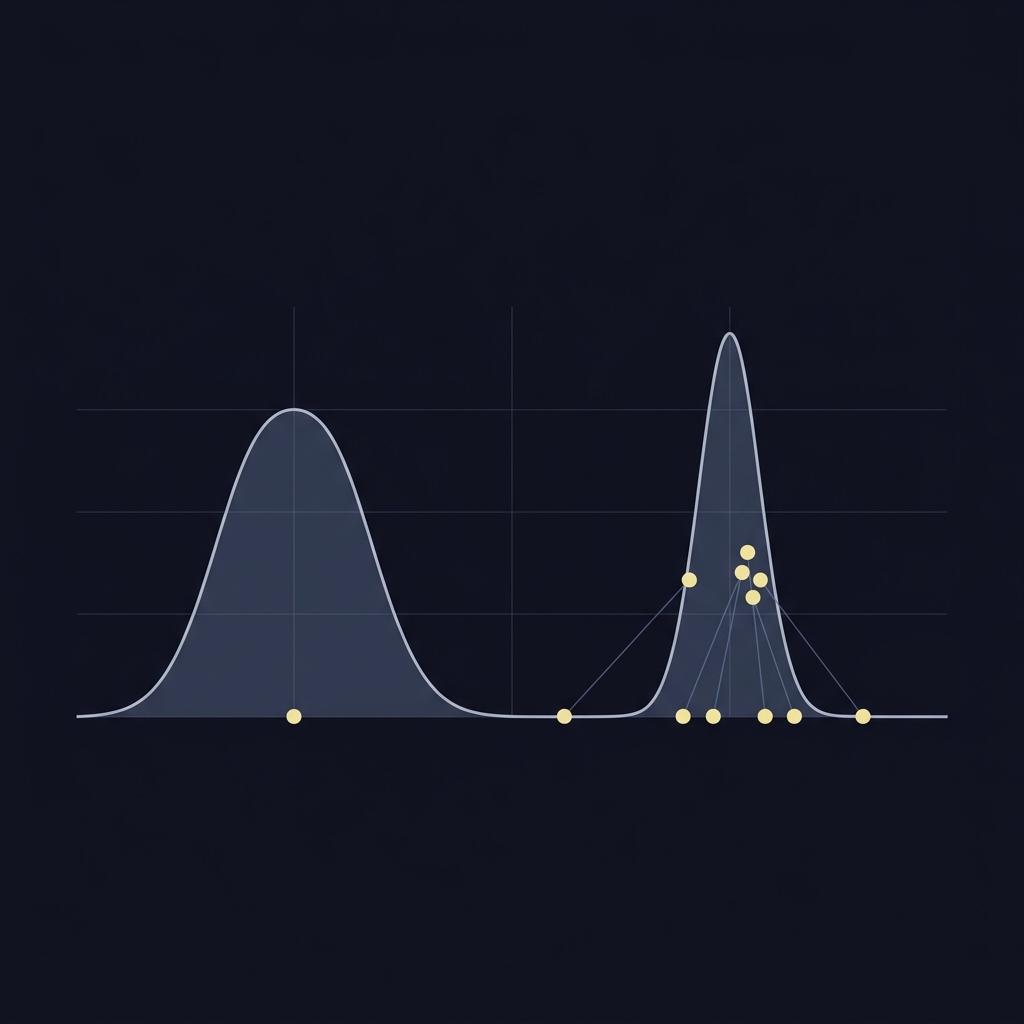
Design stress tests that insert rare but plausible outcomes to see how the strategy handles extreme scenarios. For example, simulate a cluster of bad outcomes or an unanticipated market closure. Use those results to set conservative drawdown limits and to decide whether the strategy can tolerate tail events.
Keep a short, reproducible record for each case study: the data used, assumptions made, steps in your procedure, and the decision you reached. Clear documentation speeds future re-assessment and helps teammates understand why a decision was made under uncertainty.
Typical sports-focused scenarios: three short examples to practice on
Scenario A: New prop market with 50 recorded events
Metric: event-level win rate and expected value per event. With only 50 events expect wide confidence intervals and high sampling error. Suggested test: run bootstrap resampling to produce a distribution of win rate and compute the fraction of resampled metrics that exceed your pass threshold. Next steps: continue collecting data, use conservative sizing, and re-run the bootstrap periodically.
Scenario B: Strategy after a major rule change in a league
Metric: stability of historical edge post change. The rule change may invalidate old data. Use a holdout that includes only events after the rule change and treat pre-change data as prior information only. Suggested test: simulate outcomes under a range of post-change parameters and apply staged scaling if simulated performance is robust.
Scenario C: Testing a niche player statistic with sporadic data
Metric: rate of a rare event per appearance. Sparsity amplifies variance. Use Bayesian updating with a weakly informative prior and compute credible intervals for the rate. If credible intervals remain wide, limit exposure and use the metric as a secondary signal rather than a primary driver.
When to collect more data and when to accept uncertainty
Signals that you need more samples
If confidence intervals for your primary metric include both desired and undesired outcomes, more data will likely change your decision. Another sign is when sensitivity checks flip conclusions for small reasonable changes in assumptions. In such cases prioritize data collection before scaling.
Cost-benefit of waiting versus acting
Assess the opportunity cost of waiting against the downside of a wrong decision. If scaling quickly exposes you to large irreversible losses, waiting or staged scaling is preferable. If the cost of delayed action is small, collect additional evidence first. Make this tradeoff numeric where possible to avoid vague instincts.
When you must act, apply interim rules: limit exposure, require frequent re-evaluation, and implement conservative stop rules. Treat early operations as experiments with predefined checkpoints where you reassess evidence and adjust sizing.
How to interpret and communicate results with honest uncertainty
Presenting intervals not point estimates
Report ranges and likelihoods rather than single numbers. A short sentence that gives the point estimate and the interval conveys both information and humility. This habit prevents stakeholders from treating noisy early numbers as certainties.
Framing findings for stakeholders or teammates
Use concise summaries that list assumptions, sensitivity checks, and recommended actions. Show how results might change with a small amount of new data. This makes it easier for teammates to understand why you prefer staged actions or further testing.
Writing concise conclusions and next steps
End reports with a clear action item list: continue data collection, run a bootstrap next week, or reduce exposure until more evidence is available. A short decision-oriented conclusion helps translate uncertain analysis into operational steps.
Applying these principles inside funded challenge platforms
How challenge rules change test design
Challenge platforms use fixed objectives and drawdown rules that affect both timing and acceptable risk. Design evaluations that respect those rules, for example by aligning your horizon and risk controls with the challenge requirements (see how Funded Plays evaluations work).
Maintaining discipline while pursuing progression
Discipline matters more than short-term wins. Use staged scaling, minimum sample rules, and documented guardrails so you can pursue progression responsibly. If a platform requires rapid progress, adopt conservative internal thresholds to avoid premature failure. See Funded Plays for more on platform details.
Documenting performance for review and appeals
Keep clear logs of each decision, trades or predictions, timestamps, and rationale. If a platform offers review or appeals, a good audit trail makes it easier to explain why you followed a particular path and that you complied with rules. This documentation also helps you integrate future data without redoing earlier logic.
A compact checklist and next steps
Pre-test checklist
Define a primary metric and horizon, set minimum sample and pass thresholds, choose uncertainty methods, and pre-register the test procedure. Prepare simple scripts for bootstrap resampling and simulation so you can run them repeatedly as new data arrives.
During-test monitoring
Monitor the primary metric, its interval, drawdown behavior, and sensitivity to single events. Re-run resampling after each batch of new events and compare posterior or interval evolution. Keep a short running log of any changes to assumptions.
Post-test documentation and decisions
Summarize the final estimate with intervals, list sensitivity checks, and state a clear decision with action steps. If you choose to continue testing, define the next checkpoint and the monitoring cadence that will trigger it.
Final thoughts: how to build judgement while respecting uncertainty
Balancing learning with protection of capital or reputation
Treat limited-data testing as an opportunity to learn while protecting capital or reputation. Use conservative sizing and explicit stop rules so that early exploration cannot cause outsized harm. Over time, disciplined accumulation of evidence builds a track record you can trust more than first impressions.
Iterative improvement over time
Record failures and successes in a reproducible way and revisit priors and assumptions as more data arrives. Iterative improvement means making small, testable changes and assessing their impact with consistent metrics and uncertainty estimates.
Where to read or learn more
For readers who want deeper methods, explore resources on Bayesian updating, bootstrap resampling, and sequential testing. Practical study combined with disciplined logging and staged experiments will improve judgement over time. See an overview of bootstrap estimates at ScienceDirect, and check our blog for related posts.
There is no universal cutoff; focus on whether your confidence intervals are narrow enough to support decisions and use minimum sample rules tailored to your risk tolerance.
Simulation helps explore scenarios but cannot fully replace real events; use it to supplement, not substitute, observed outcomes.
Prefer simple rules initially; complex models often overfit sparse data and increase variance until more observations are available.
References
- https://pmc.ncbi.nlm.nih.gov/articles/PMC6191021/
- https://sebastianraschka.com/blog/2016/model-evaluation-selection-part2.html
- https://www.sciencedirect.com/topics/mathematics/bootstrap-estimate
- https://www.fundedplays.com/challenges
- https://www.fundedplays.com
- https://www.fundedplays.com/blogs/how-fundedplays-evaluations-work
- https://www.fundedplays.com/blogs