
What this comparison answers and when to use it
When you need to rank or size two different trading opportunities, the goal is to compare them on a like-for-like basis. How to Compare Two Trades with Different Odds starts by converting quoted odds into a common probability scale, then removes bookmaker bias before computing expected value and risk-aware stake sizes.

This workflow helps when deciding between a single-bet choice, whether to add a position to a portfolio, or how to size stakes against a bankroll. It is a practical decision framework, not a prediction guarantee.
Key terms used here include implied probability, overround, and expected value. Converting differing odds formats to implied probability creates an apples-to-apples baseline, and removing the bookmaker margin prevents biased comparisons, which is crucial for fair evaluation Implied Probability: Definition, Formula, and Examples.
Read on for a concise checklist you can apply step by step, or use the worked example later in the article to see the method end to end.
Try the workflow with a practice challenge
Try the checklist in this article on a paper account before committing real funds; the steps are designed to be replicable and conservative.
Who benefits from an apples-to-apples trade comparison
Short-term pickers, portfolio managers, and anyone managing a defined bankroll benefit from converting odds into comparable metrics. This includes sports prediction participants who track consistency and risk over time.
When you compare raw quotes from different sources, apparent value can be driven by market margin rather than true edge, so standardization is the first step.

When simple EV is enough and when you need risk adjustments
Expected value is the baseline for long-run ranking of trades, but volatility and correlation matter for bankroll trajectory and drawdowns. Use EV for a basic ranking and add risk-adjusted checks when stakes, horizon, or correlations matter.
Why odds format and market source matter
Decimal, fractional, and American odds: different displays, same information
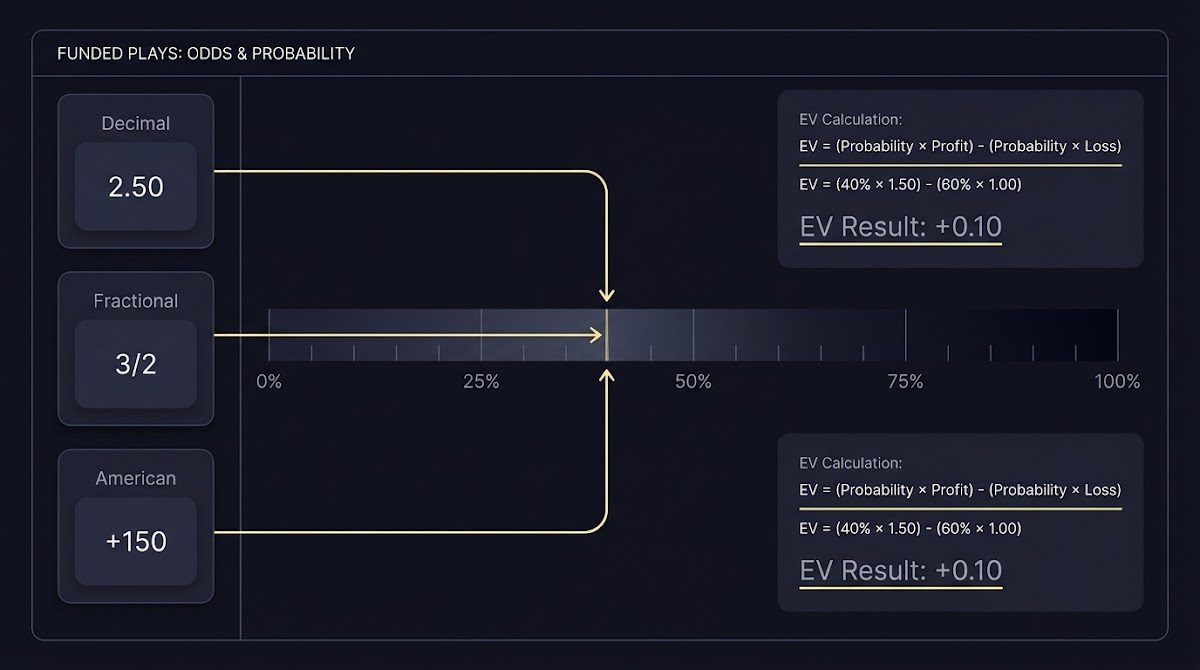
Odds can appear in decimal, fractional, or American formats, but each encodes the same underlying payoff information. Converting to implied probability lets you compare across formats without guesswork Implied Probability: Definition, Formula, and Examples.
Decimal odds show the return per unit staked; fractional odds show profit relative to stake; American odds show positive or negative values relative to a 100-unit baseline. All three can be mapped to a probability number with standard formulas.
How bookmaker pricing and market source affect implied probability
Different bookmakers and exchanges embed different margins into prices, producing quoted implied probabilities that sum to more than one. That bookmaker margin, or overround, biases raw implied probabilities and can make two identical true probabilities look different on paper Understanding betting margins and why they matter.
Because of this, comparing raw odds from different sources without normalization risks favoring the market with lower visible margin rather than identifying the true edge.
Step 1: Convert odds to implied probability
Start by turning both trades into implied probabilities. For decimal odds the formula is simple: implied probability = 1 divided by decimal odds. For fractional odds a/b, convert to decimal first as (a divided by b) plus 1, then apply the decimal formula. For American odds, use the standard conversion depending on sign, then convert to decimal and to probability Implied Probability: Definition, Formula, and Examples.
Keep precision consistent across both trades. For very small probabilities use at least three decimal places to avoid rounding artifacts that change EV calculations materially.
Convert both quotes to implied probabilities, remove book margin by normalization, compute EV per unit stake, size stakes with Kelly (use fractional Kelly if uncertain), and adjust for volatility and correlation before deciding.
Quick checklist for this step: confirm each quote format, apply the correct conversion, and record implied probabilities to consistent precision so later normalization is accurate.
Step 2: Remove the vig by normalizing probabilities
The bookmaker margin, or overround, pushes implied probabilities above their fair total. The simplest fix is normalization: divide each quoted implied probability by the sum of the quoted probabilities so the normalized probabilities sum to one. This rescales the probabilities to remove the embedded vig for fair comparisons Understanding betting margins and why they matter.
Normalization works well for two-outcome trades and for head-to-head markets where all outcomes are visible. If a market omits an outcome or mixes market types, adjust by estimating the missing outcome or using proportional scaling across visible outcomes.
Two common normalization methods are proportional scaling and margin-subtraction. Proportional scaling divides each implied probability by the sum of all implied probabilities; margin-subtraction reduces each implied probability by a constant share of the overround before renormalizing. The proportional approach is simpler and widely used in practice.
Document which method you used and why, because different normalization choices will change EVs and recommended stakes.
Step 3: Compute expected value per unit stake
Expected value for a binary trade expresses the average return per unit staked using normalized probabilities. For a trade that pays Payout Multiple when it wins and returns 0 otherwise, EV per unit stake = normalized probability times payout multiple minus the probability of losing times the stake, which simplifies to EV = p times m minus (1 minus p), where p is the normalized probability and m is the payout multiple Expected Value (EV): Definition, Formula, and Examples.
Compare EVs across both trades on a per-stake basis to see which has higher expected return. If stakes differ, compute EV per unit stake for each and then scale to planned stake sizes to compare absolute expectation.

Keep in mind EV is a long-run average. A positive EV indicates a statistical edge over many independent repetitions, not a guaranteed short-term win.
Step 4: Adjust for risk with the Kelly criterion and stake sizing
The Kelly criterion converts an edge into a recommended fraction of your bankroll to stake in order to maximize long-run growth. The basic Kelly fraction for binary outcomes uses edge and odds to compute the optimal fraction to invest, and it assumes your probability estimate is correct Kelly Criterion: Definition, Formula, and Example.
Because probability estimates are noisy and volatility can be high, many traders use fractional Kelly, for example half-Kelly or quarter-Kelly, to limit drawdowns and estimation error. Fractional Kelly retains the growth orientation while reducing the risk of large short-term losses.
Practical constraints such as stake limits, minimums, and correlated positions mean Kelly outputs are recommendations to be adjusted, not strict rules. Treat the Kelly fraction as a starting point and apply conservative anchors when uncertainty is material.
Step 5: Factor volatility and risk-adjusted metrics like the Sharpe ratio
Binary trades can be highly volatile because outcomes are all-or-nothing. Variance for a binary payoff depends on its probability and payout size, and that variance affects how often you will see runs of losses or wins even when EV is positive Expected Value (EV): Definition, Formula, and Examples.
The Sharpe ratio relates expected excess return to return variability and can help compare risk-adjusted returns across trades or strategies, although it assumes returns are roughly symmetric and may not capture skewed binary payouts well Sharpe Ratio: Definition, Formula, and Example.
Use Sharpe-like adjustments to rank trades when volatility and drawdown risk matter to your horizon. Remember the Sharpe is a complement to EV, not a replacement; it reframes expected return relative to variability.
compute EVs and a simple Kelly-based stake recommendation
use conservative risk fraction on noisy estimates
Combining trades: correlation, diversification, and non-additive risk
When EVs add and when they do not
EVs add when trades are independent. However, positive correlation between trades increases combined variance, which reduces diversification benefits and makes simple EV addition misleading in portfolio terms Correlation: What It Means in Finance, With Examples.
Before summing EVs, check whether the trades are conditionally linked by game script, player availability, or other common drivers. If they are positively correlated, treat combined positions with more conservative sizing or adjust variance estimates upward.
Practical checks for correlated props and same-game outcomes
Red flags for correlation include two props from the same game, bets on the same player, or outcomes that depend on the same event sequence. When you see these, consider reducing stake sizes or modeling joint probabilities explicitly.
Simple practical adjustments are down-weighting recommended stakes for correlated positions or computing an effective variance that inflates single-trade variance to reflect correlation.
Decision framework: combine EV, risk sizing, and portfolio context
A stepwise decision flow to choose between two trades
Follow a clear sequence: convert odds to implied probabilities, remove vig by normalizing, compute EV per unit stake, compute Kelly-based stake recommendations, check volatility and correlation, then decide which trade to take and at what size.

When trades are close in EV, prefer the one with lower variance or lower correlation to existing positions. Document assumptions and use fractional Kelly when probability estimates are uncertain to reduce drawdown risk.
How to document assumptions and sensitivity
Record the raw quotes, the conversion steps, normalization method, EV calculations, and the stake sizing logic. Then run sensitivity checks: shift each probability by a small amount and check how EV and recommended stakes change. This tells you whether your decision is robust to estimate error.
When small probability shifts flip the ranking, prefer conservative sizing or skip the trade unless you have high confidence in your estimates.
Common mistakes and pitfalls to avoid
One frequent error is comparing raw implied probabilities without removing the vig. That can produce false positives where a lower visible price looks better but in fact includes larger margin distortion Understanding betting margins and why they matter.
Another mistake is overleveraging based on noisy edges. Use fractional Kelly and acknowledge estimation error when translating EV into stake sizes Kelly Criterion: Definition, Formula, and Example.
Finally, ignoring correlation between trades can make a portfolio riskier than expected. Always check whether two trades share drivers and adjust sizing accordingly Correlation: What It Means in Finance, With Examples.
Worked example: two trades with different odds, step by step
We demonstrate a hypothetical comparison to show the workflow. Suppose Trade A is quoted at decimal 3.0 and Trade B at decimal 2.0. Convert odds to implied probability first: for decimals use 1 divided by decimal odds to get raw implied probabilities, then normalize to remove the overround Implied Probability: Definition, Formula, and Examples.
After conversion and normalization, compute EV per unit stake using normalized probabilities and payout multiples. EV is p times m minus (1 minus p). Compare both EVs to see which trade offers a higher expected return per stake Expected Value (EV): Definition, Formula, and Examples.
Next, apply the Kelly fraction using your edge and odds to get an optimal fraction of bankroll, then consider fractional Kelly to limit drawdown risk Kelly Criterion: Definition, Formula, and Example.
Finally, evaluate whether the two trades are correlated. If they are independent, you can add EVs for an expectation of combined return. If they are positively correlated, adjust stakes downward or compute combined variance before deciding Correlation: What It Means in Finance, With Examples.
Quick checklist and cheatsheet for comparing two trades
1. Convert both quotes to implied probability consistently. 2. Remove bookmaker margin by normalization. 3. Compute EV per unit stake for each trade. 4. Compute a Kelly-based stake, reduce to a fractional Kelly if uncertain. 5. Check volatility and correlation, then decide size and keep a record.
Quick fixes: if a market omits an outcome, estimate and include it before normalization; if edges are noisy, default to a smaller fractional Kelly; if trades correlate, reduce combined stakes to control variance.
When to prioritize EV and when to prioritize risk-adjusted metrics
EV is the core long-run metric: it ranks trades by average return per stake. For long horizons and many independent repetitions, EV drives expected bankroll growth Expected Value (EV): Definition, Formula, and Examples.
Prioritize risk-adjusted metrics like Kelly sizing or Sharpe-related checks when your bankroll is small, your horizon is short, or edges are noisy. These metrics trade some long-run growth potential for lower short-term risk and smoother equity trajectories Kelly Criterion: Definition, Formula, and Example.
As a rule of thumb, use EV for ranking and Kelly for sizing, with fractional Kelly as a conservative default when probability estimates are uncertain.
Conclusion: practical rules to compare two trades with different odds
Convert odds to implied probability, remove the vig with normalization, compute EV per unit stake, then translate edge into conservative stake sizes using fractional Kelly. Check volatility and correlation before combining positions and document all assumptions.
Test the workflow with paper trades or a virtual funded account, log results, and iterate on your probability estimates. Consistency in method and conservative sizing help manage variance while you refine edge estimation.
Convert American odds to decimal first using the sign-specific formula, then take 1 divided by the decimal odds to get implied probability.
Divide each quoted implied probability by the sum of all quoted probabilities to normalize them so they sum to one.
Use fractional Kelly when probability estimates are noisy, your bankroll is small, or you want to limit drawdown risk; half-Kelly is a common conservative choice.
References
- https://www.investopedia.com/terms/i/implied-probability.asp
- https://help.smarkets.com/hc/en-gb/articles/115005310945-Understanding-betting-margins-overround-and-why-they-matter
- https://www.investopedia.com/terms/e/expectedvalue.asp
- https://www.fundedplays.com/challenges
- https://www.investopedia.com/terms/k/kellycriterion.asp
- https://www.investopedia.com/terms/s/sharperatio.asp
- https://www.investopedia.com/terms/c/correlation.asp
- https://oddsjam.com/betting-calculators/no-vig-fair-odds
- https://therundown.io/betting-calculators/no-vig-calculator
- https://www.actionnetwork.com/education/remove-juice-vig
- https://www.fundedplays.com/blogs/how-fundedplays-evaluations-work
- https://www.fundedplays.com/blogs
- https://www.fundedplays.com