
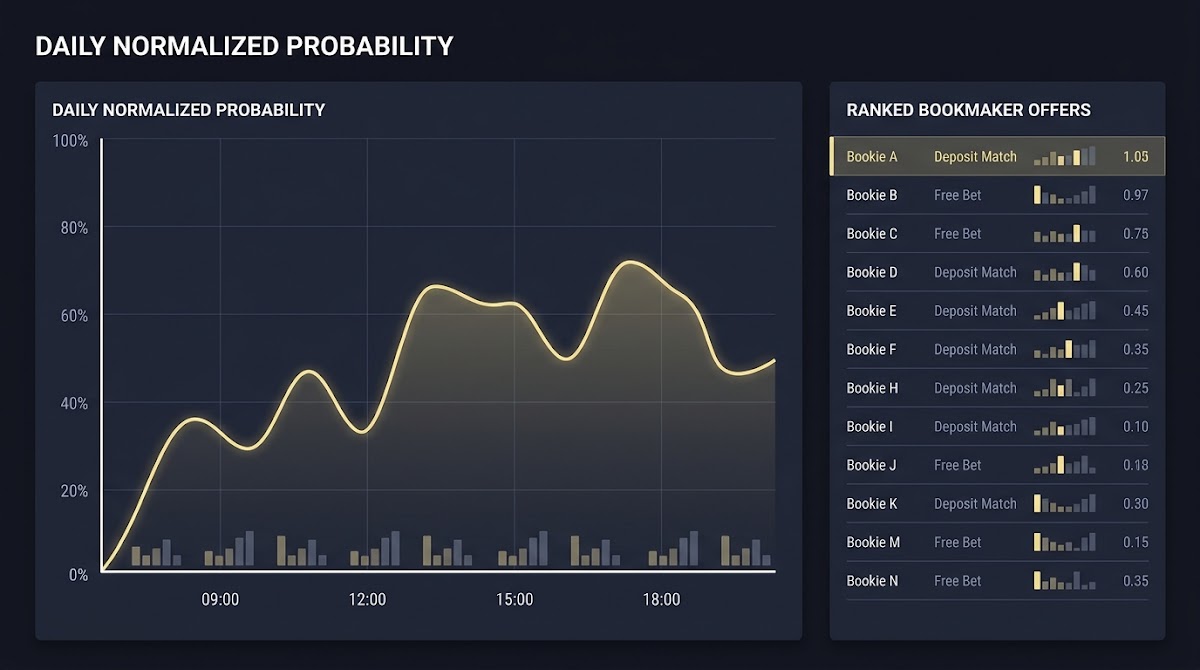
Why disciplined price comparison matters in modern sports markets
Price in a sports market is not the printed odds but the implied probability behind that quote after you account for the bookmaker overround. Converting odds into implied probability and removing the margin is the only way to compare offers from different books on an apples-to-apples basis.
Regulated U.S. markets have expanded rapidly, bringing more licensed books and wider line dispersion, which increases the potential value of disciplined price shopping; this expansion also makes systematic comparison more useful for consistent decision-making State of the States 2025: The AGA Survey of the Commercial Casino Industry.
Collect matching odds, convert all formats to decimal, compute implied probabilities, remove the overround with a documented de-vig method, and rank normalized probabilities; document each step for reproducibility.
In practical terms, disciplined price comparison follows a repeatable five-step workflow: collect odds, standardize formats to a common base, compute implied probabilities, remove the bookmaker margin with a documented de-vig method, and then rank normalized prices to find the best available fair probability.
To keep this article actionable we treat price dispersion as the difference between quoted implied probabilities across books after de-vig, and we illustrate with spreadsheet-ready steps you can copy into a script or report.
Odds formats and how to compute implied probability
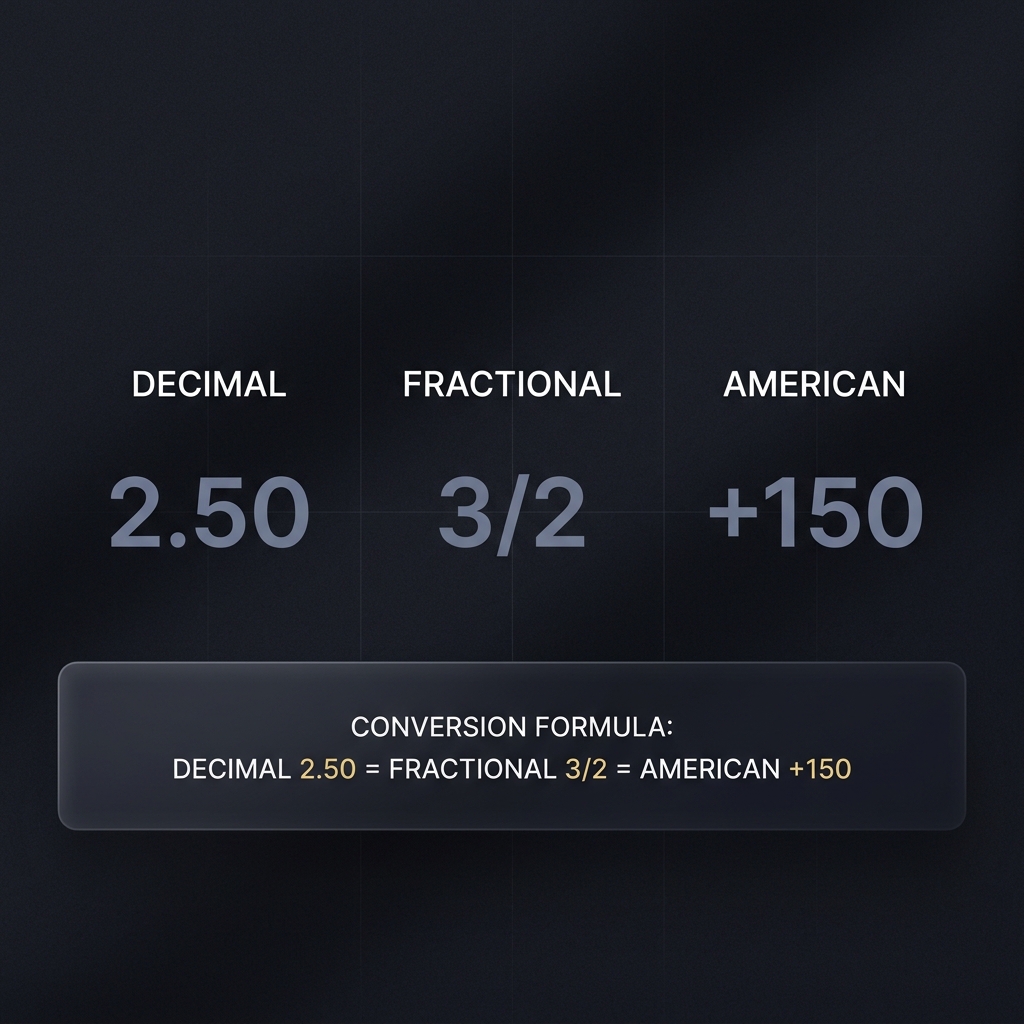
Three common odds formats appear across markets: decimal, fractional, and American. Decimal odds are the simplest to convert: implied probability equals 1 divided by the decimal odd. For example, decimal 2.50 implies probability 1 / 2.50 = 0.40, or 40 percent. Educational resources summarize these conversions and the standard formulas used in practice How to calculate implied probability.

Fractional odds such as 6/4 convert by dividing the numerator by the sum of numerator and denominator, so 6/4 gives implied probability 4 / (6 + 4) = 0.40 when expressed in decimal form internally. American odds convert differently depending on sign: positive American odds (for underdogs) use 100 / (odds + 100) after mapping to a multiplier, while negative odds (for favorites) use the absolute odds value divided into the sum. These standard formulas and worked examples are explained by industry education material Odds and probability explained.
When converting many lines at scale, rounding choices matter. Keep enough decimal places to avoid systematic bias: store intermediate implied probabilities with at least four decimal places, and only round the final reported probabilities. Rounding too early or inconsistently across books can introduce tiny biases that accumulate when ranking many markets.
ToolType: | Purpose: | Fields: | Notes:
A 5-step workflow to compare prices across books
Step 1: Collect multi-book odds reliably. Capture the same market definition from each book, timestamp each snapshot, and note whether the quote is pre-match or live. Freshness matters: poll intervals should match the market speed you monitor; for pre-match lines a few updates per day may suffice, while live markets often require second-level feeds.
Step 2: Standardize all odds to decimal odds. Use the conversions above and record the original format alongside the converted decimal to preserve an audit trail. Doing so prevents later confusion about whether a discrepancy came from a conversion error or from the book's quote.

Step 3: Compute implied probabilities from decimal odds using 1 / decimal. Store probabilities with consistent precision and tag each value with the book and timestamp so you can trace any changes back to their source.
Step 4: Apply a chosen de-vig method to remove the overround. Document the method and parameters you used in the sheet or script so results are reproducible. Popular open-source tooling documents these steps and provides tested functions you can incorporate into a spreadsheet or script implied: Functions for Implied Probabilities and Odds Conversions (CRAN package page). For an introduction to the package and its examples see the package introduction.
Step 5: Rank books by the normalized probability or fair price and present the top offers for the market. Maintain a versioned audit trail for each comparison run so anyone can re-run the same steps and verify the ranking decisions.
Across these steps, treat de-vig choice as a documented parameter. Changing the method later without re-running the full pipeline can produce inconsistent comparisons.
Removing bookmaker margin: methods and tradeoffs
One straightforward de-vig approach rescales implied probabilities proportionally so their sum equals 100 percent. This proportional adjustment is simple to implement: divide each implied probability by the total implied sum, then rescale to 100. It is transparent and fast for spreadsheets, and it is widely used as a baseline method.
A related power or additive adjustment applies a small exponent or additive correction before re-normalizing; these tweaks can slightly reduce favorite-longshot skew in the resulting probabilities but require justification for the chosen exponent. Practical guides and implementation notes for these methods are available in reproducible tool vignettes Implied probabilities and margin removal (vignette for the ‘implied’ package).
Try the reproducible comparison template on the FundedPlays Challenges sample
Download the reproducible spreadsheet template that accompanies the worked examples in this article to try different de-vig methods on a sample dataset.
The Shin model offers a different perspective: it assumes an insider-risk term that changes how market information and informed traders affect quoted odds, and it infers an adjustment by estimating the degree of insider trading implicit in the overround. Because the model rests on a different set of assumptions, it can produce different normalized probabilities than simple proportional methods, especially in markets with favorite-longshot skew Measuring the Incidence of Insider Trading in a Market for State-Contingent Claims.
Which method you choose affects ranking. For small margins the differences may be subtle, but when margins vary across books or when markets show strong skew, method choice can change which book appears best for a given event. That sensitivity is why documentation and consistency matter: pick a method and re-run comparisons under that fixed choice to avoid analytic drift.
Choosing a de-vig method: decision criteria and tests
Start by considering market structure. In highly liquid markets with many informed participants, the Shin framework may better capture information effects; in thinner markets a proportional rescale is often adequate. The CRAN package documentation and its vignette describe these tradeoffs and provide reproducible code you can use to test choices Implied probabilities and margin removal (vignette for the ‘implied’ package).
Sample size matters. If you compare many events over time, backtest the de-vig choice against historical outcomes to see whether one method produces more stable implied estimates for your use case. Simple sensitivity checks are effective: compute ranks under two methods, count how frequently the same book is top-ranked, and inspect cases where the ranking flips. That approach gives a practical measure of robustness.
Document the chosen method and any parameters. Record the date, code or spreadsheet version, and a short rationale for the selection. This audit trail reduces bias when you repeat comparisons and helps explain any changes in rank that arise from methodological updates, rather than from market movements.
Common mistakes and pitfalls to avoid
Do not compare raw implied probabilities across books before removing the margin. Raw probabilities will typically sum to more than 100 percent because of the overround; comparing them directly confuses book price with the bookmaker margin and often favors books with larger margins.
Watch for market definition mismatches. Two books may publish lines that look similar but are different markets: for example, a totals line at 42.5 and one at 43 are not equivalent. Confirm the exact market and line before you convert and include an explicit check for matching line values in your data collection step.
Timing errors and stale odds are common. Quotes change continuously, and a mismatch in timestamps can make a book appear to offer a better price simply because you compared an earlier value to a later one. Always store timestamps and, for live markets, ensure your polling cadence matches the market speed.
Worked examples and reproducible templates
Head-to-head example: two books publish decimal odds of 1.90 and 2.10 for the same match outcome. Convert to implied probabilities: 1 / 1.90 = 0.5263 and 1 / 2.10 = 0.4762. Sum of raw probabilities is 1.0025, a small overround in this simple example. Apply a proportional de-vig by dividing each implied value by the sum and rescaling to 100 percent to get normalized probabilities you can then compare directly.
For a totals or three-way market, the workflow is the same but watch for market complexity: multi-way markets require the same de-vig across all outcomes in the set so probabilities still sum to 100 percent after adjustment. The CRAN implied package includes examples of multi-way adjustments and code that you can adapt to spreadsheets or scripts implied: Functions for Implied Probabilities and Odds Conversions (CRAN package page).
Checklist for building a reproducible spreadsheet or script: (1) log source book and timestamp, (2) keep original format and converted decimal side-by-side, (3) compute raw implied probabilities with consistent precision, (4) apply the documented de-vig method, and (5) output ranked fair probabilities and the full audit trail. Following these steps lets you re-run analyses and share results with colleagues without ambiguity.
Conclusion and practical next steps
Comparing prices across sports markets requires more than eyeballing odds: you must convert formats consistently, remove the bookmaker overround with a documented de-vig method, and then rank normalized probabilities. This reproducible five-step workflow reduces bias and improves the repeatability of price shopping. For more on Funded Plays and related resources see Funded Plays.
Immediate next steps: reproduce the head-to-head example in a spreadsheet, try at least two de-vig methods on a small sample, and document your chosen method. You can read more on evaluations and sharing results on our blog or the detailed post on how Funded Plays evaluations work here. Wider markets and more regulated books create opportunities for finding better prices, but those opportunities require disciplined comparison rather than guesswork.
De-vig is the process of removing the bookmaker margin from quoted odds so implied probabilities sum to 100 percent; it is necessary to compare fair prices across books.
For live markets a simple proportional rescale is often a practical baseline; test sensitivity with samples and document your choice before deploying at scale.
No, single snapshots risk timing and stale-quote errors; use timestamps and appropriate polling frequency to ensure comparisons are fair.
References
- https://www.americangaming.org/resources/state-of-the-states-2025/
- https://help.smarkets.com/hc/en-gb/articles/115000889551-How-to-calculate-implied-probability
- https://betting.betfair.com/education/betting-guide/odds-and-probability-explained/
- https://cran.r-project.org/package=implied
- https://cran.r-project.org/web/packages/implied/vignettes/prob-implied.pdf
- https://doi.org/10.2307/2234893
- https://www.fundedplays.com/challenges
- https://cran.r-project.org/web/packages/implied/vignettes/introduction.html
- https://github.com/mberk/shin
- https://www.pinnacleoddsdropper.com/guides/how-to-devig-pinnacle-s-odds-for-betting-on-soft-books
- https://www.fundedplays.com
- https://www.fundedplays.com/blogs
- https://www.fundedplays.com/blogs/how-fundedplays-evaluations-work